COVID-19 India-Timeline an understanding across States and Union Territories
Karnataka $R_t$ Estimate
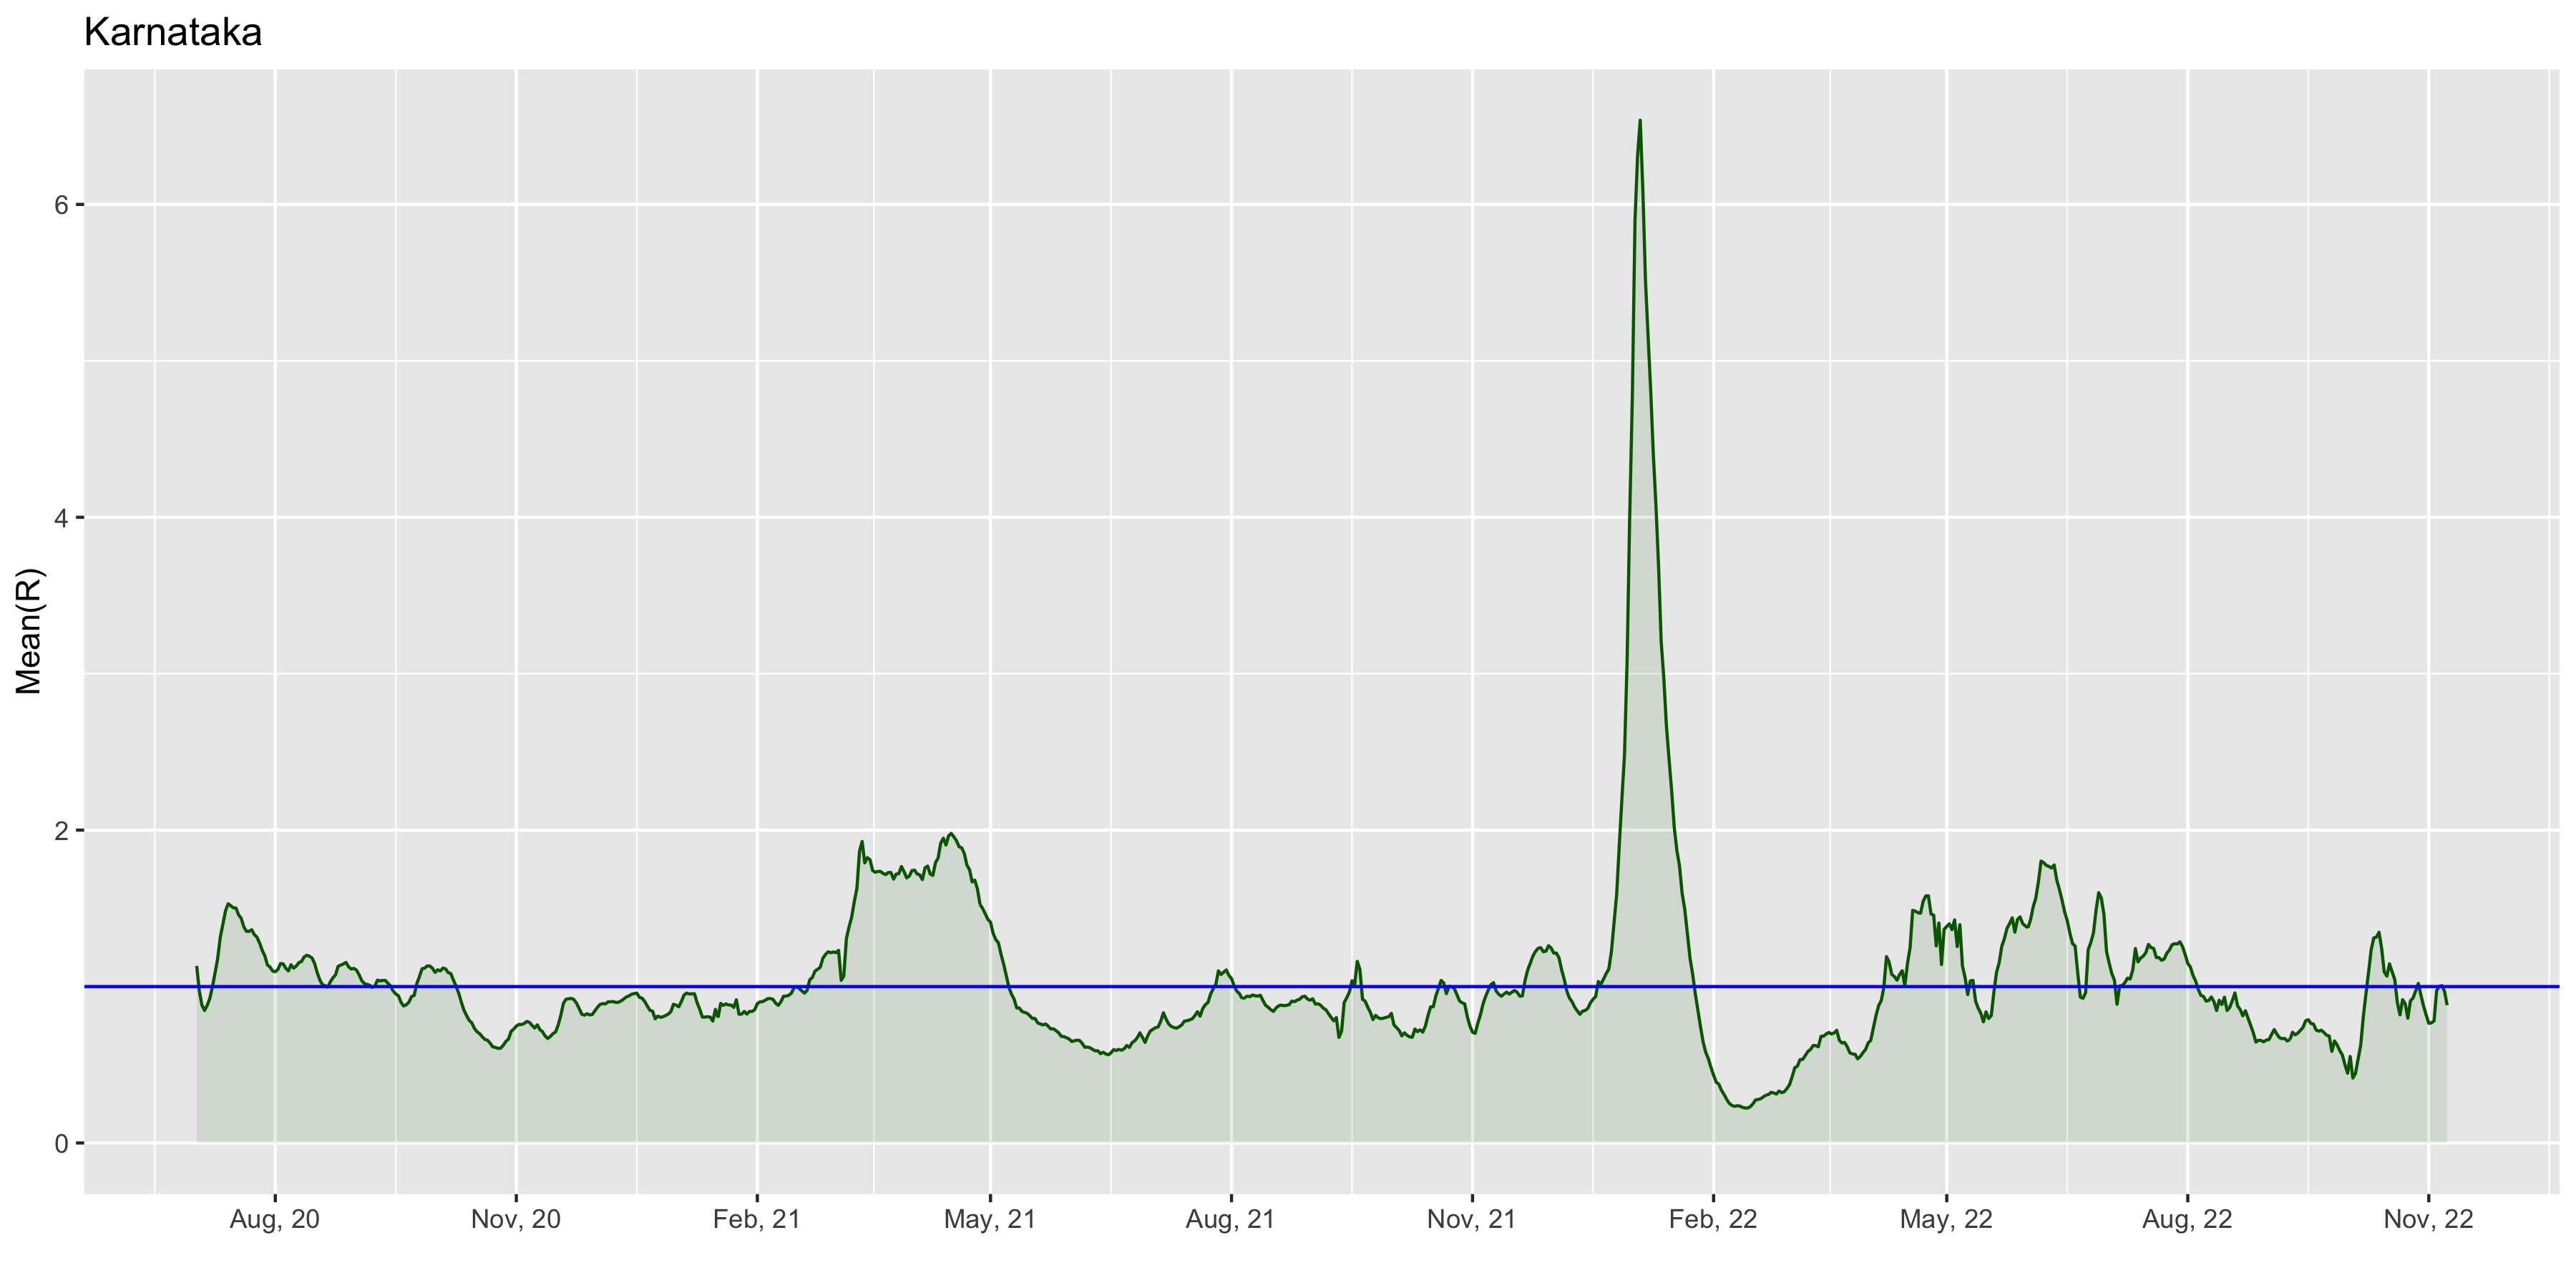
Karnataka Estimated $R_t$ on 08-11-2022 is 0.88 and by Early Warning System is 0.001
Growth Rate-District Wise
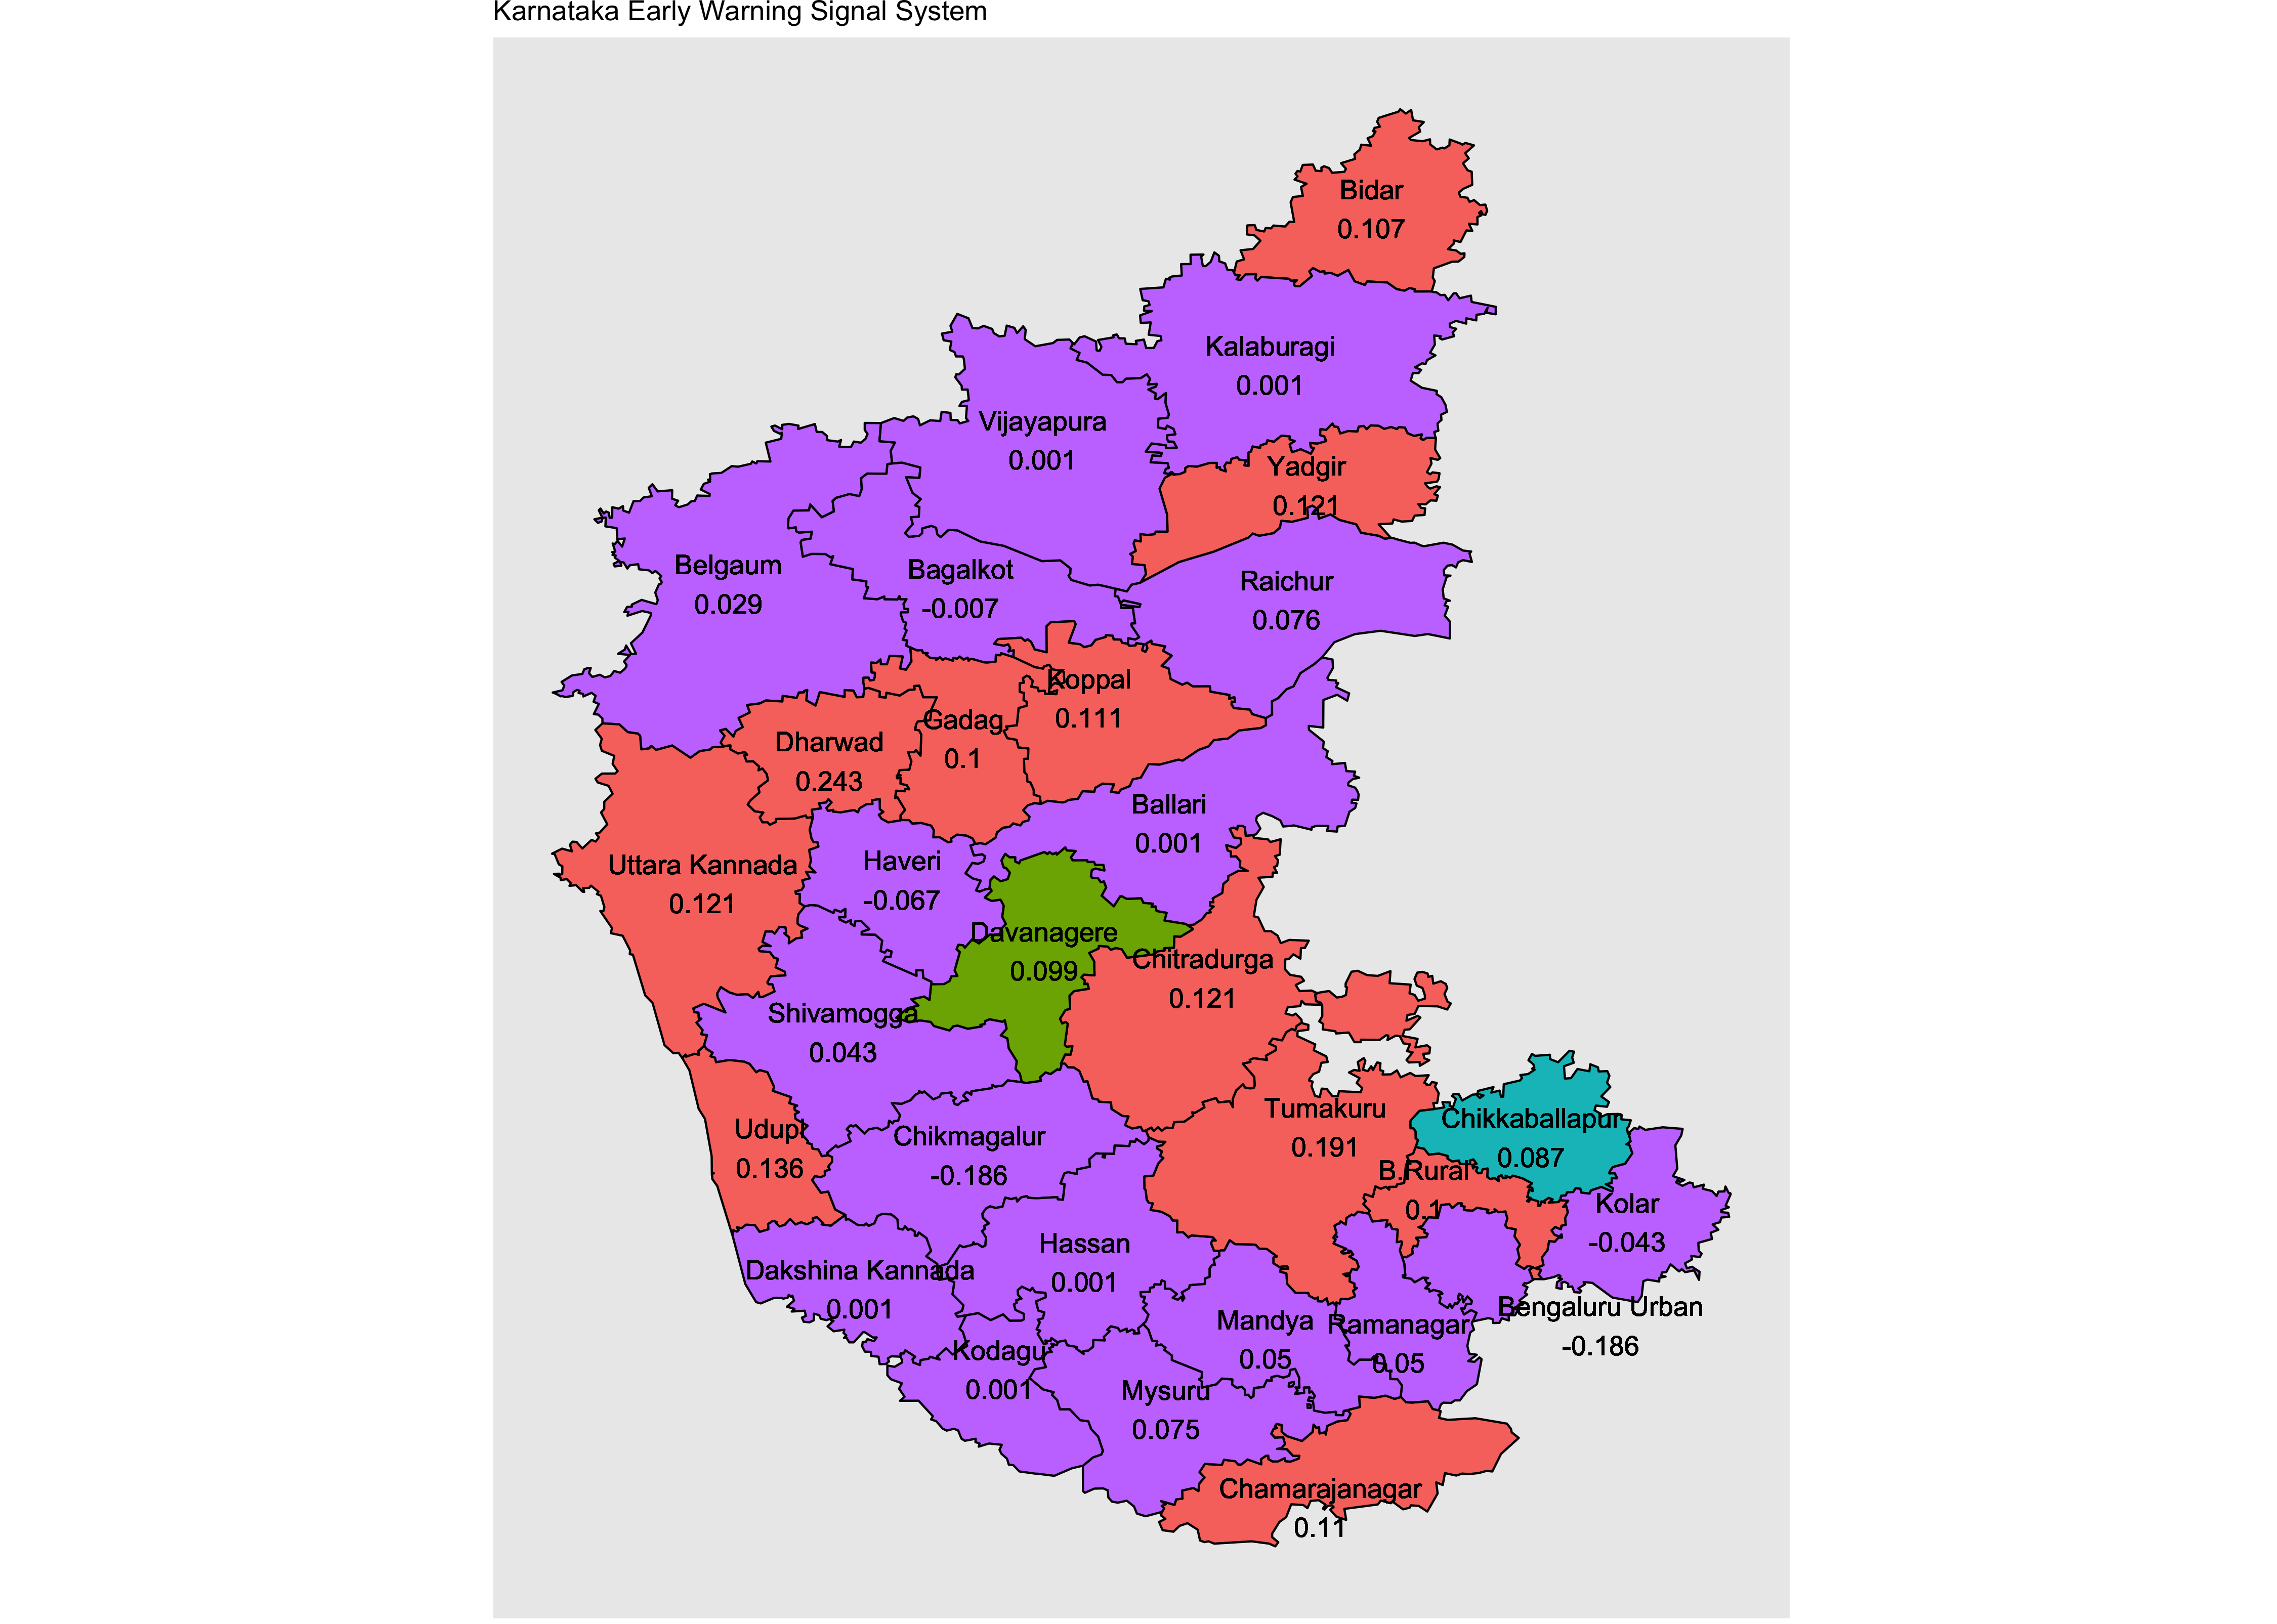
District wise Data: $R_t$ estimated on 08-11-2022 and Growth Rate
See: Early Warning System Page and $R_t$ Page for Methodology and plotsCaution: The number of Active cases in each district should be taken into account while considering the alert.
| Predicted Days to 1500 Active cases per million population is less than 100 days | |||||
|---|---|---|---|---|---|
| Days to | Days to | ||||
| District | $R_t$ | Active | Growth | 50 | 1500 |
| Cases | Rate | p.m.p | p.m.p | ||
| Growing and Alert Raised | |||
|---|---|---|---|
| District | Active Cases | $R_t$ | Growth Rate |
| Bidar | 110 | 2.1 | 0.107 |
| Stable but Need to be watched | |||
|---|---|---|---|
| District | Active Cases | $R_t$ | GrowthRate |
| Stable Growth Rate or Number of Active cases less than 50 | ||
|---|---|---|
| District | Active Cases | GrowthRate |
| Bagalkot | 0 | -0.007 |
| Ballari | 0 | 0.001 |
| Belgaum | 2 | 0.029 |
| Bengaluru Rural | 2 | 0.1 |
| Bengaluru Urban | 2 | -0.186 |
| Chamarajanagar | 4 | 0.11 |
| Chikkaballapur | 11 | 0.087 |
| Chikmagalur | 1 | -0.186 |
| Chitradurga | 0 | 0.121 |
| Dakshina Kannada | 0 | 0.001 |
| Davanagere | 10 | 0.099 |
| Dharwad | 1 | 0.243 |
| Gadag | 8 | 0.1 |
| Hassan | 0 | 0.001 |
| Haveri | 4 | -0.067 |
| Kalaburagi | 0 | 0.001 |
| Kodagu | 0 | 0.001 |
| Kolar | 4 | -0.043 |
| Koppal | 3 | 0.111 |
| Mandya | 0 | 0.05 |
| Mysuru | 1 | 0.075 |
| Raichur | 2 | 0.076 |
| Ramanagar | 1 | 0.05 |
| Shivamogga | 0 | 0.043 |
| Tumakuru | 8 | 0.191 |
| Udupi | 1 | 0.136 |
| Uttara Kannada | 0 | 0.121 |
| Vijayapura | 0 | 0.001 |
| Yadgir | 0 | 0.121 |
- Residents from outside the district undertaking vaccination in the district.
- Under Estimation of Population figures from 2011 Census.