COVID-19 India-Timeline an understanding across States and Union Territories
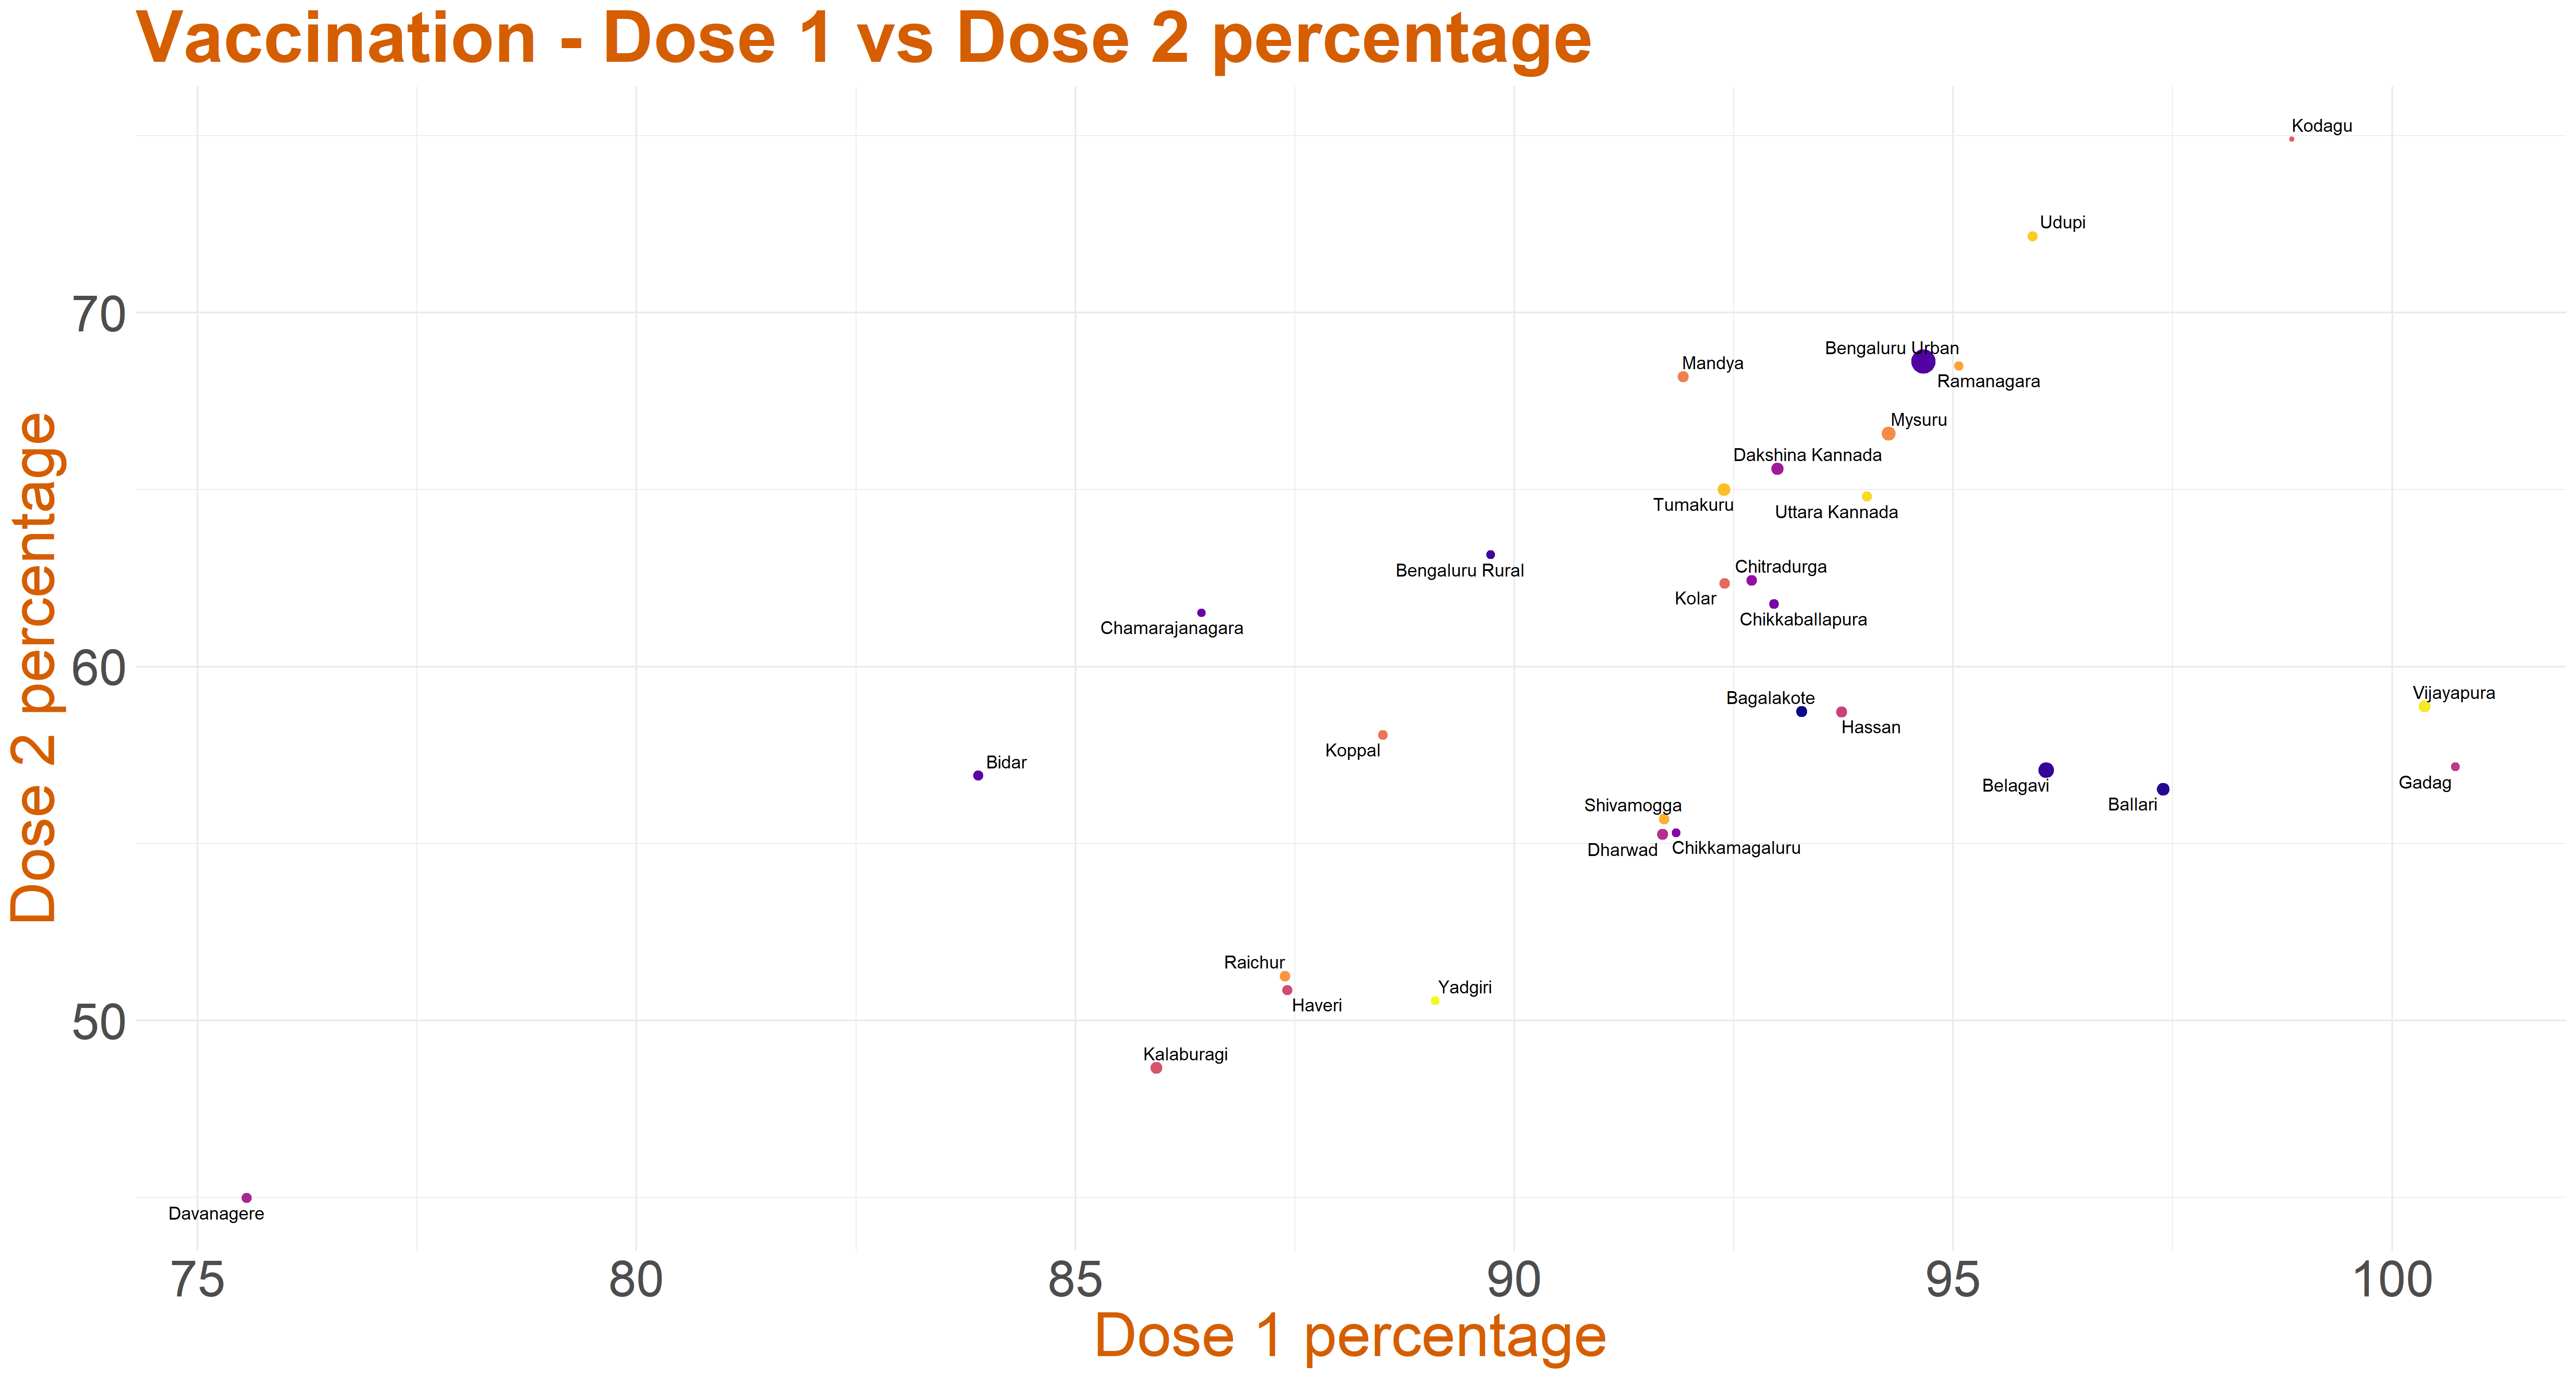
Vaccination Karnataka Districts
[Data in CSV] The data is organized like: the districts in the first column, followed by Dose 1 percentage, Dose 2 percentage w.r.t. Adult population. The next columns are Dose 1 count and Dose 2 count. The last three columns are 2011 Census (18-plus) Population, 2020 Projected population and the factor used to obtain it.
The data is considered from 18/01/2021 till present. Data on 31/01/2021, 23/02/2021, 27/02/2021 and 28/02/2021 were not included. Data from 25/04/2021 was removed since it wasnt cumulative, data from 12/05/2021 and 20/07/2021 were removed to avoid inconsistencies.
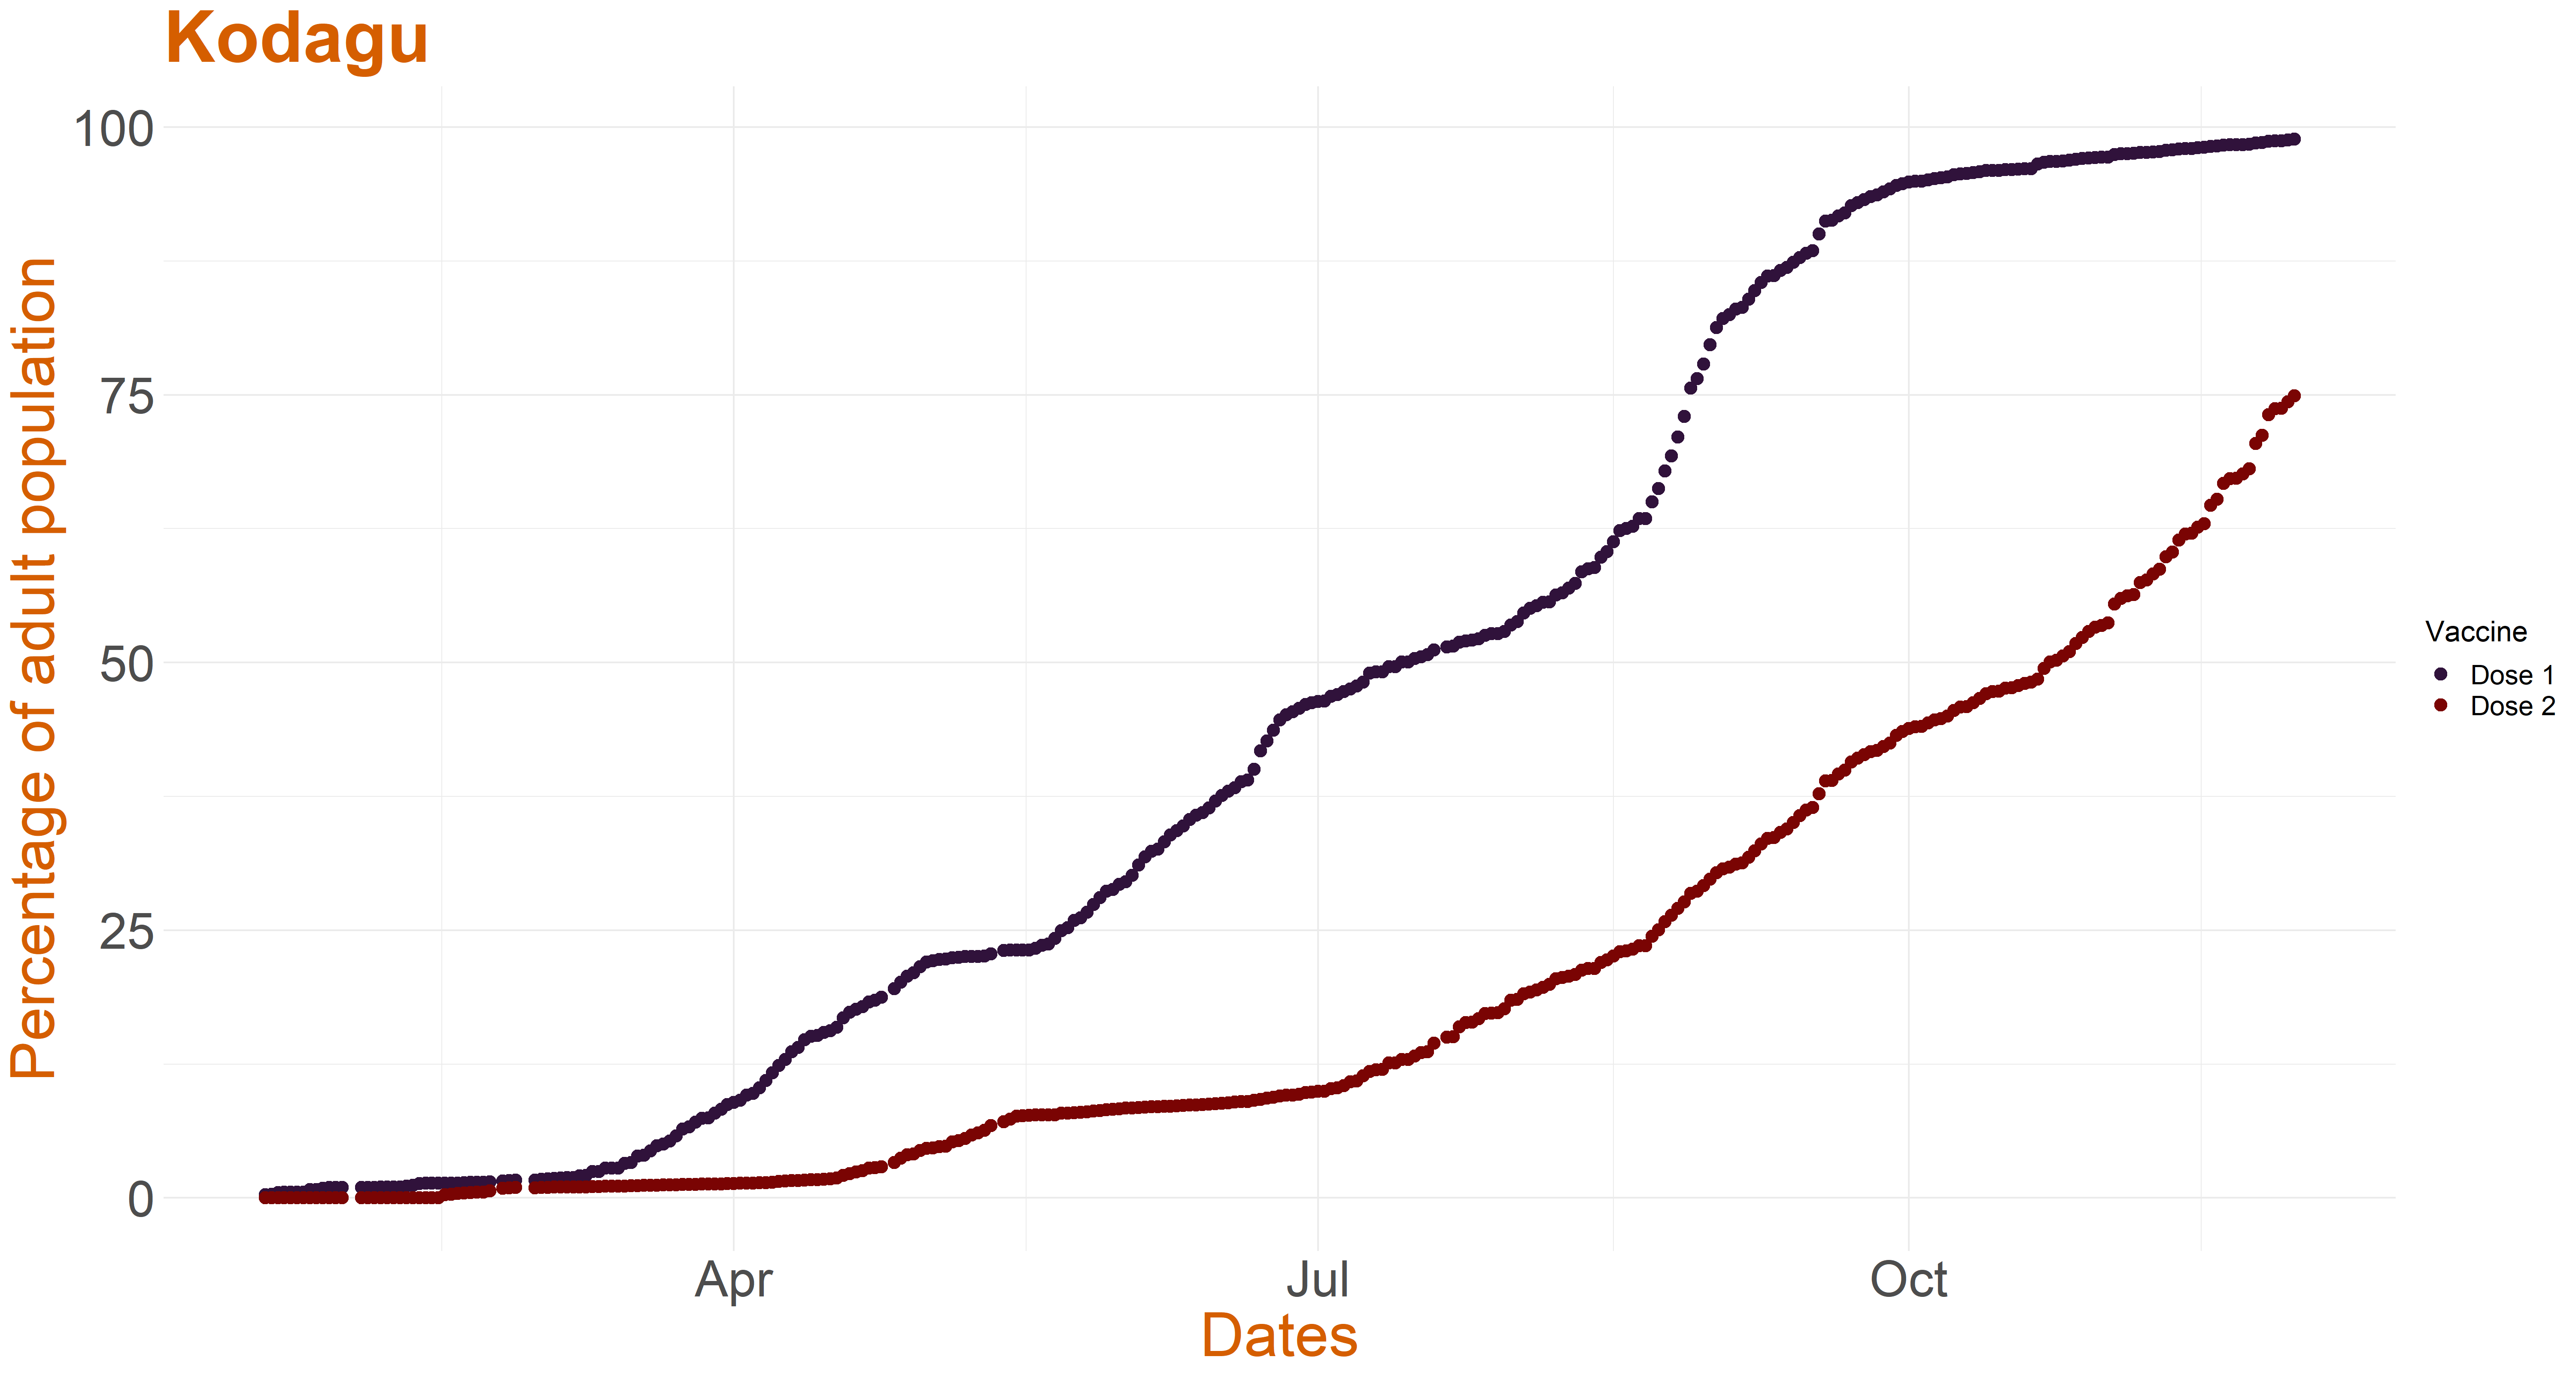
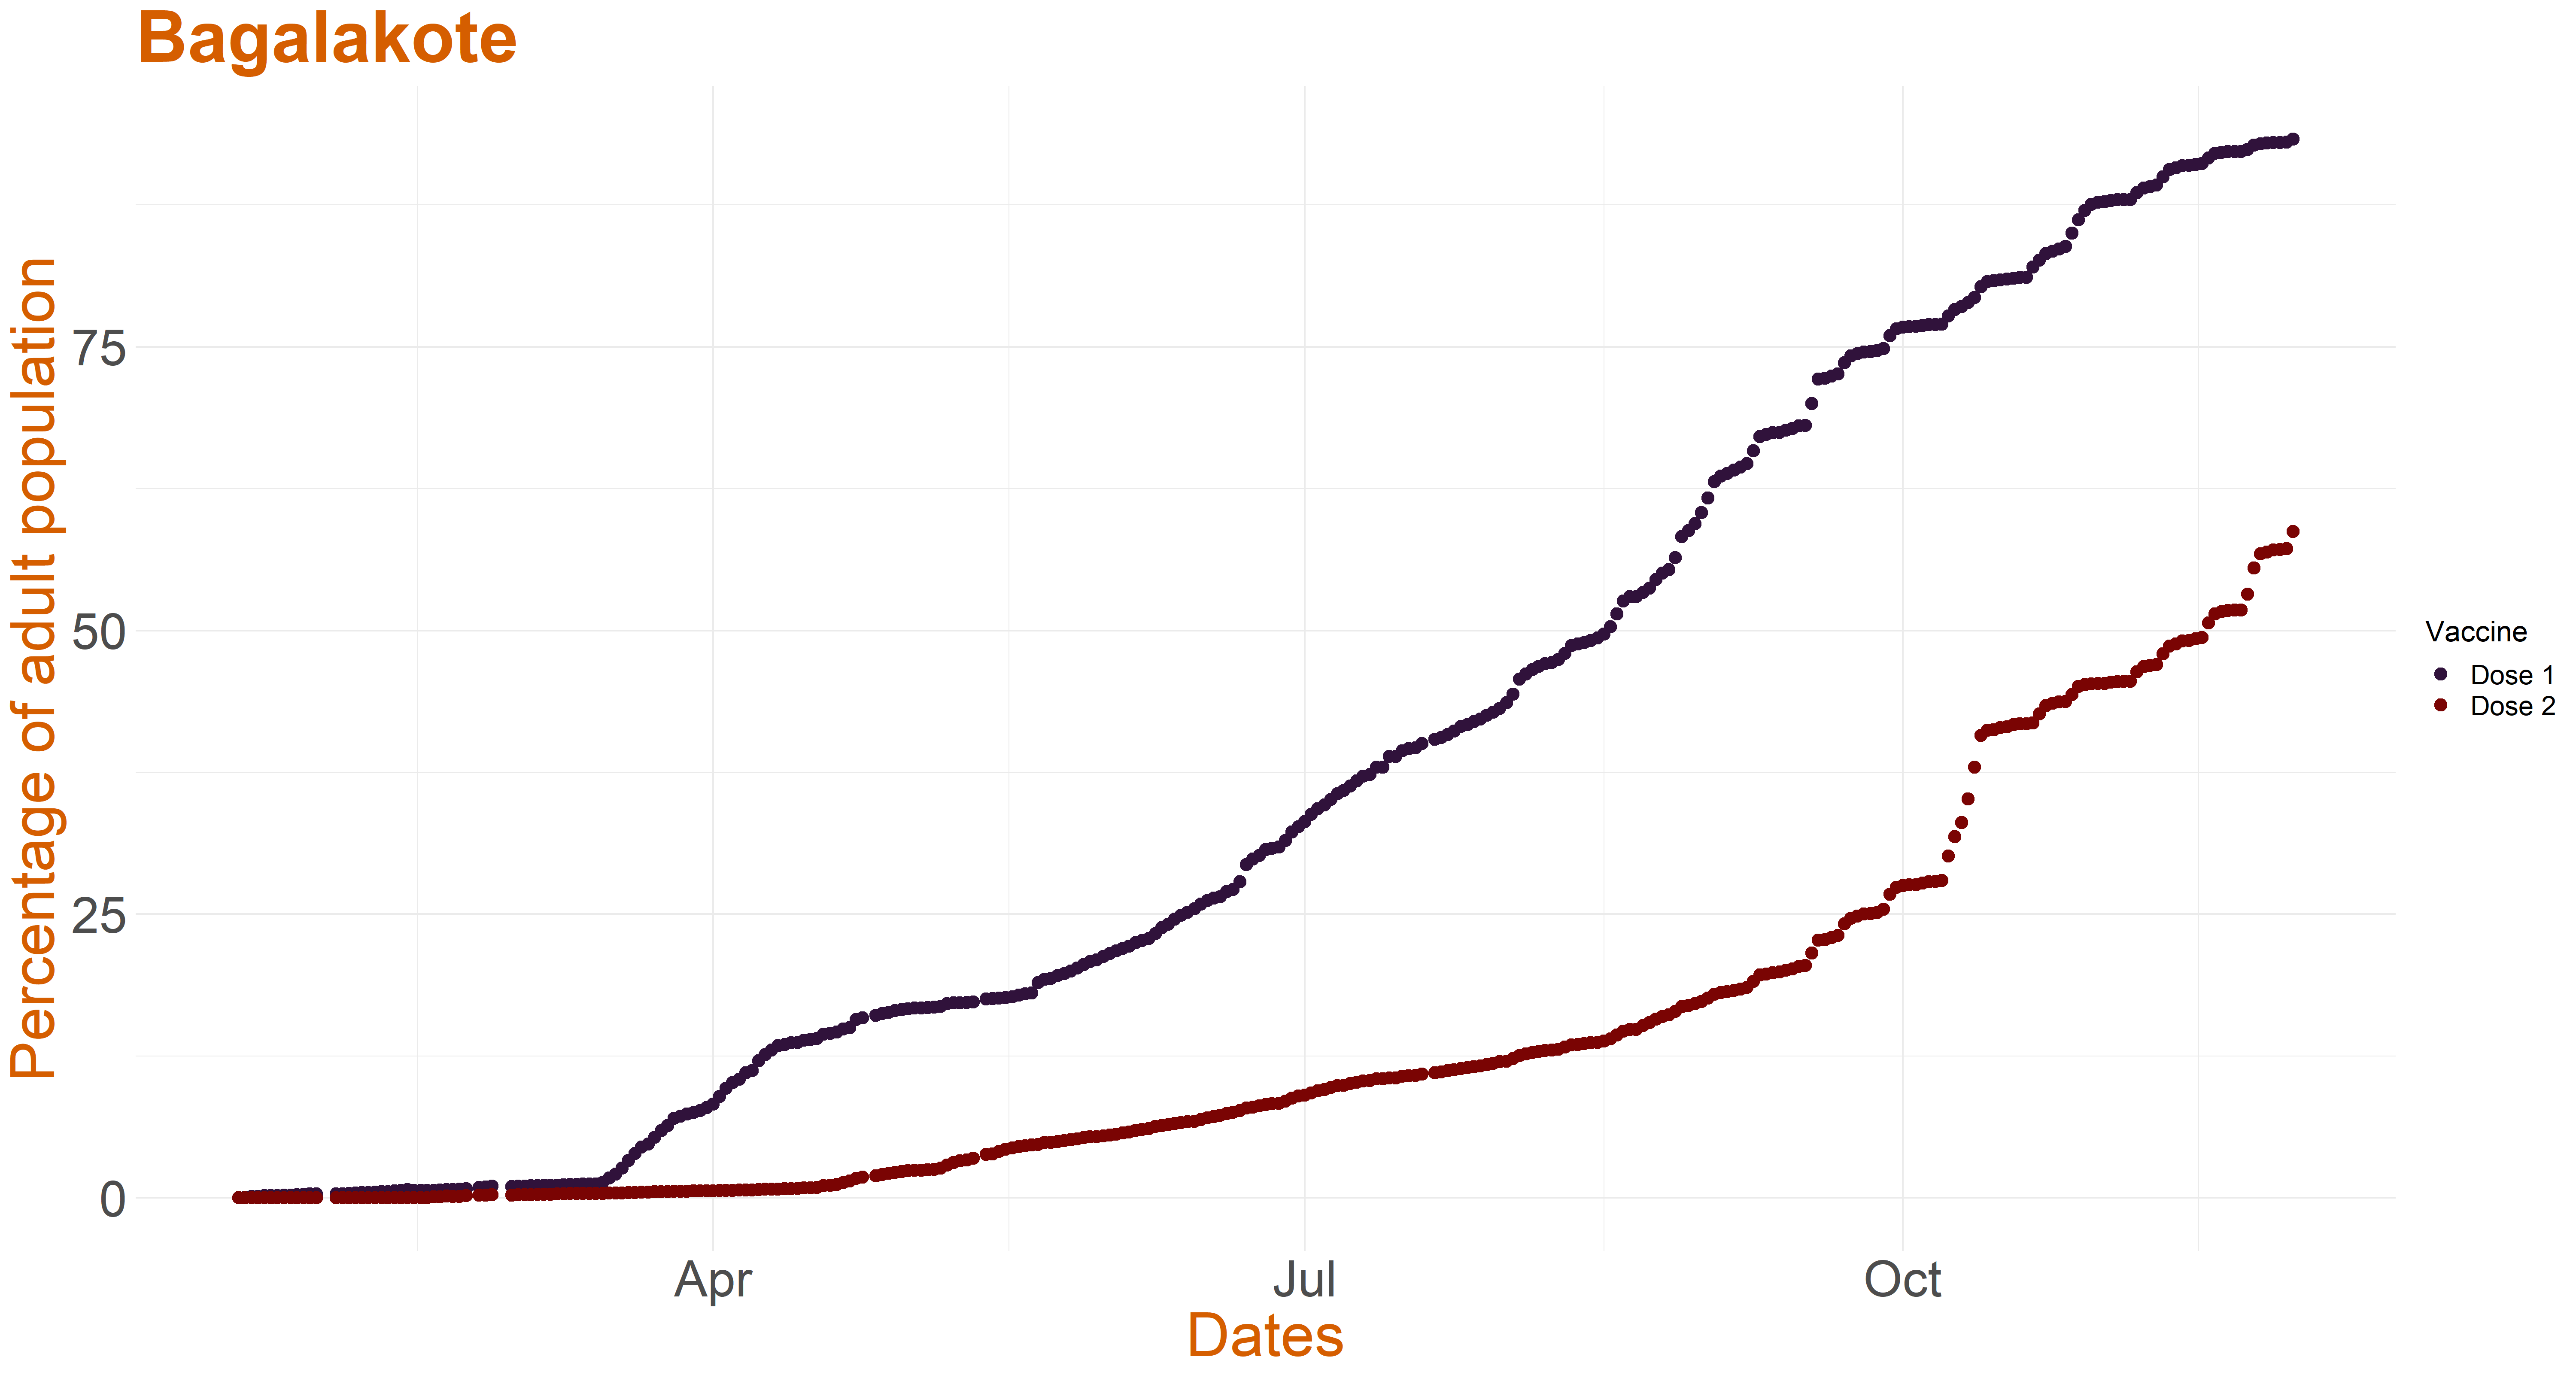
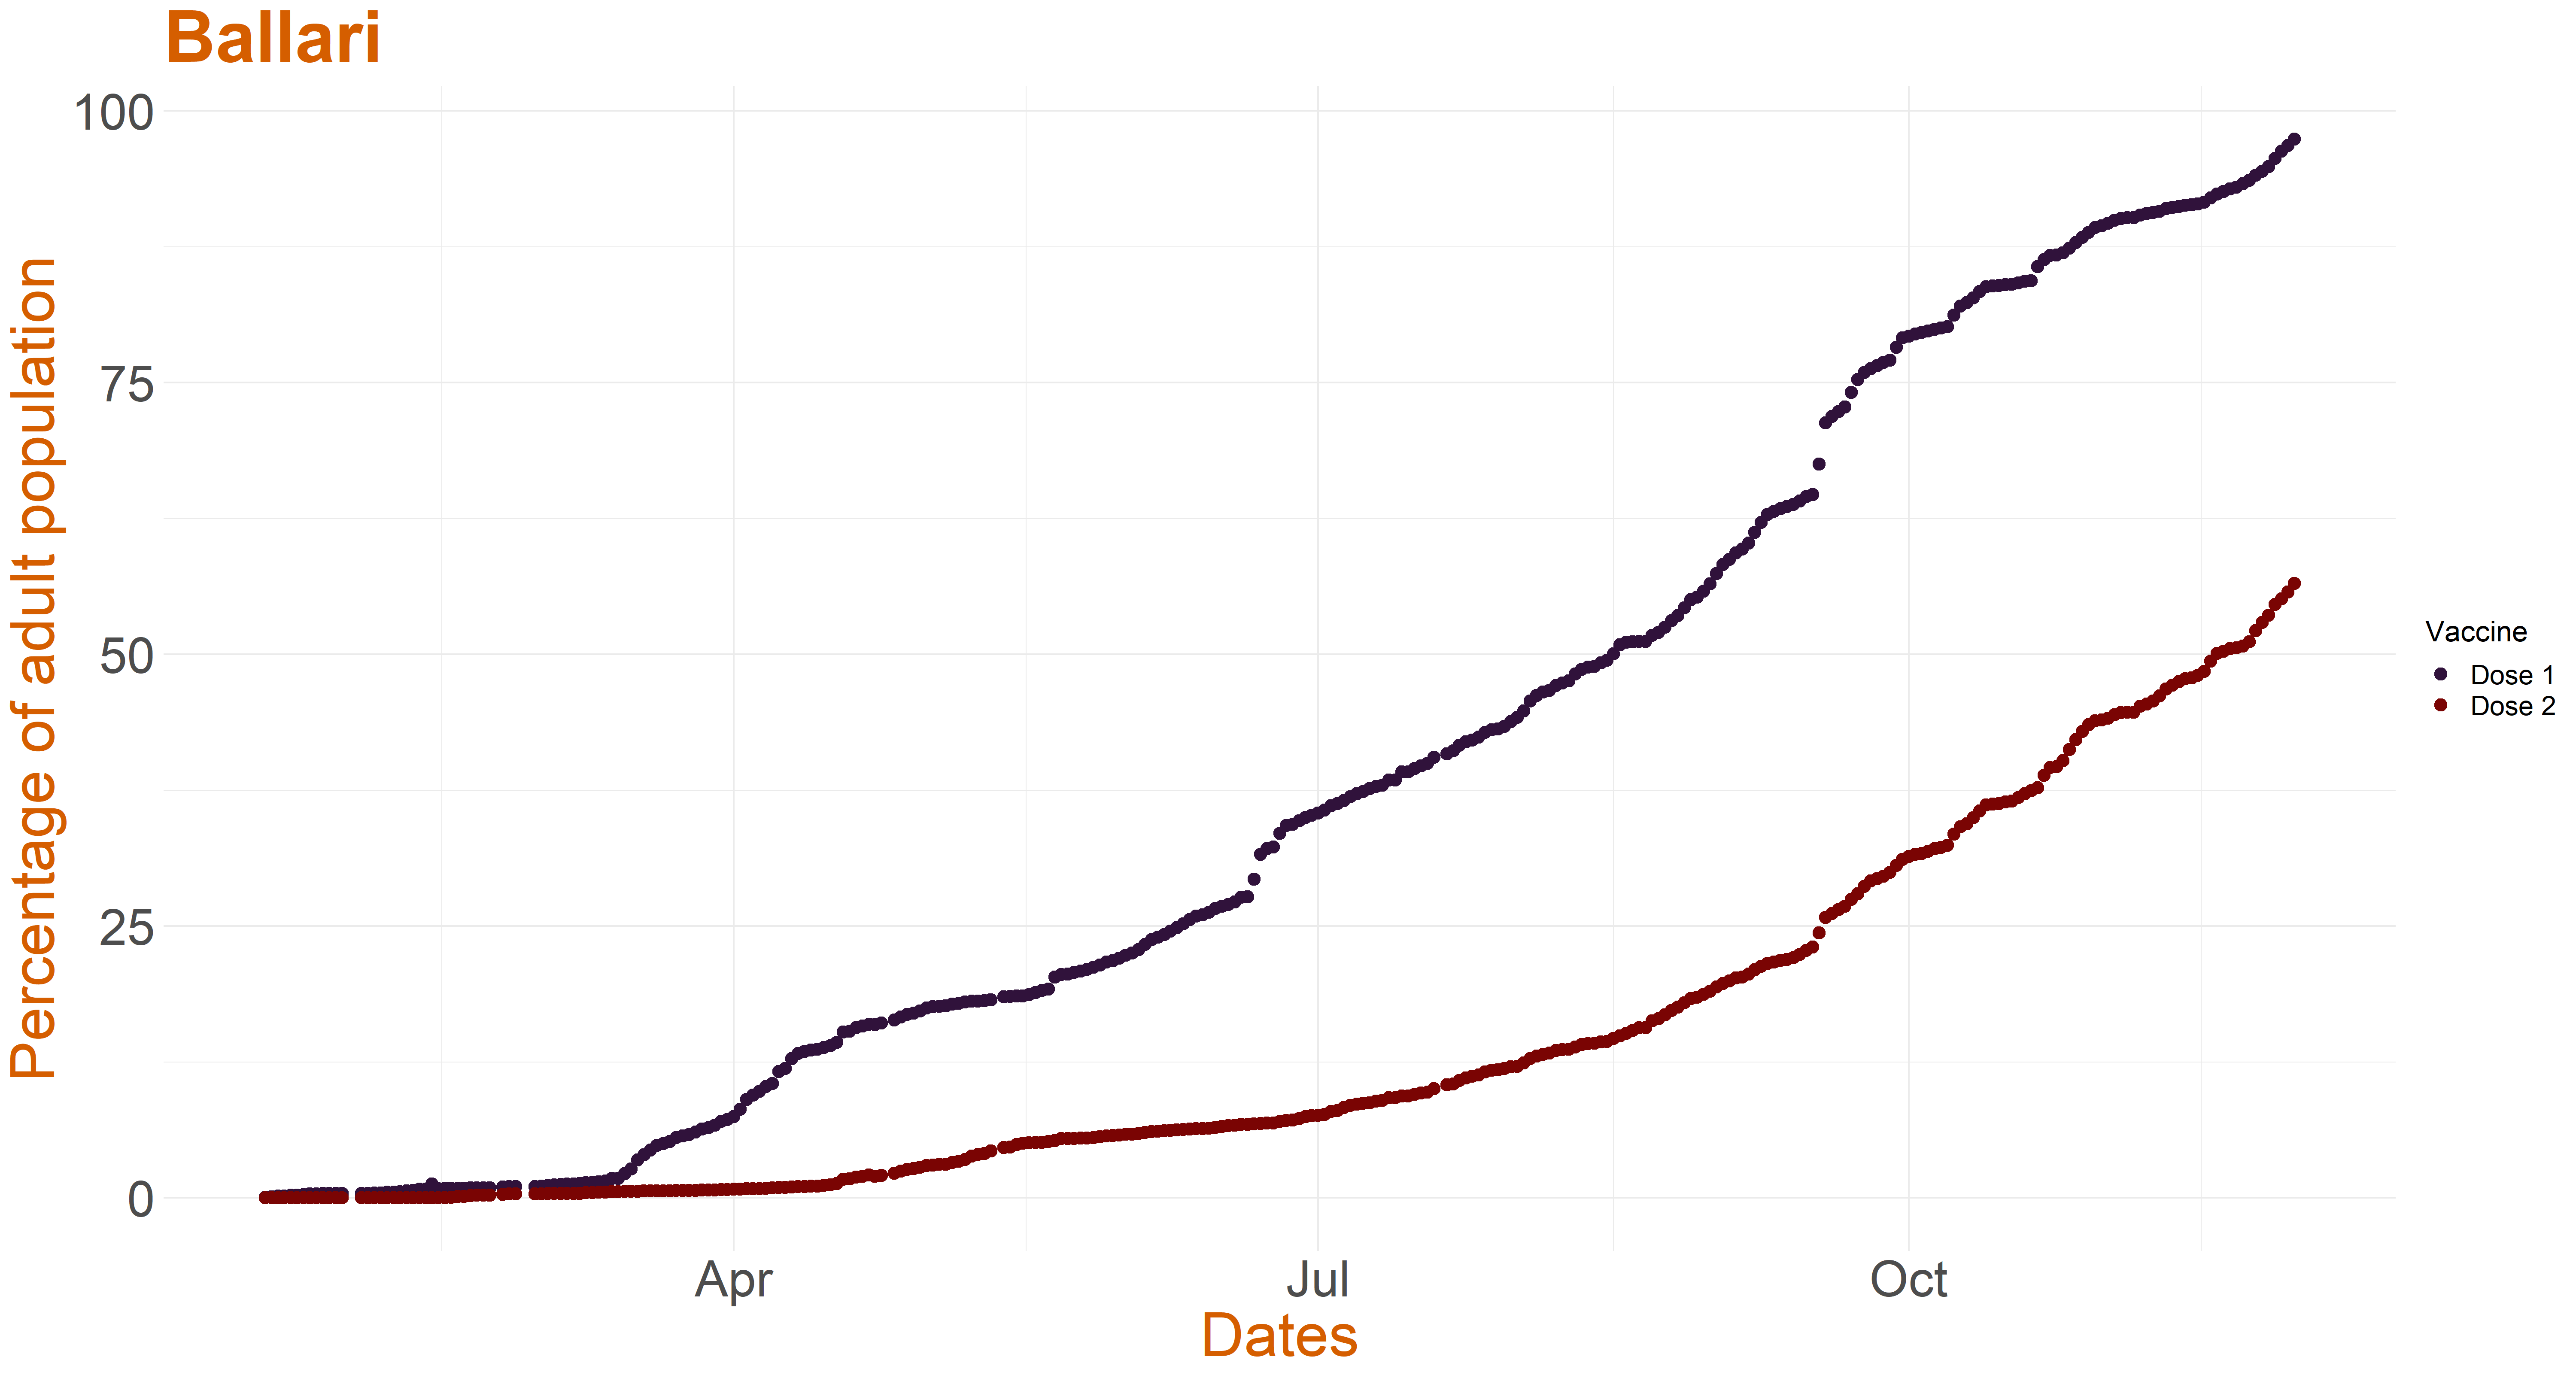
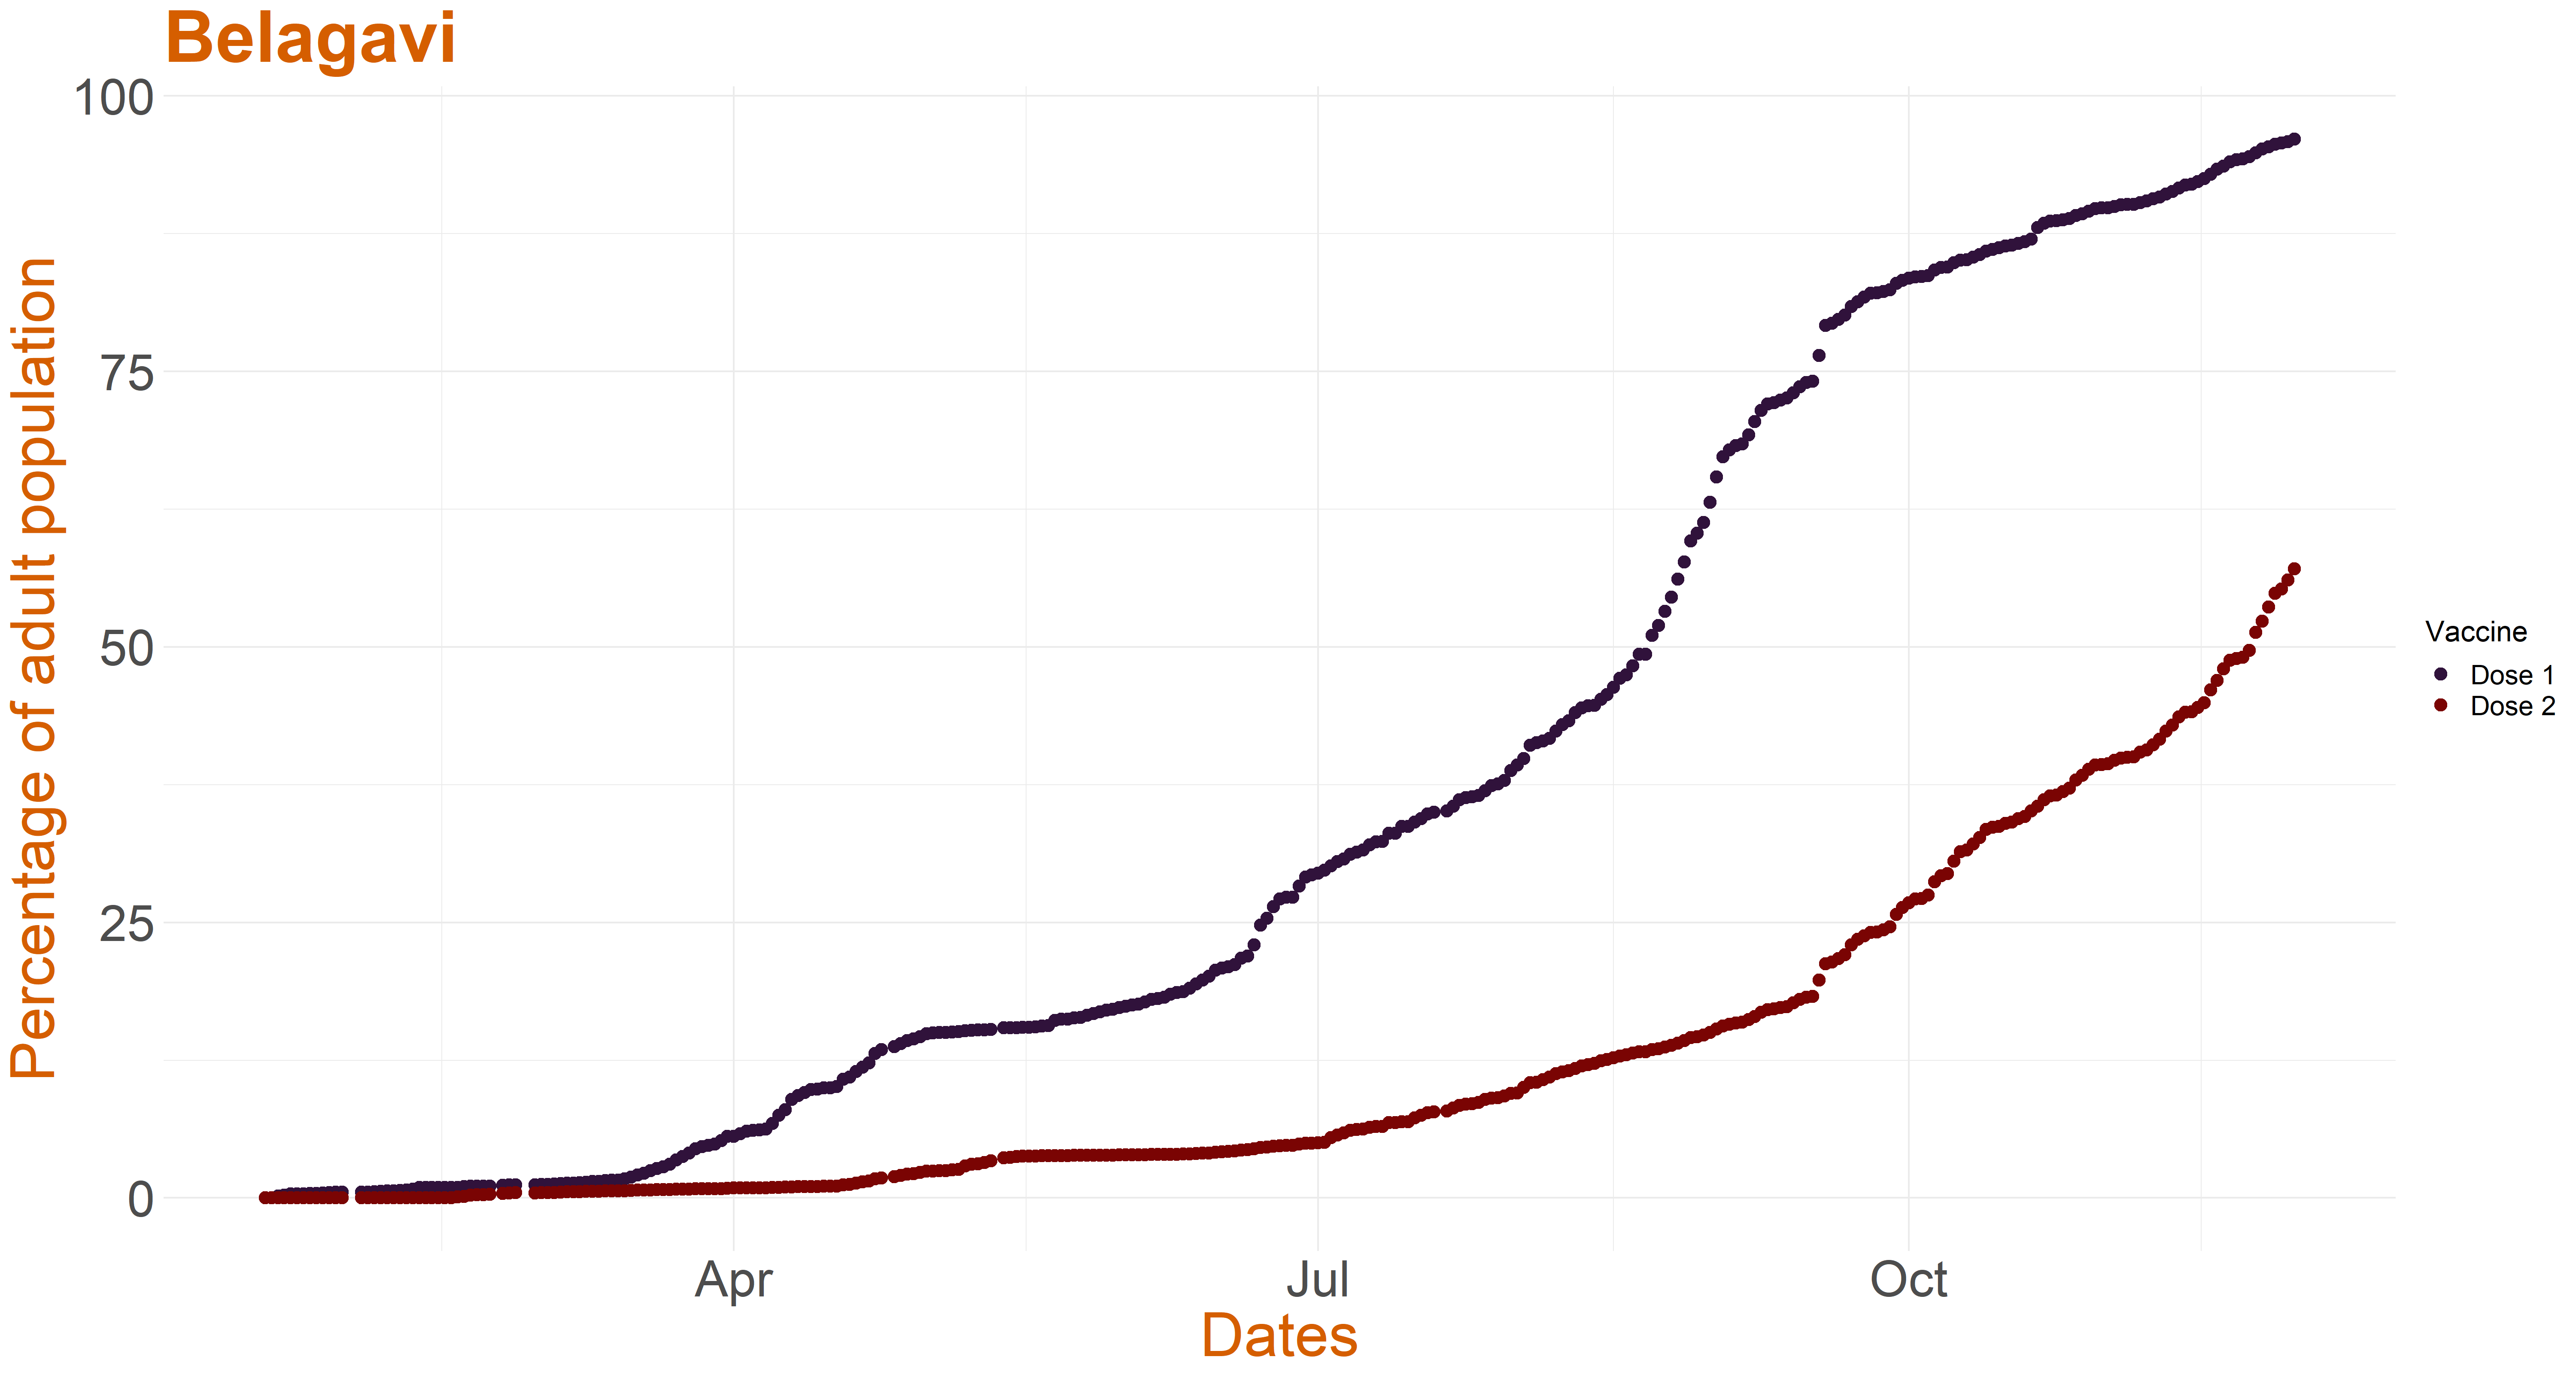
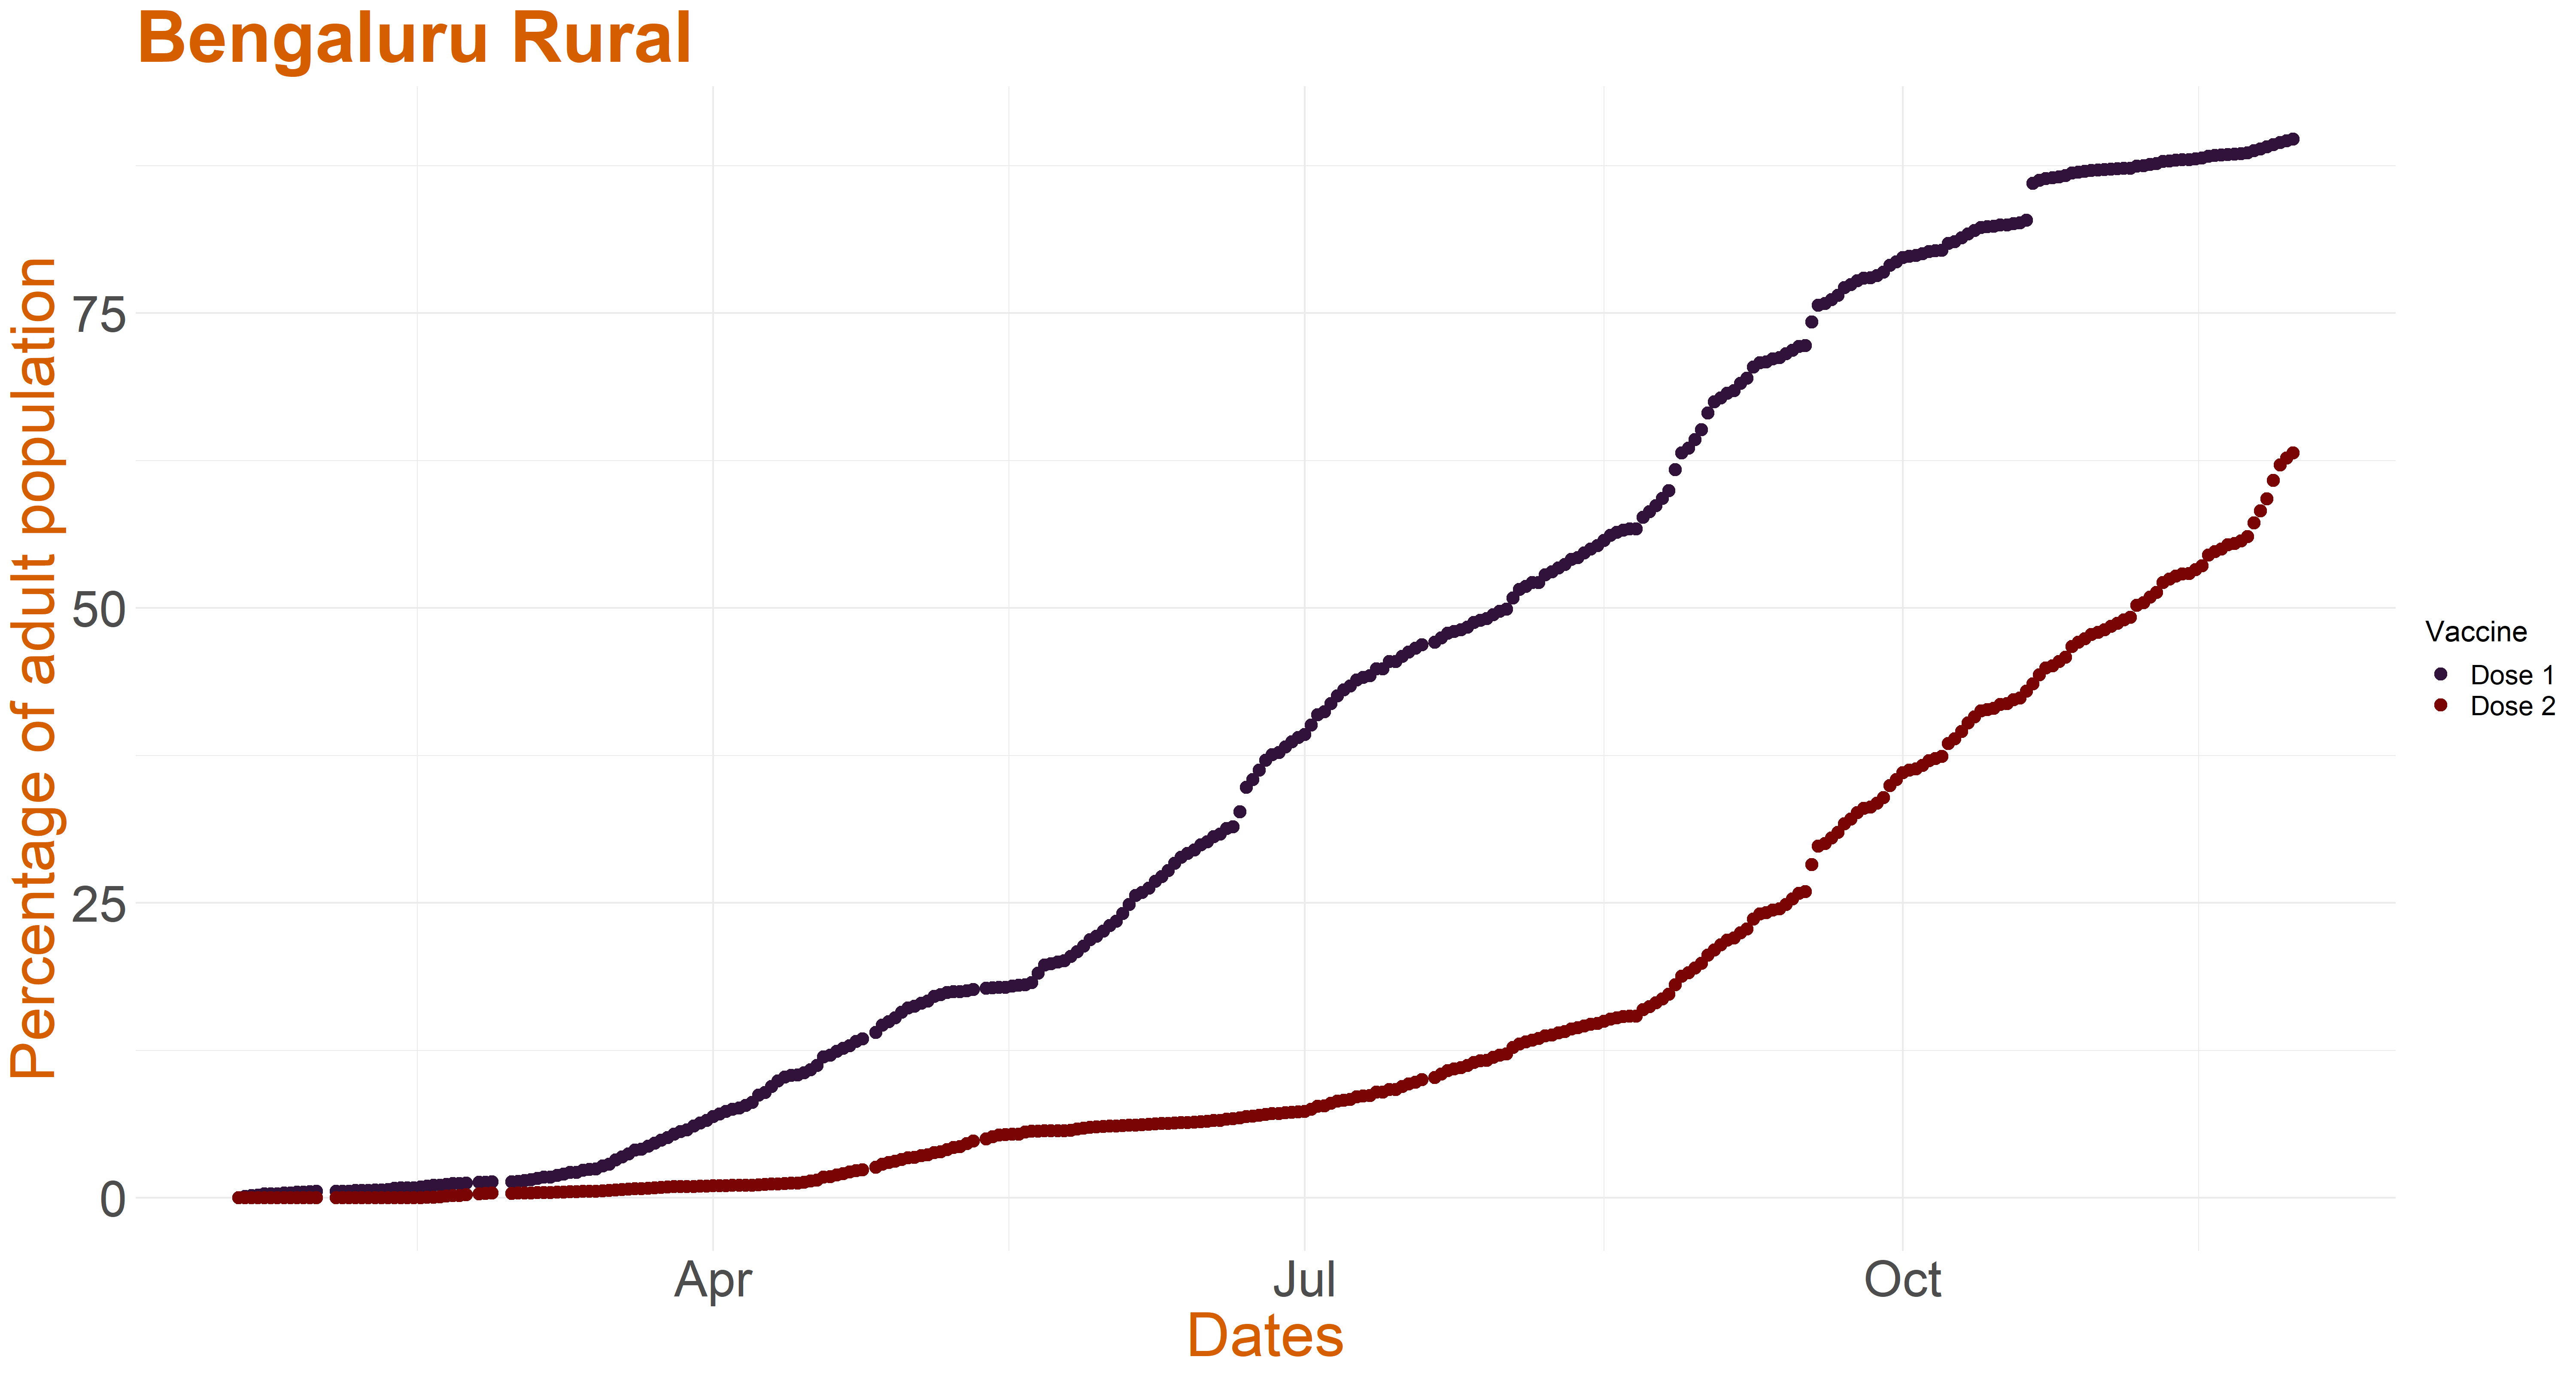
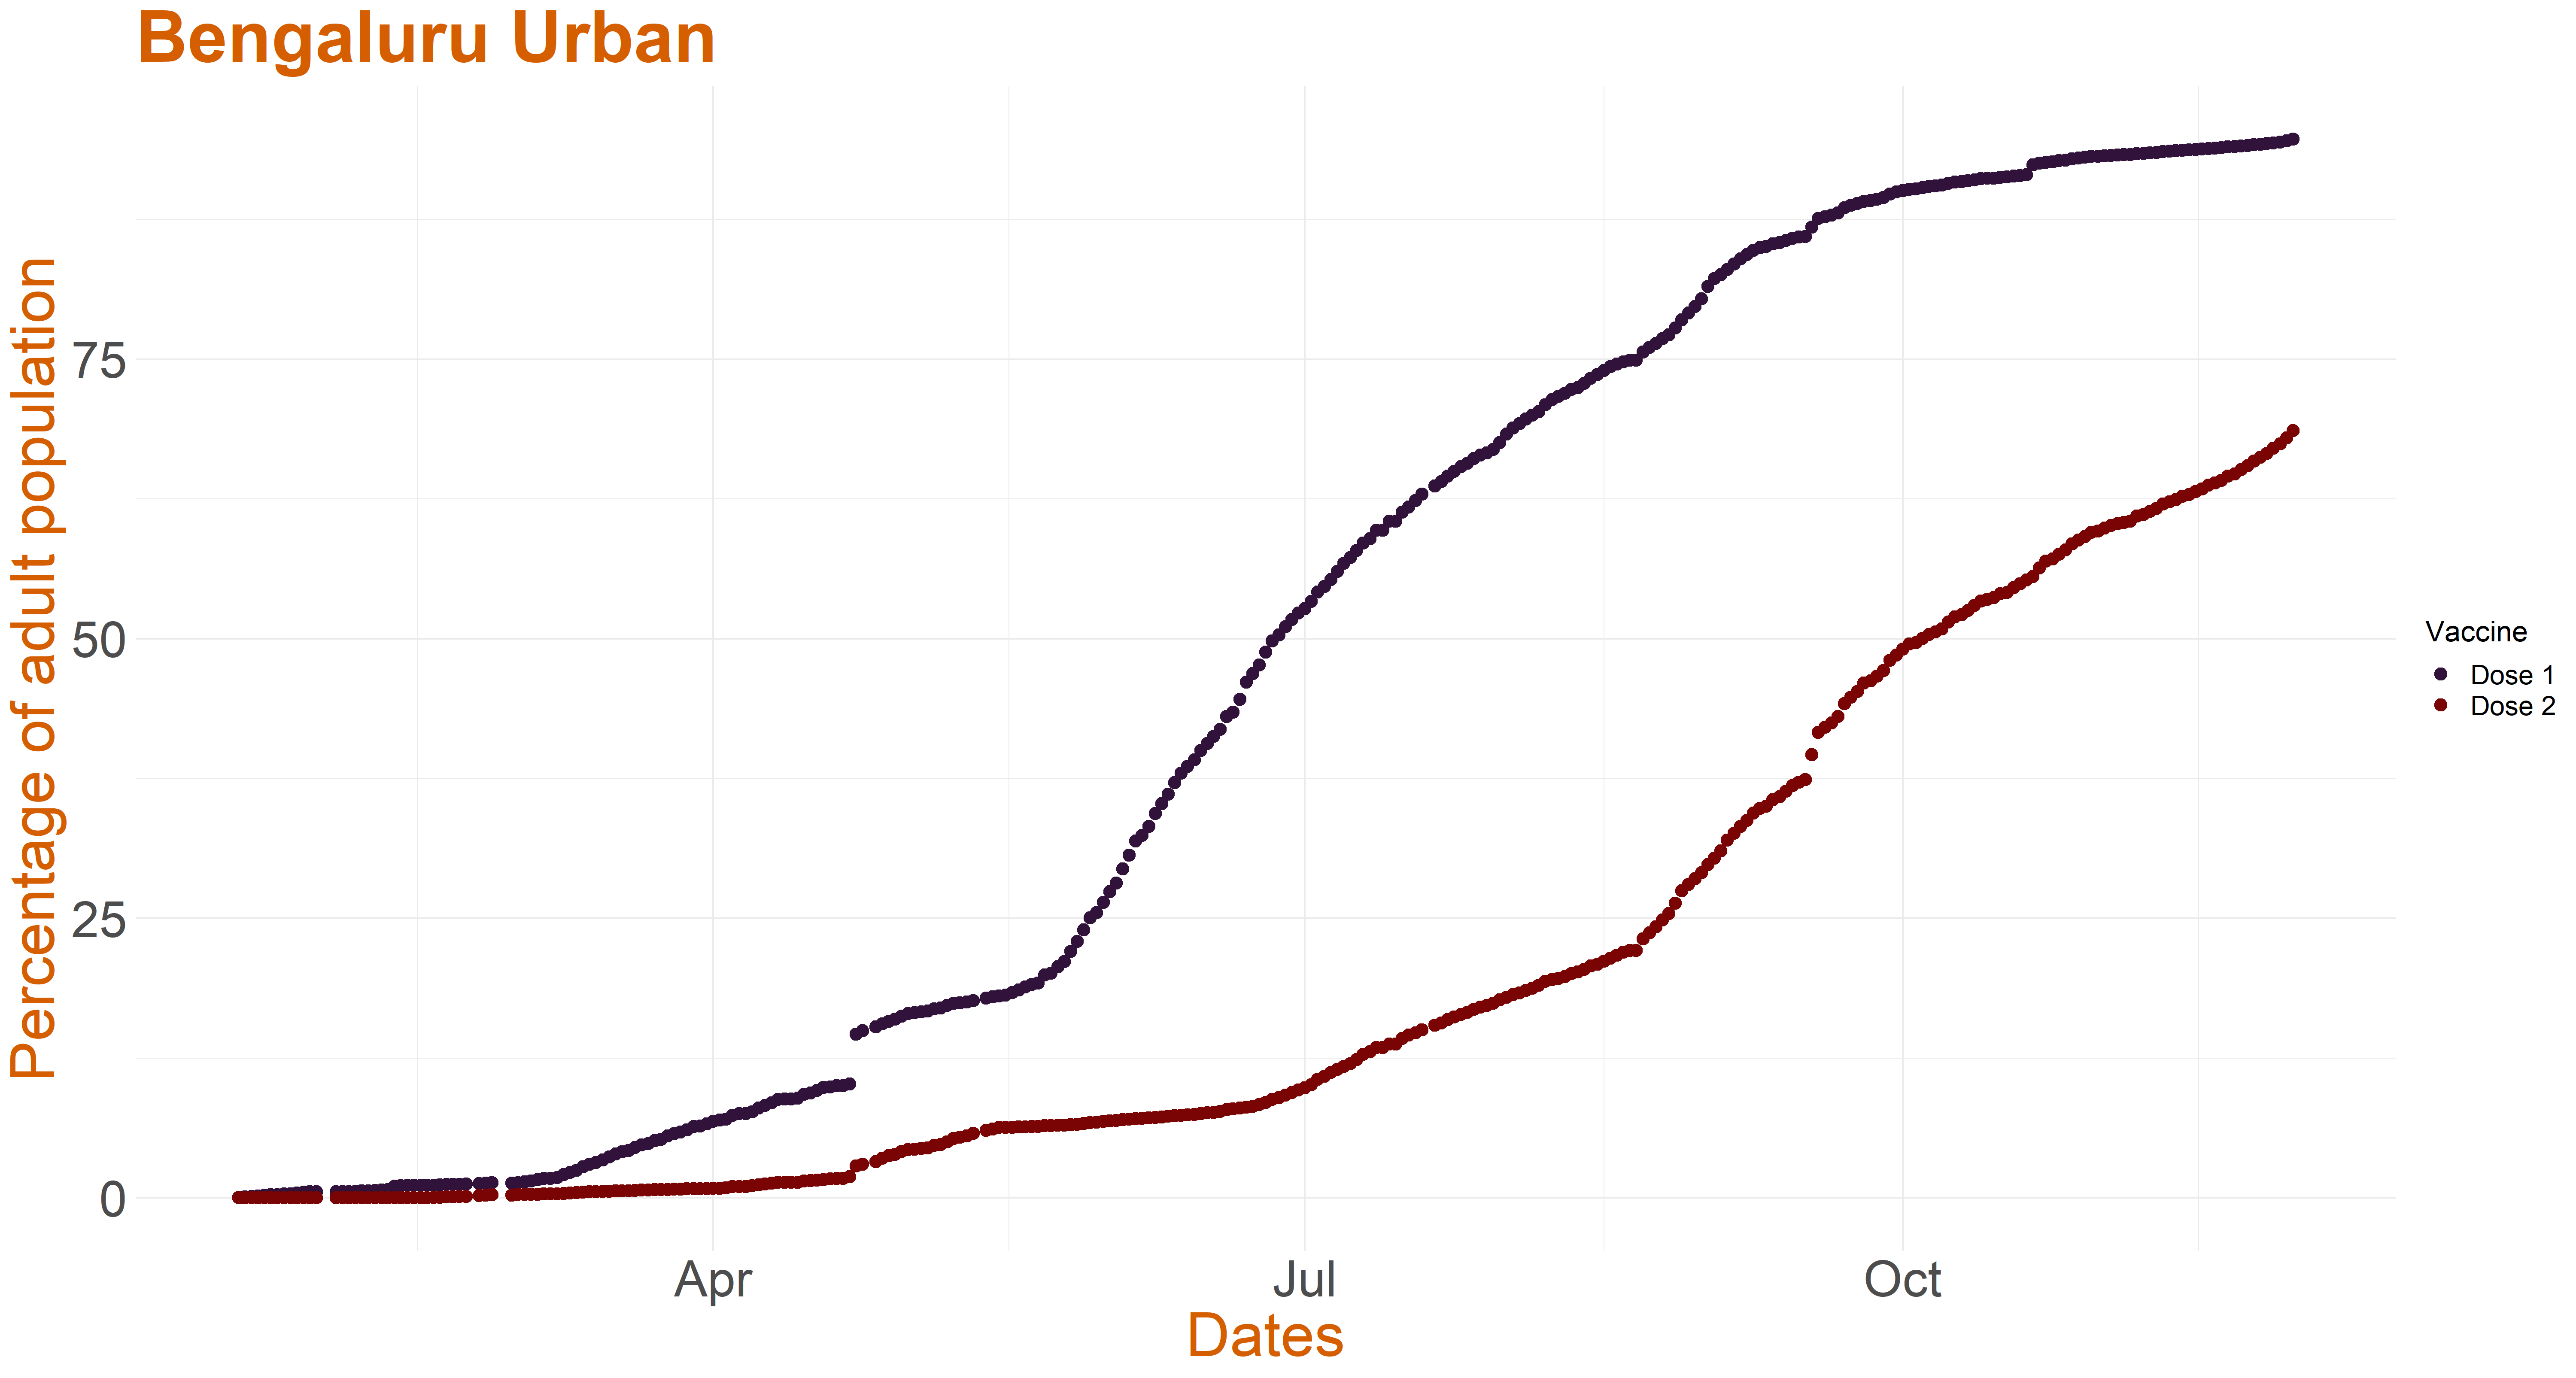
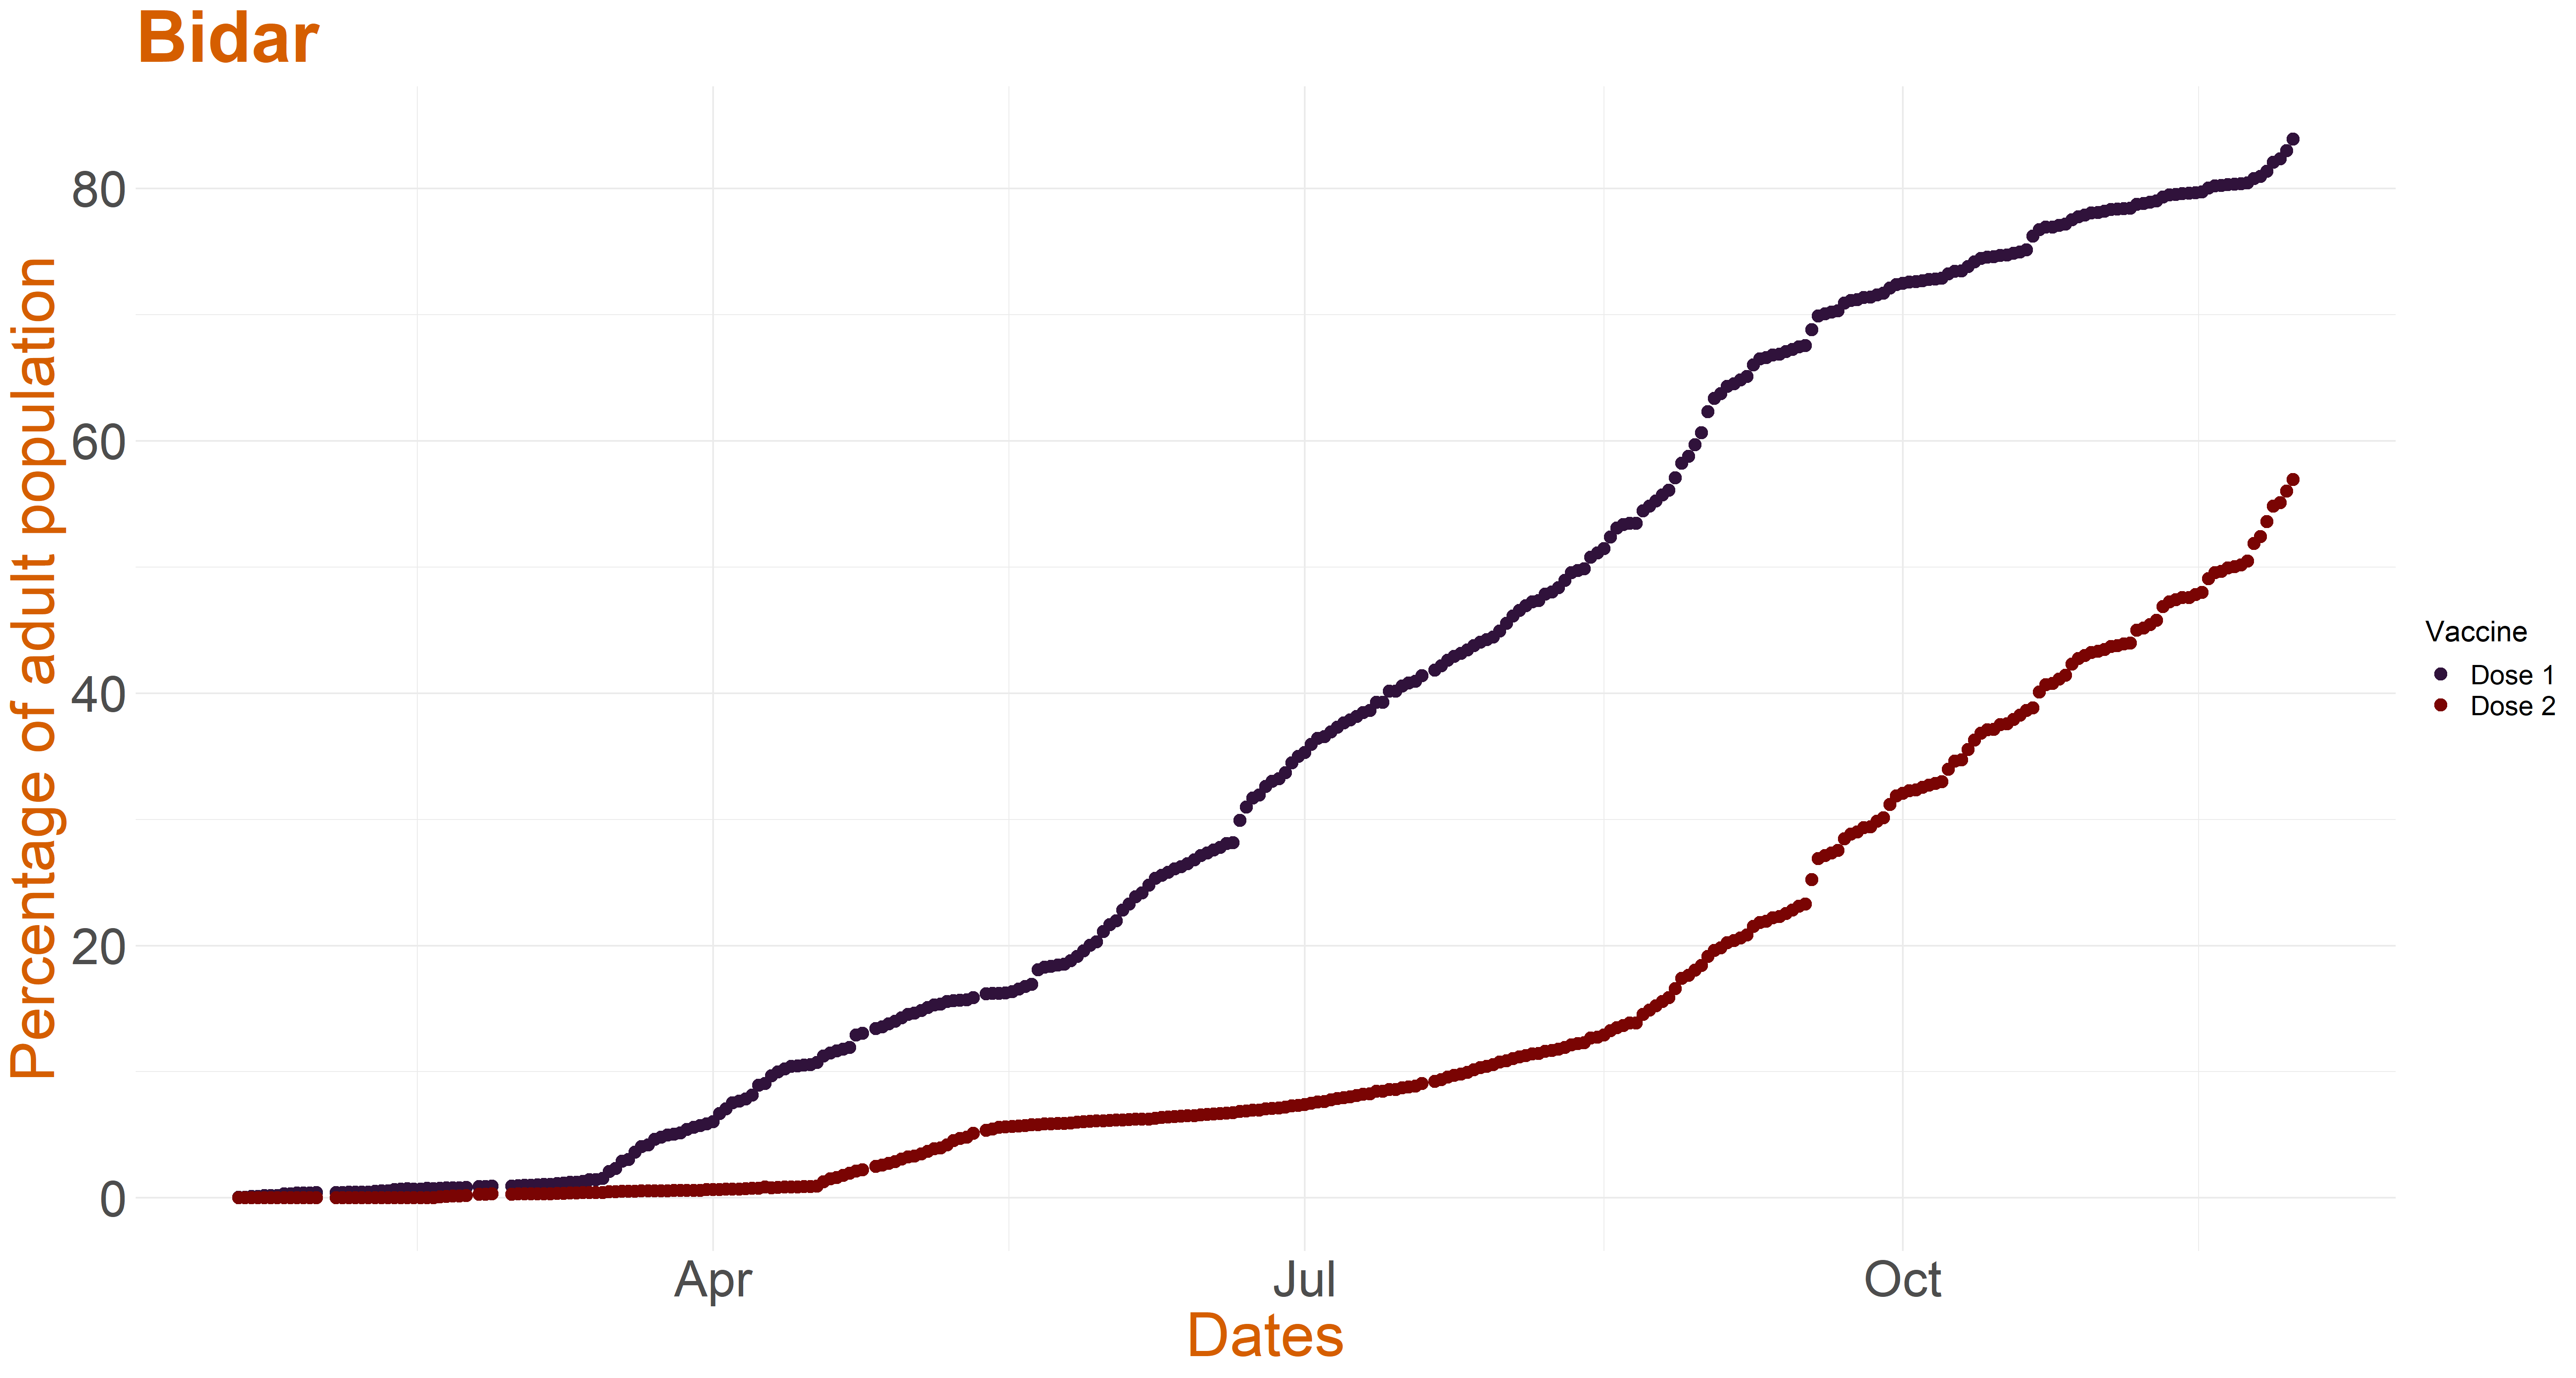
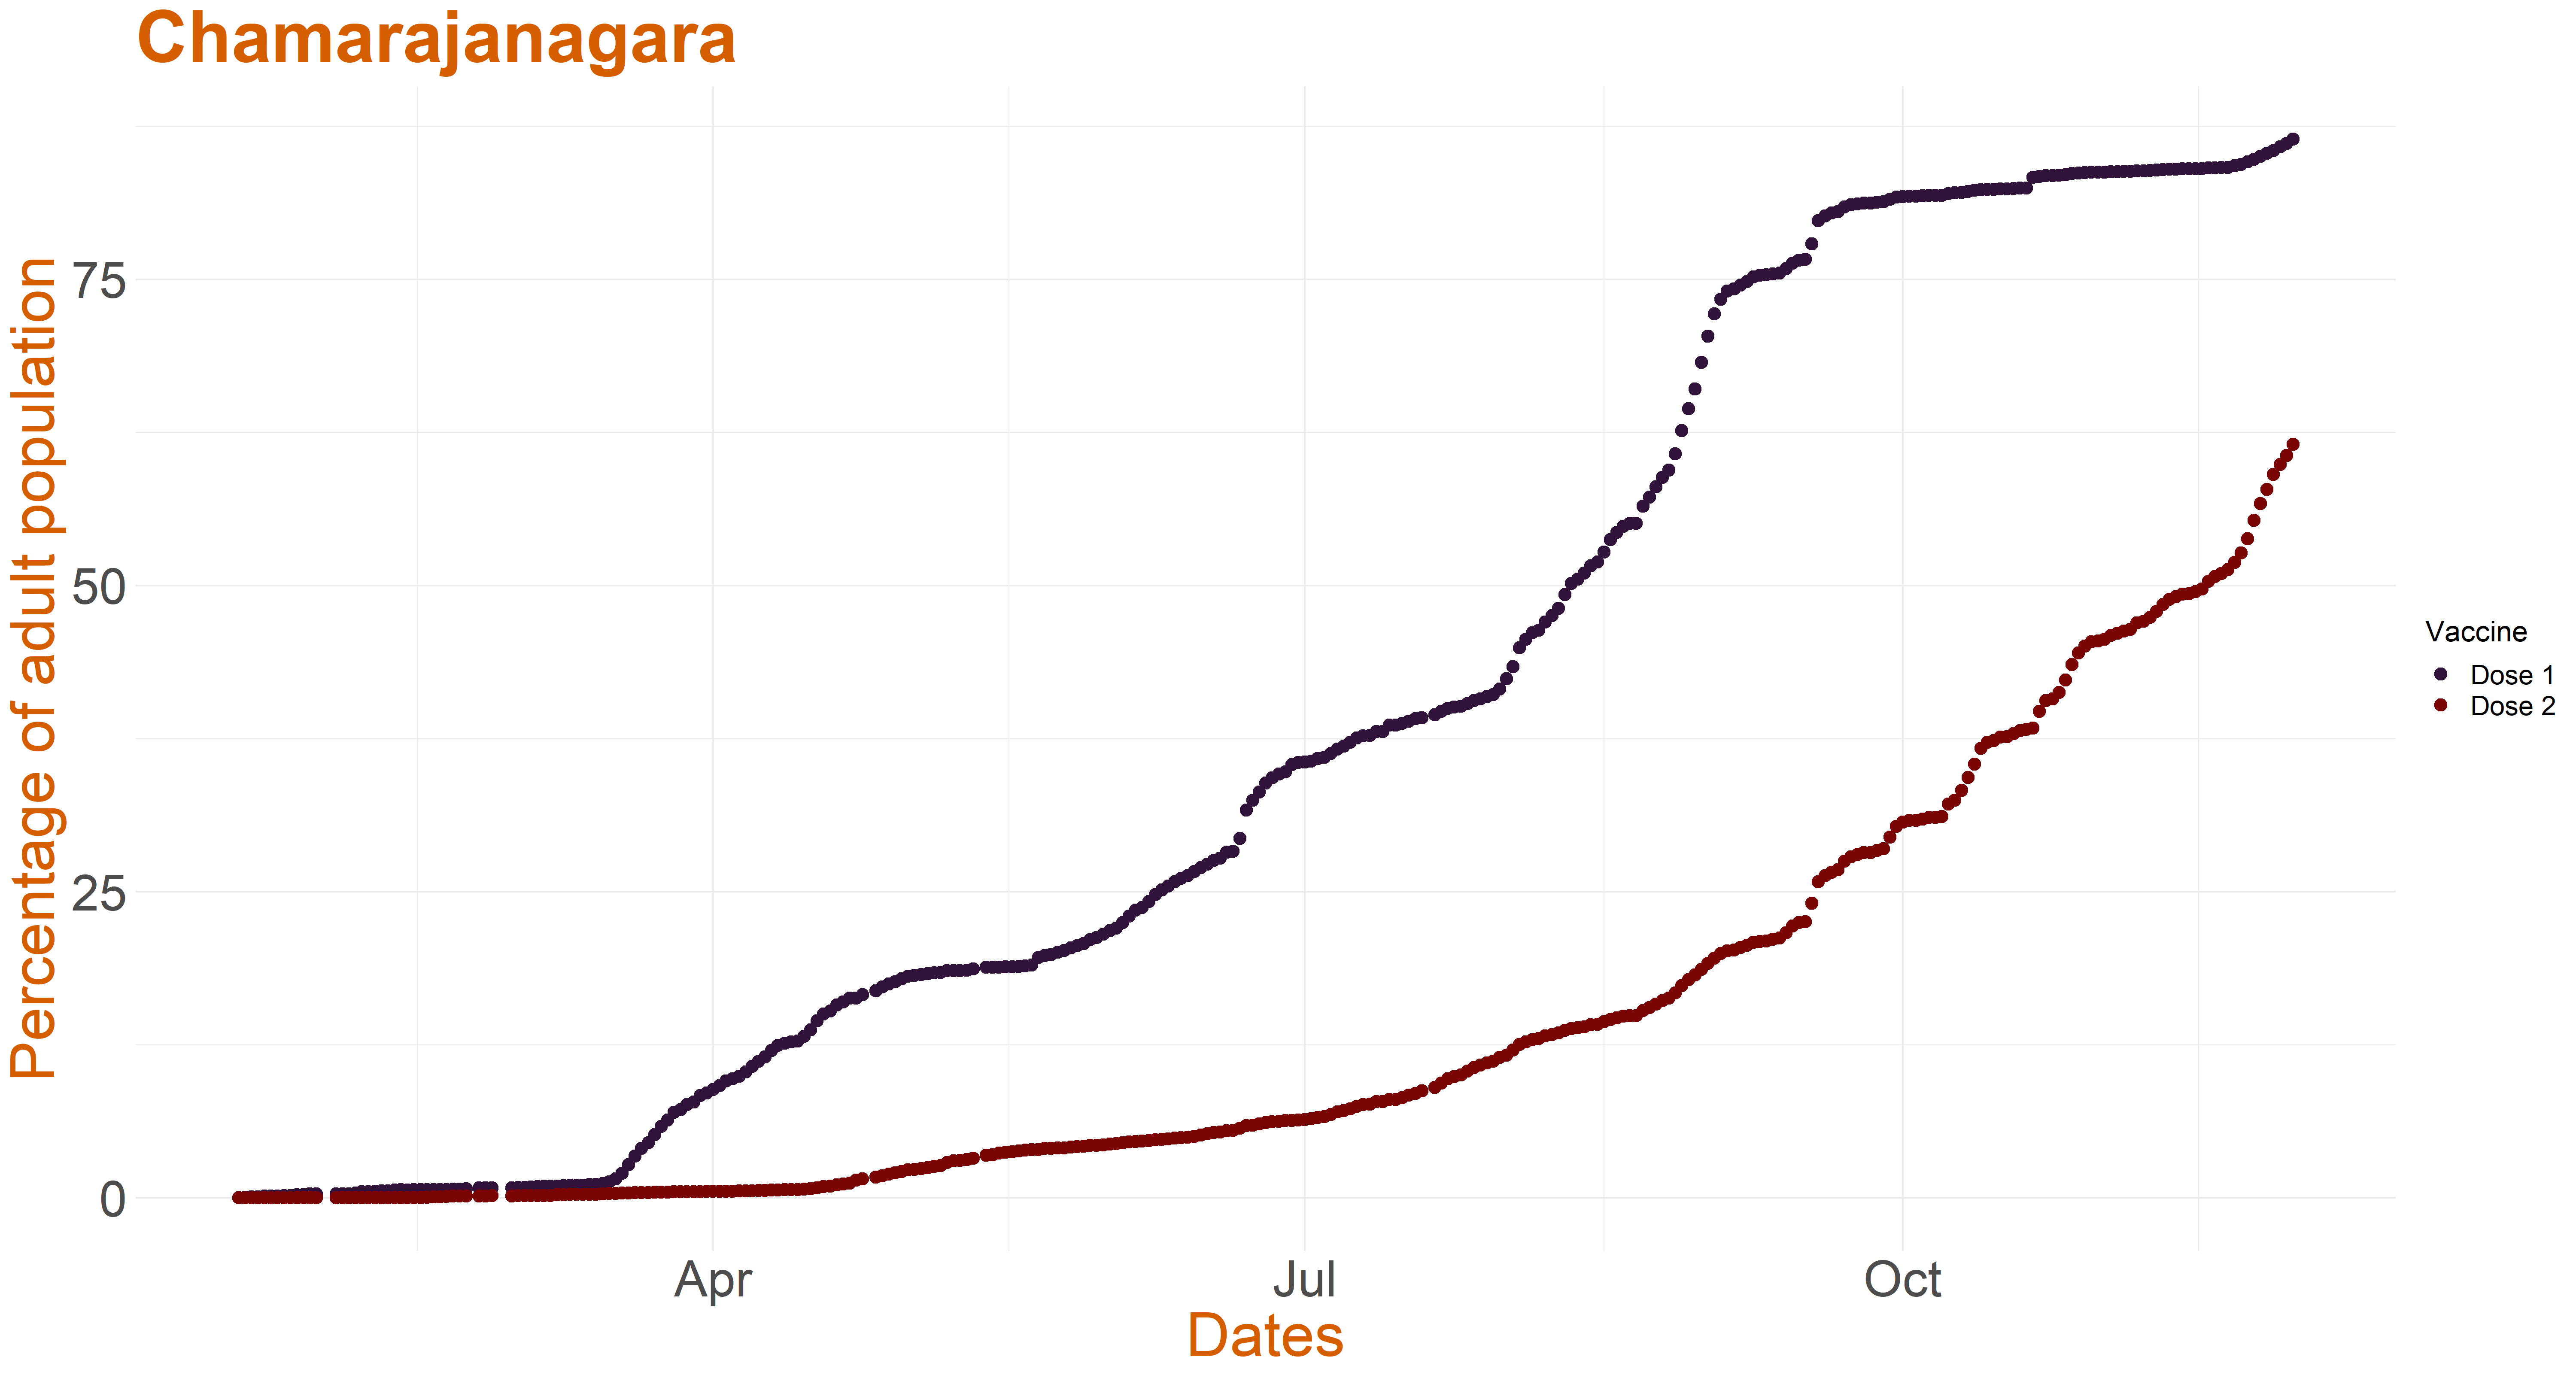
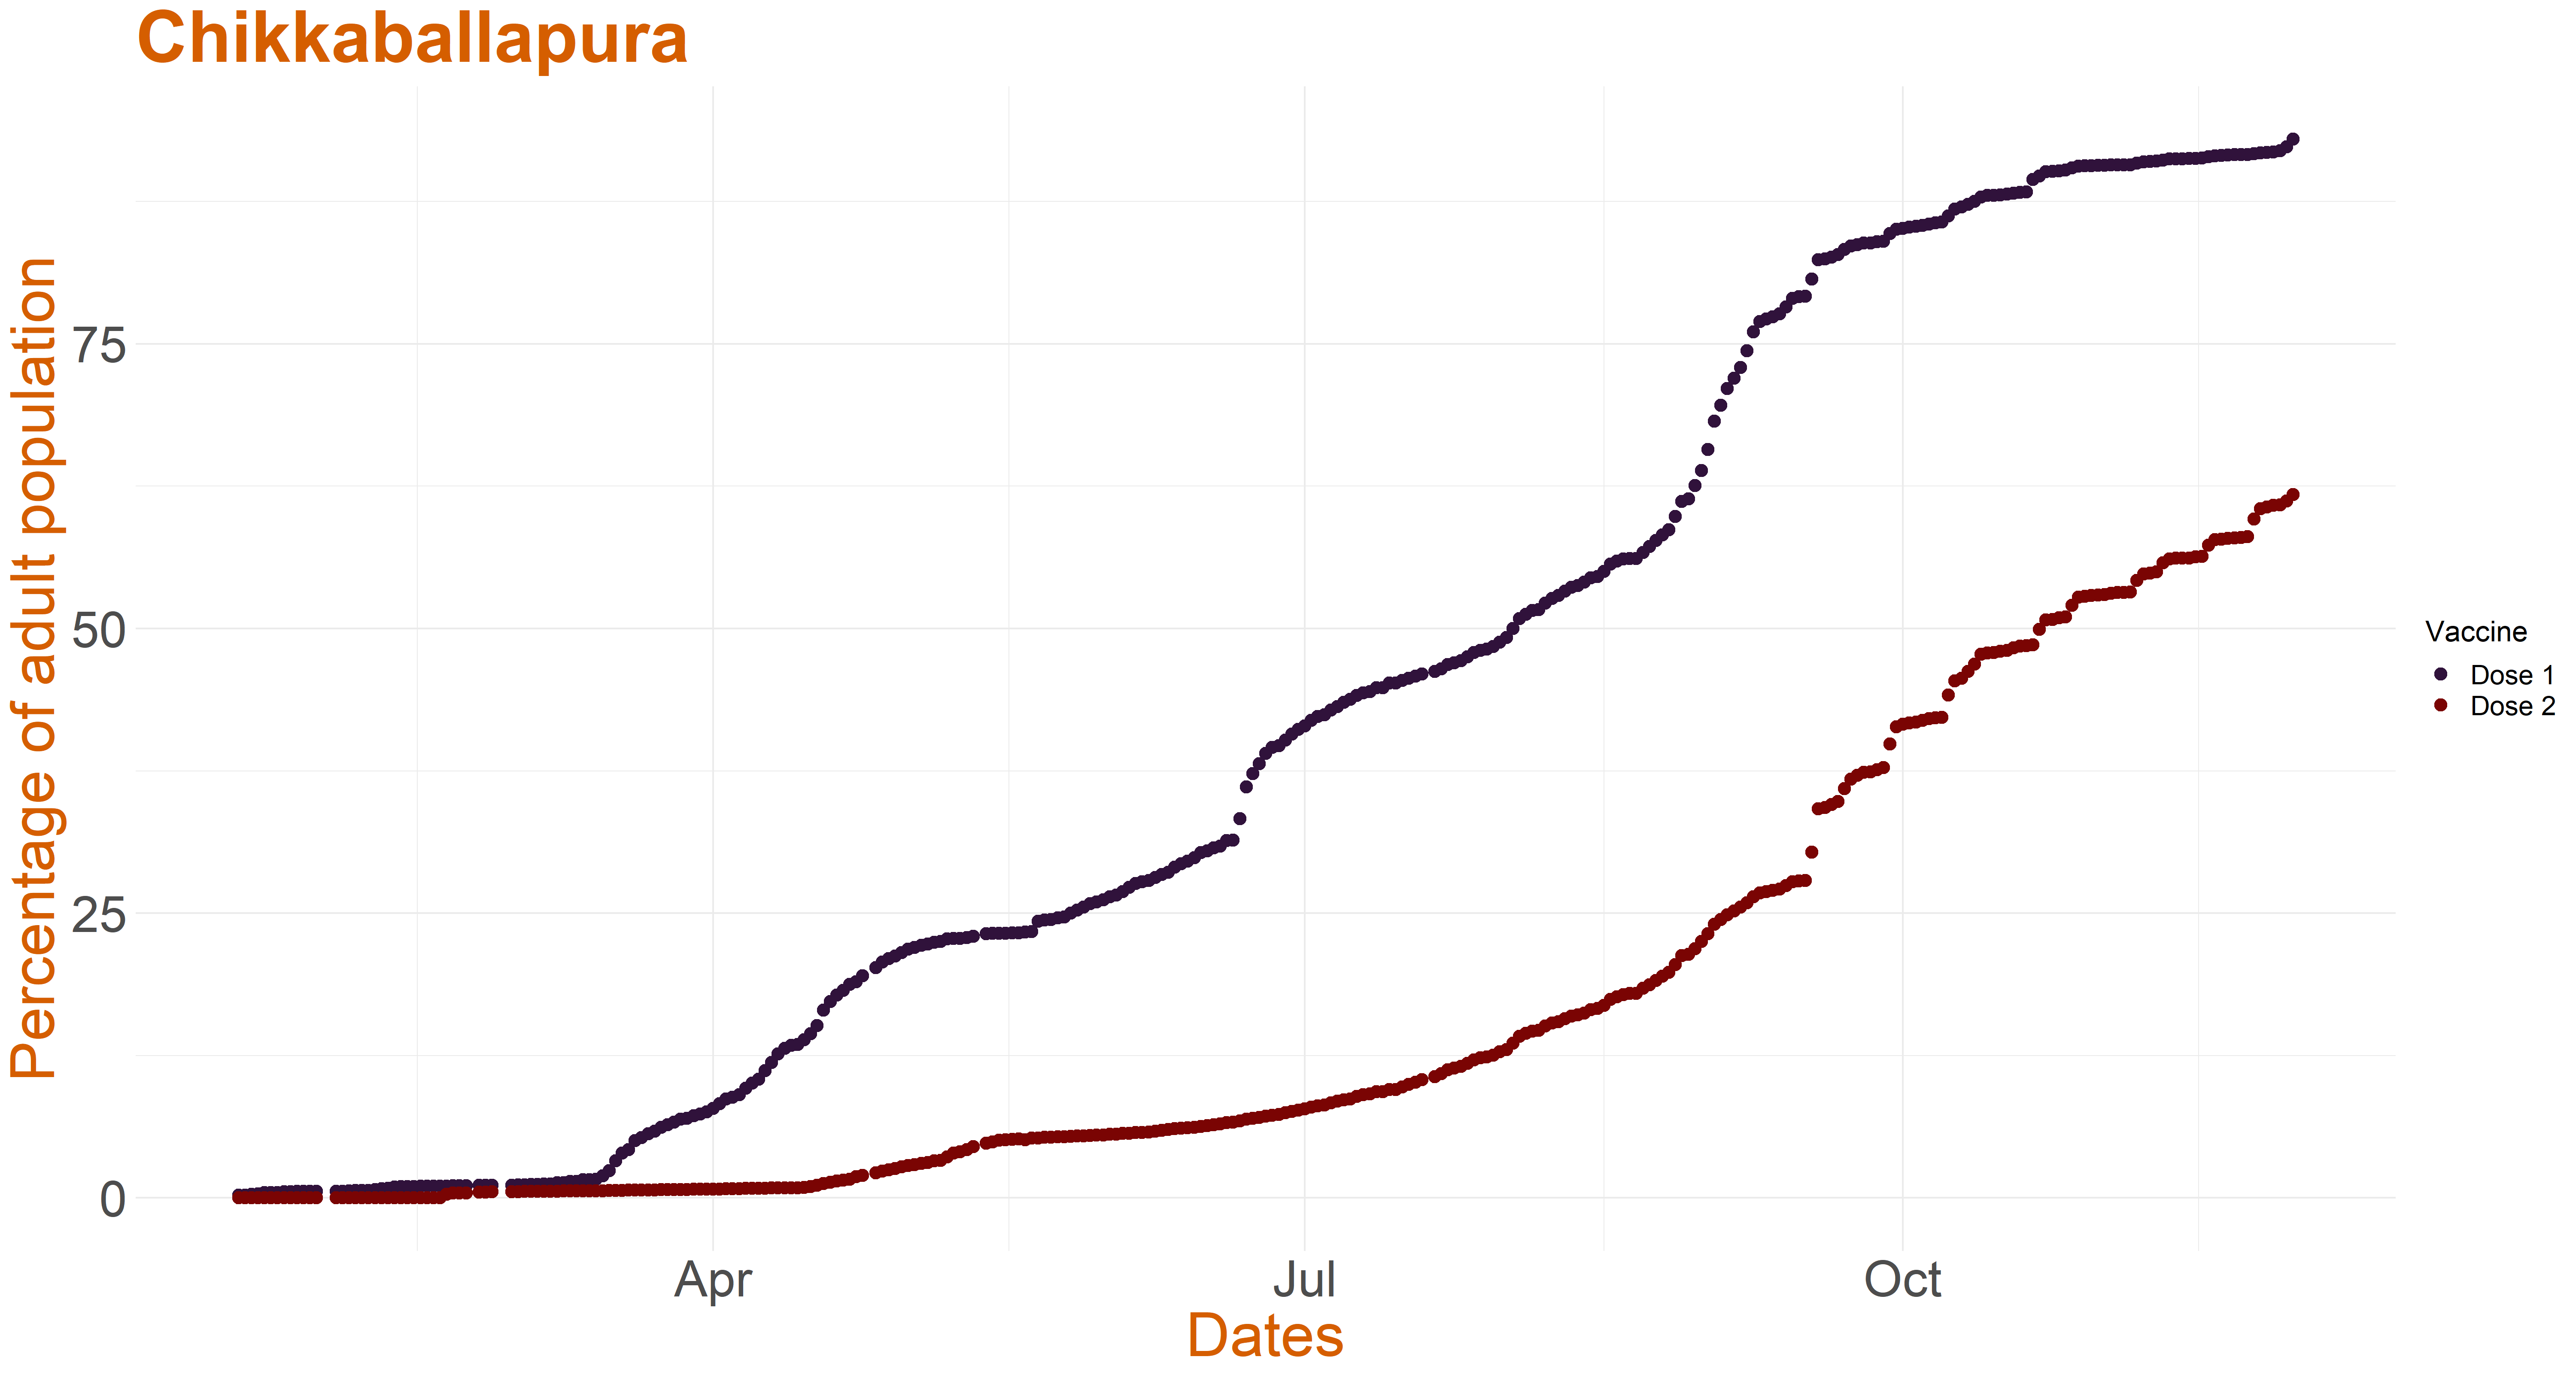
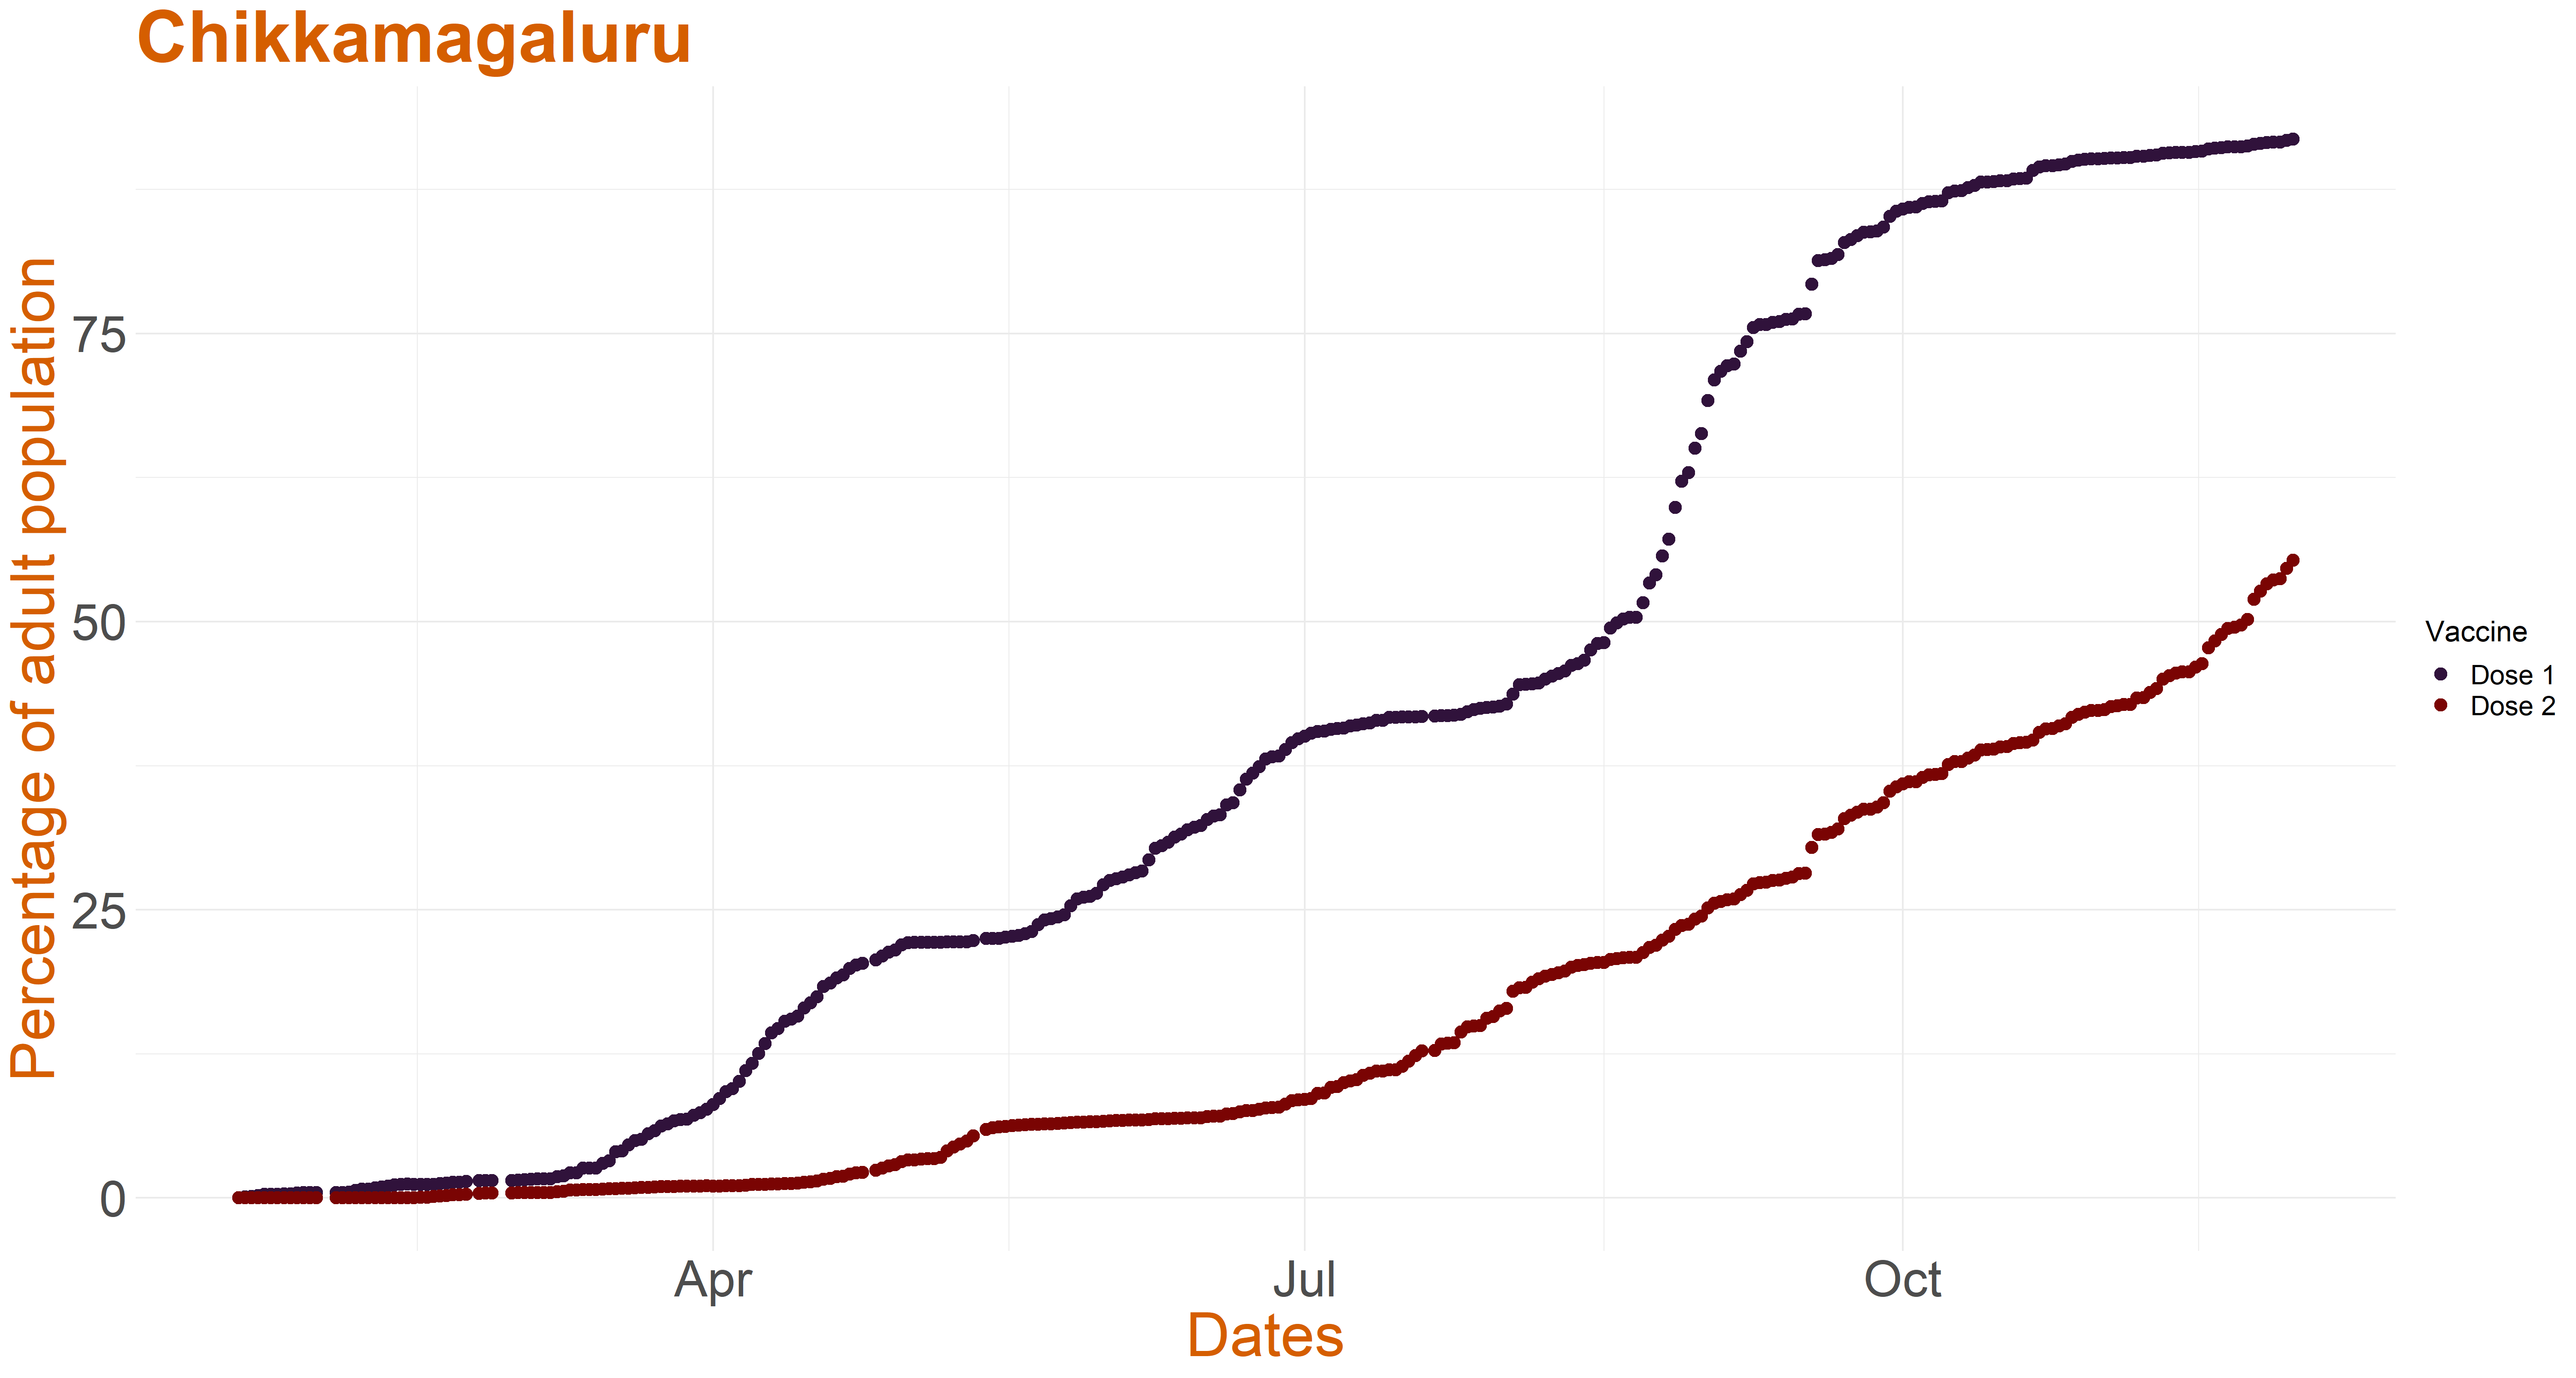
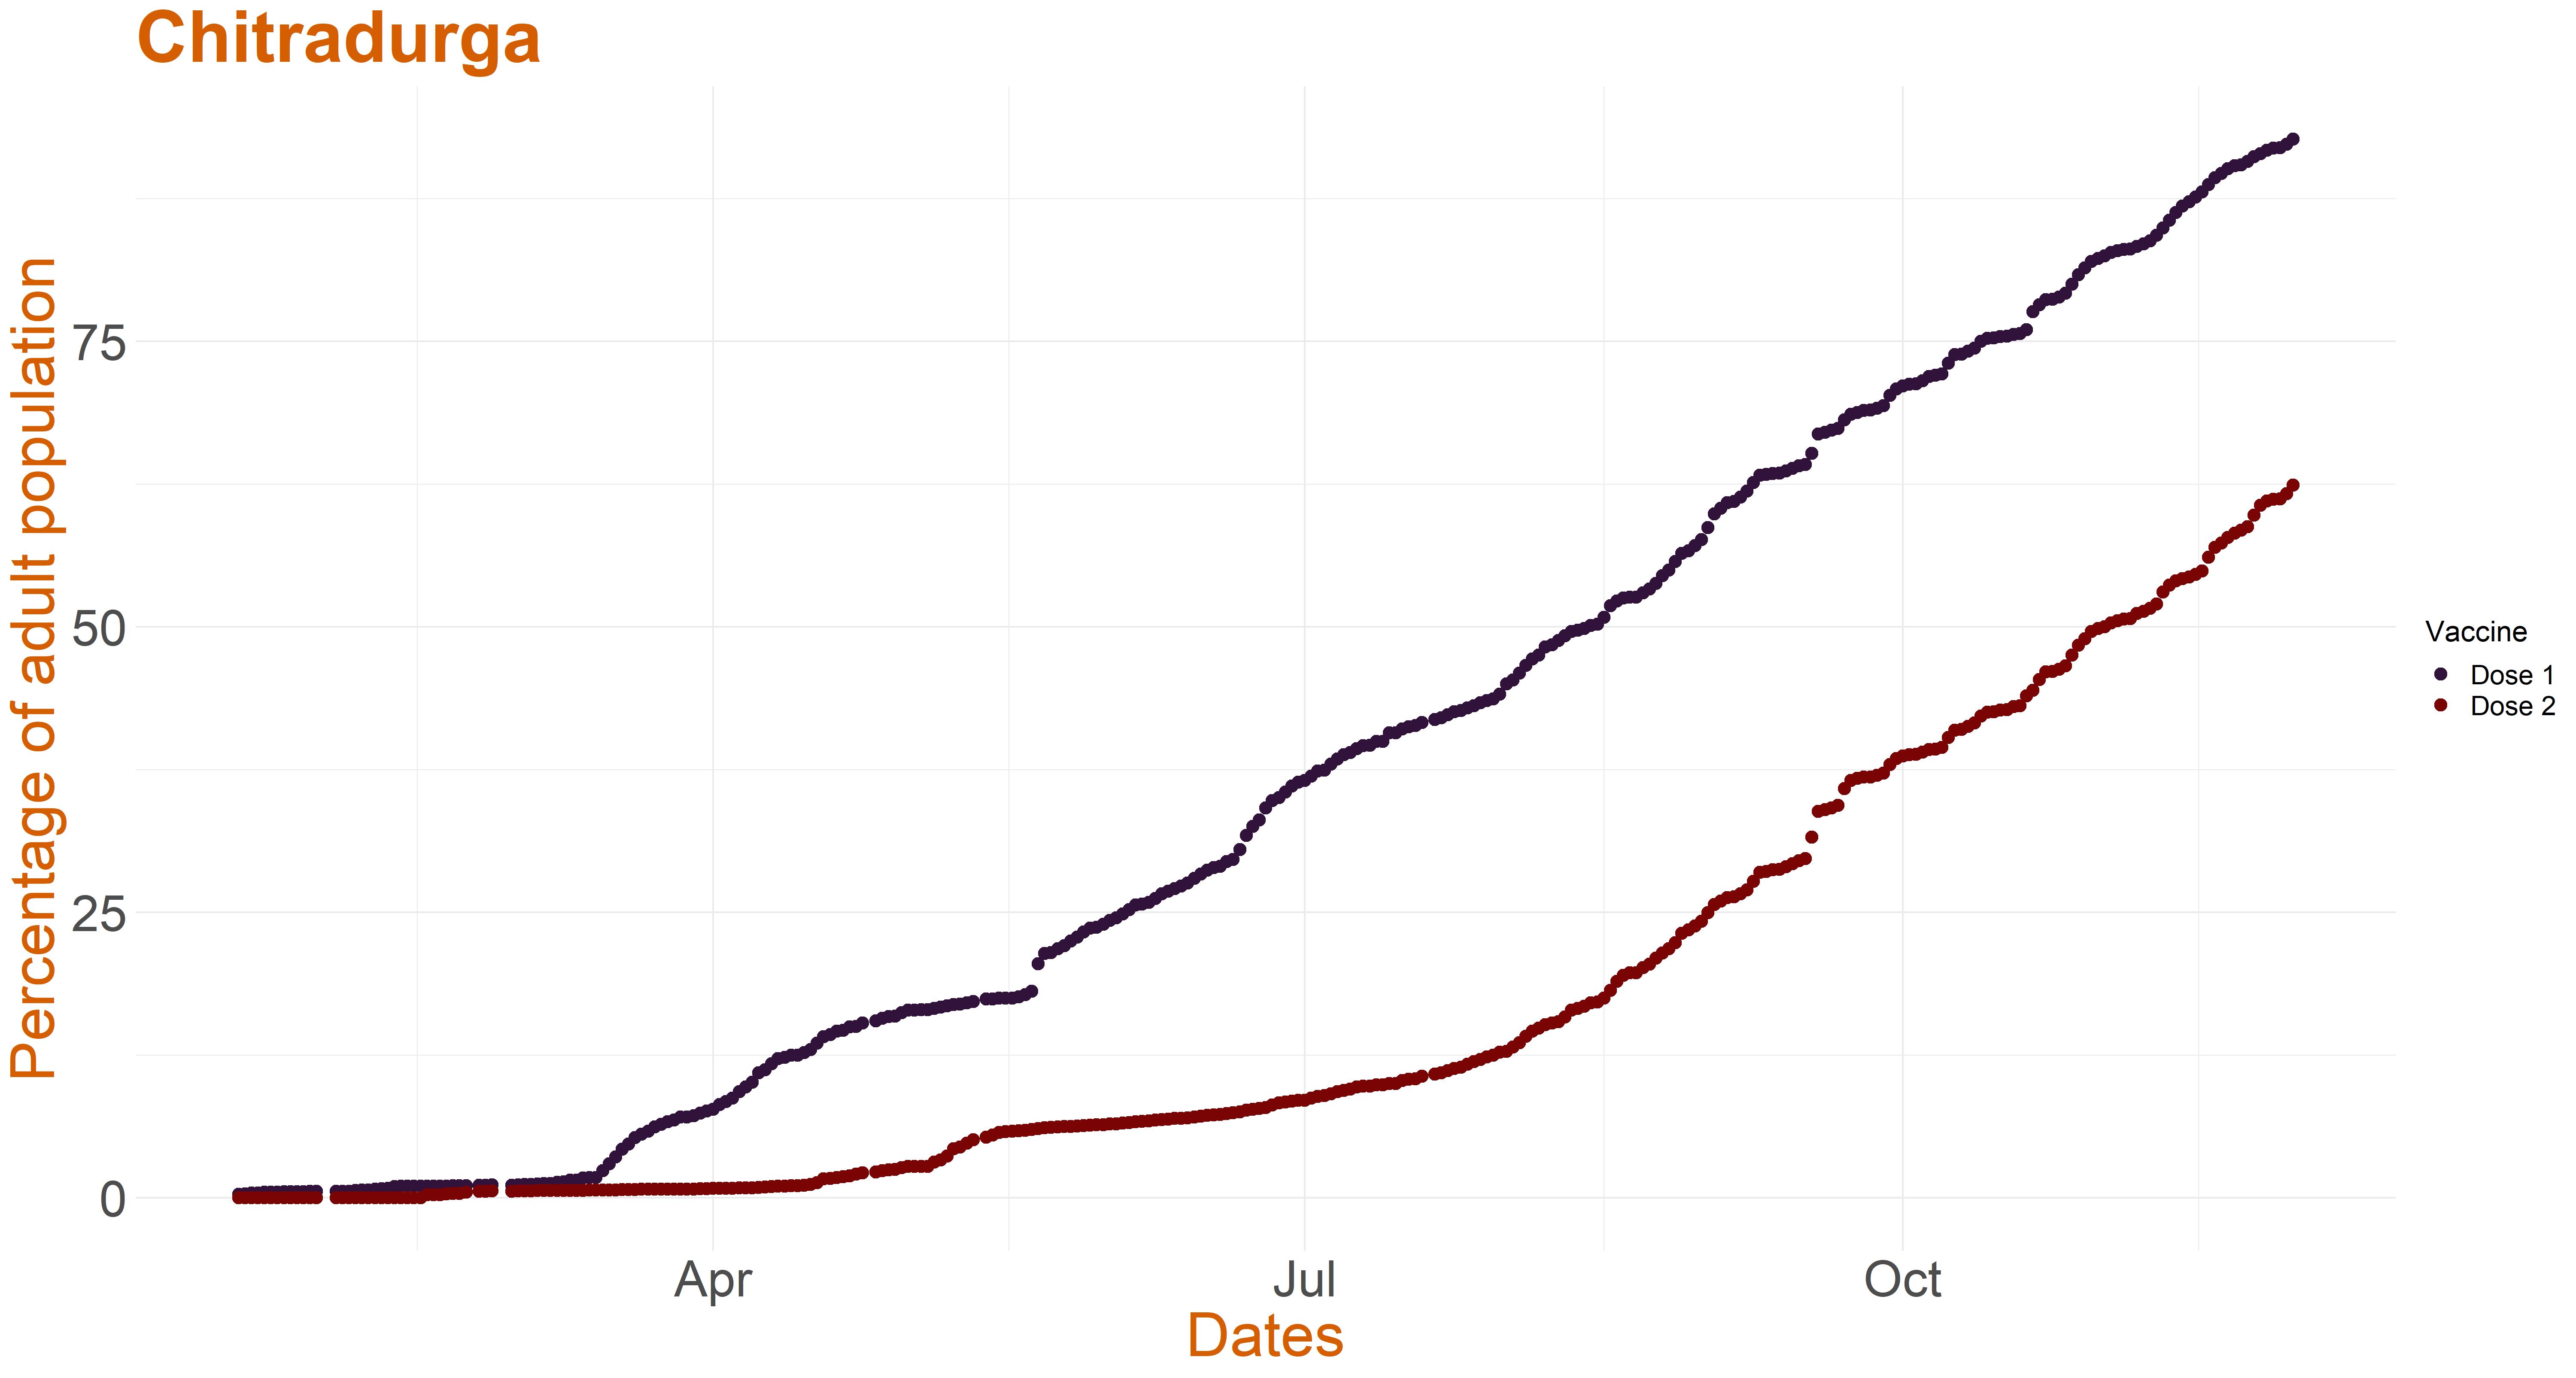
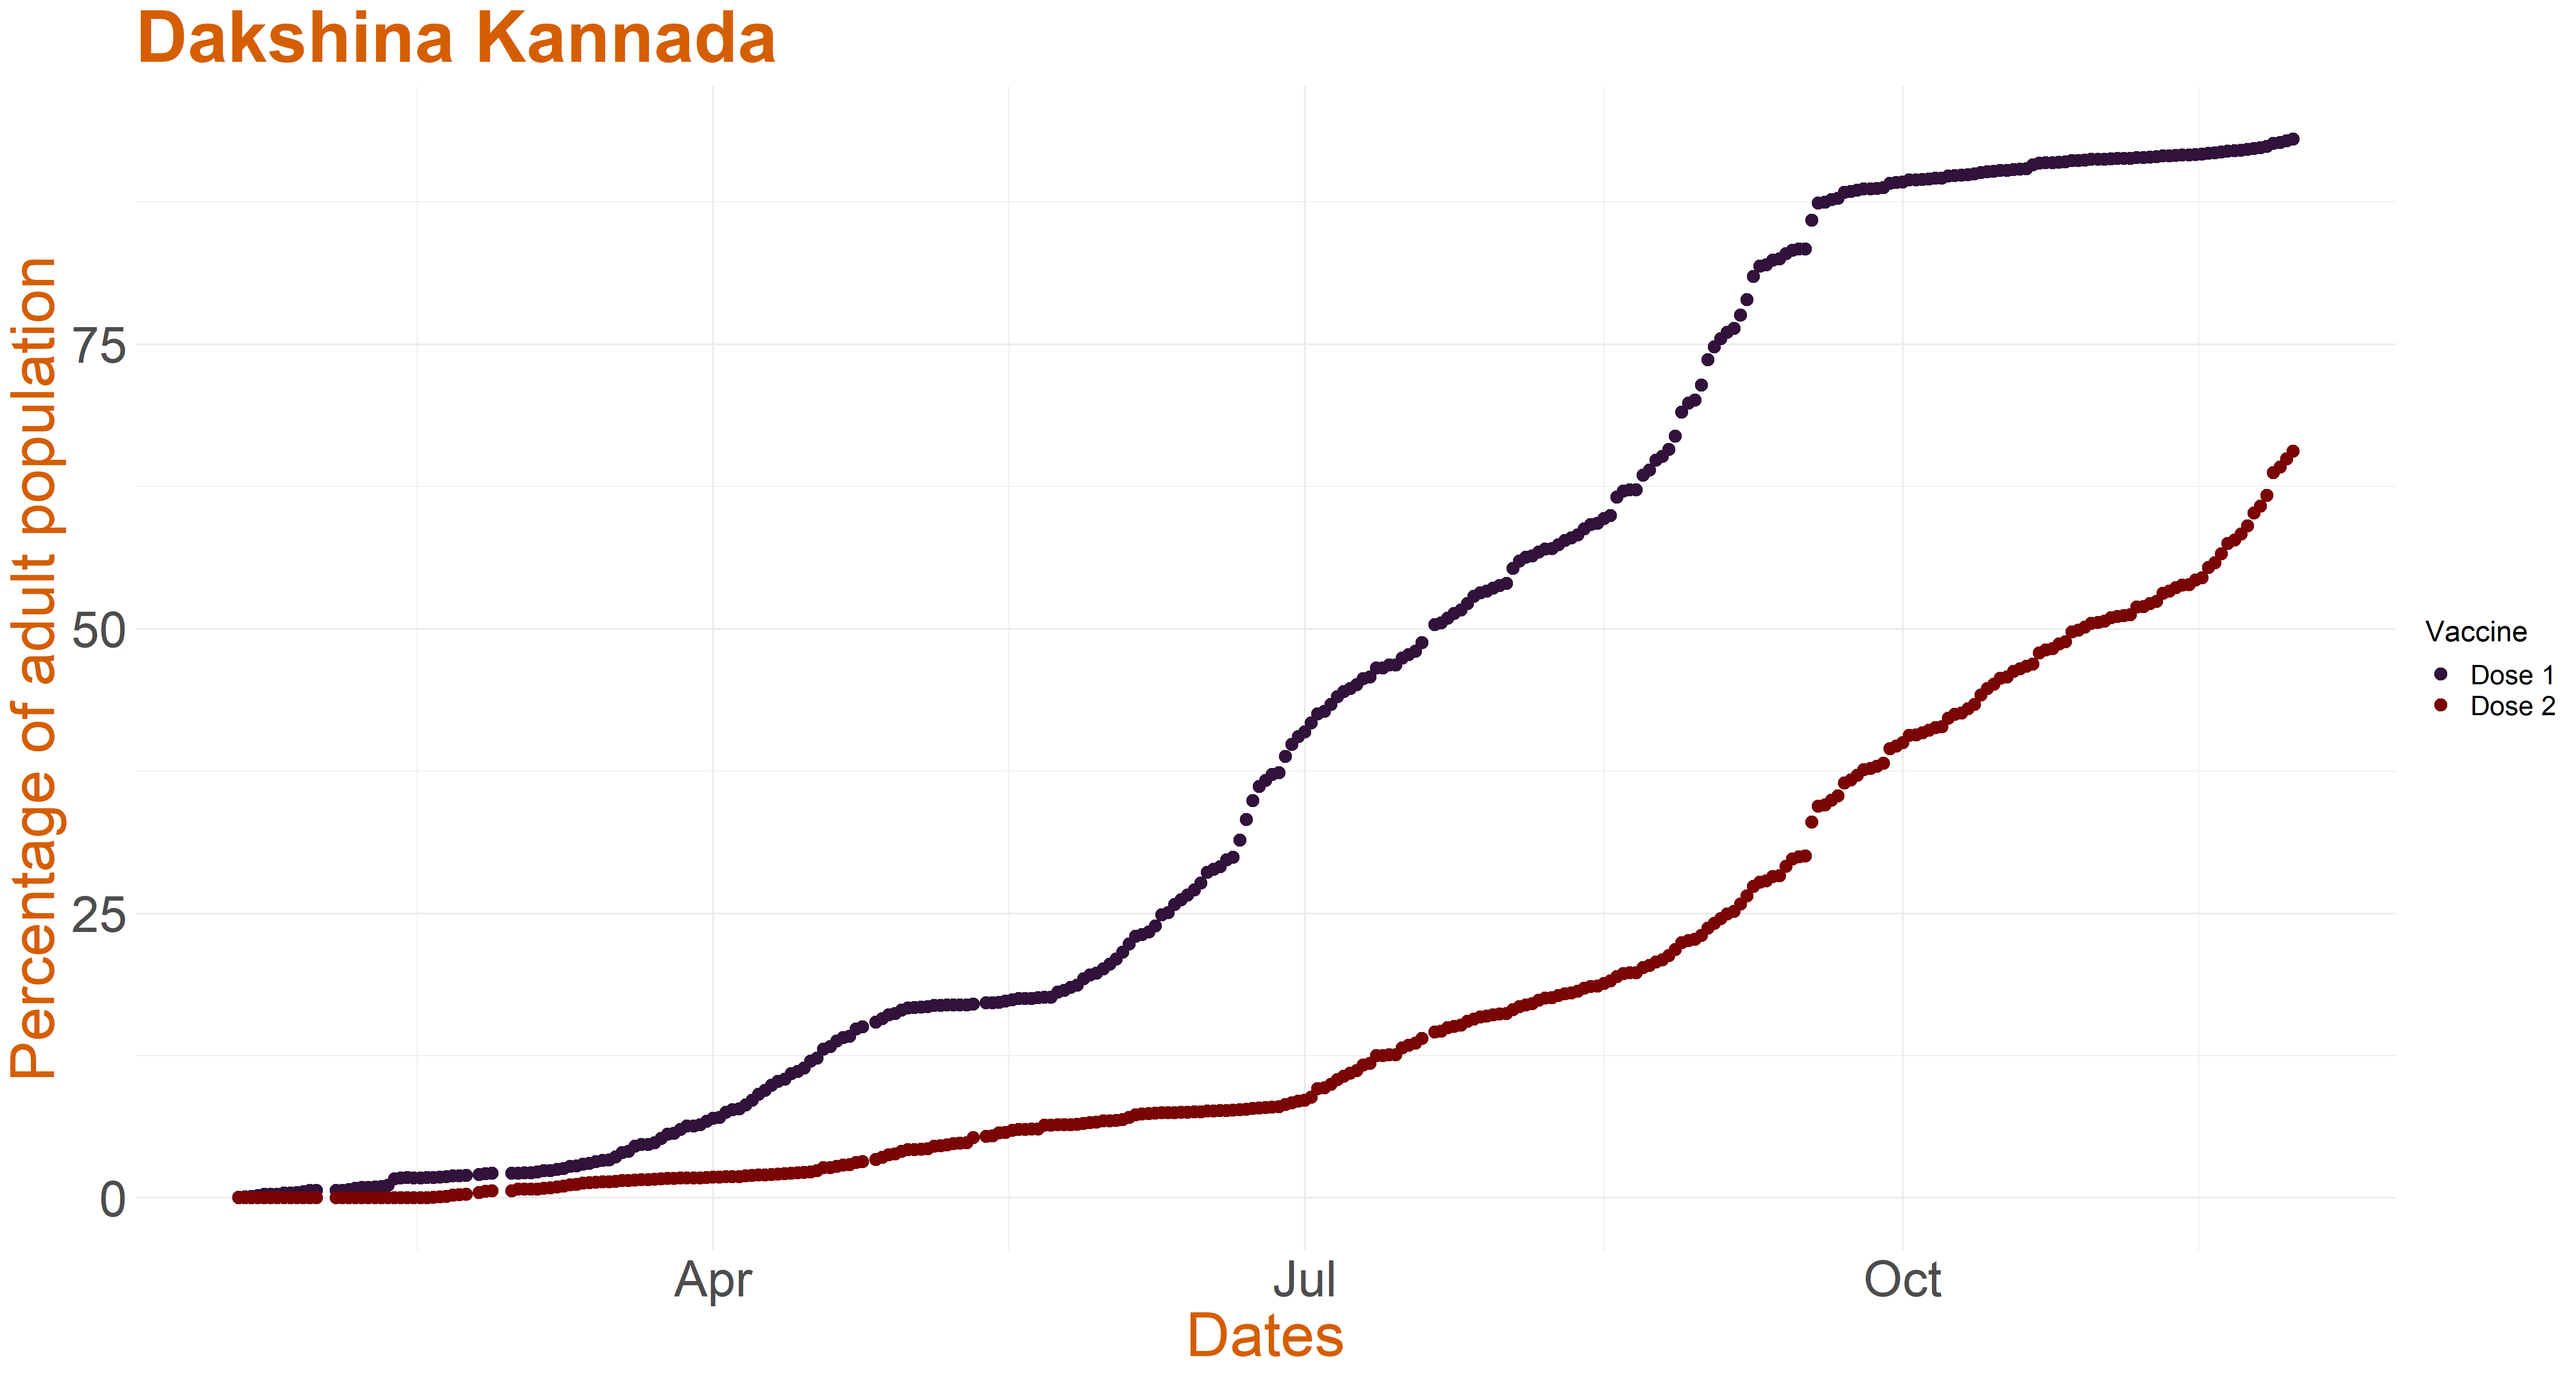
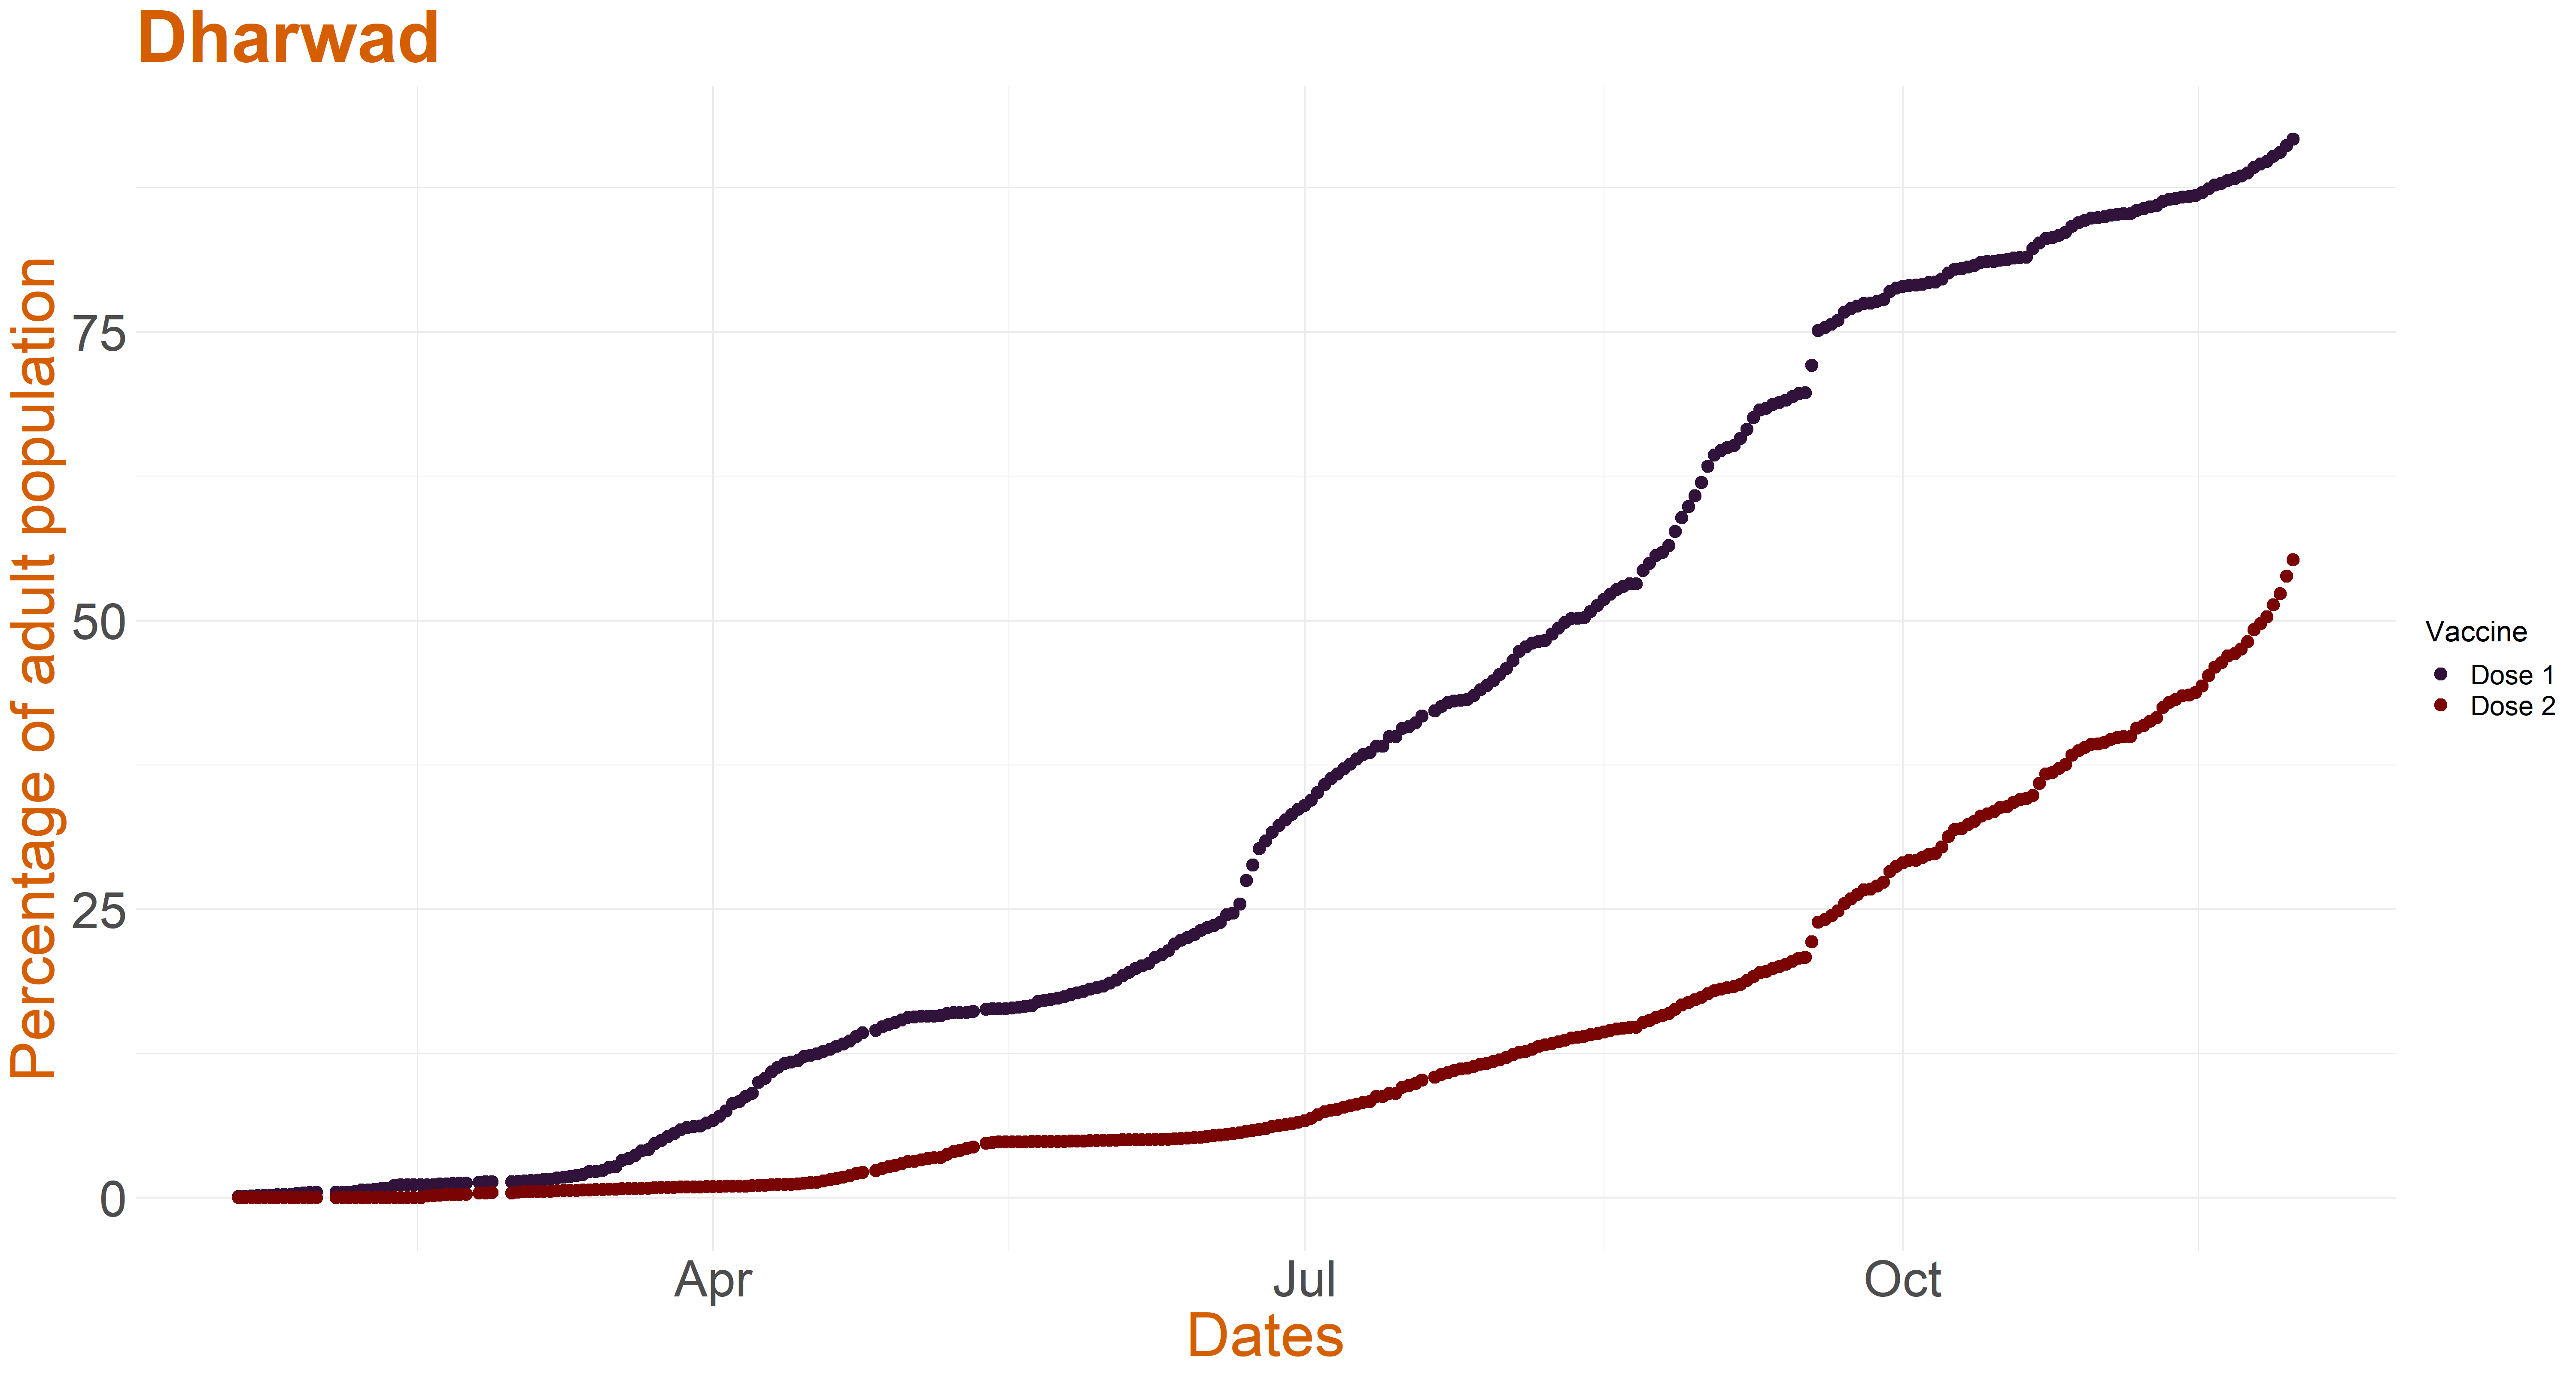
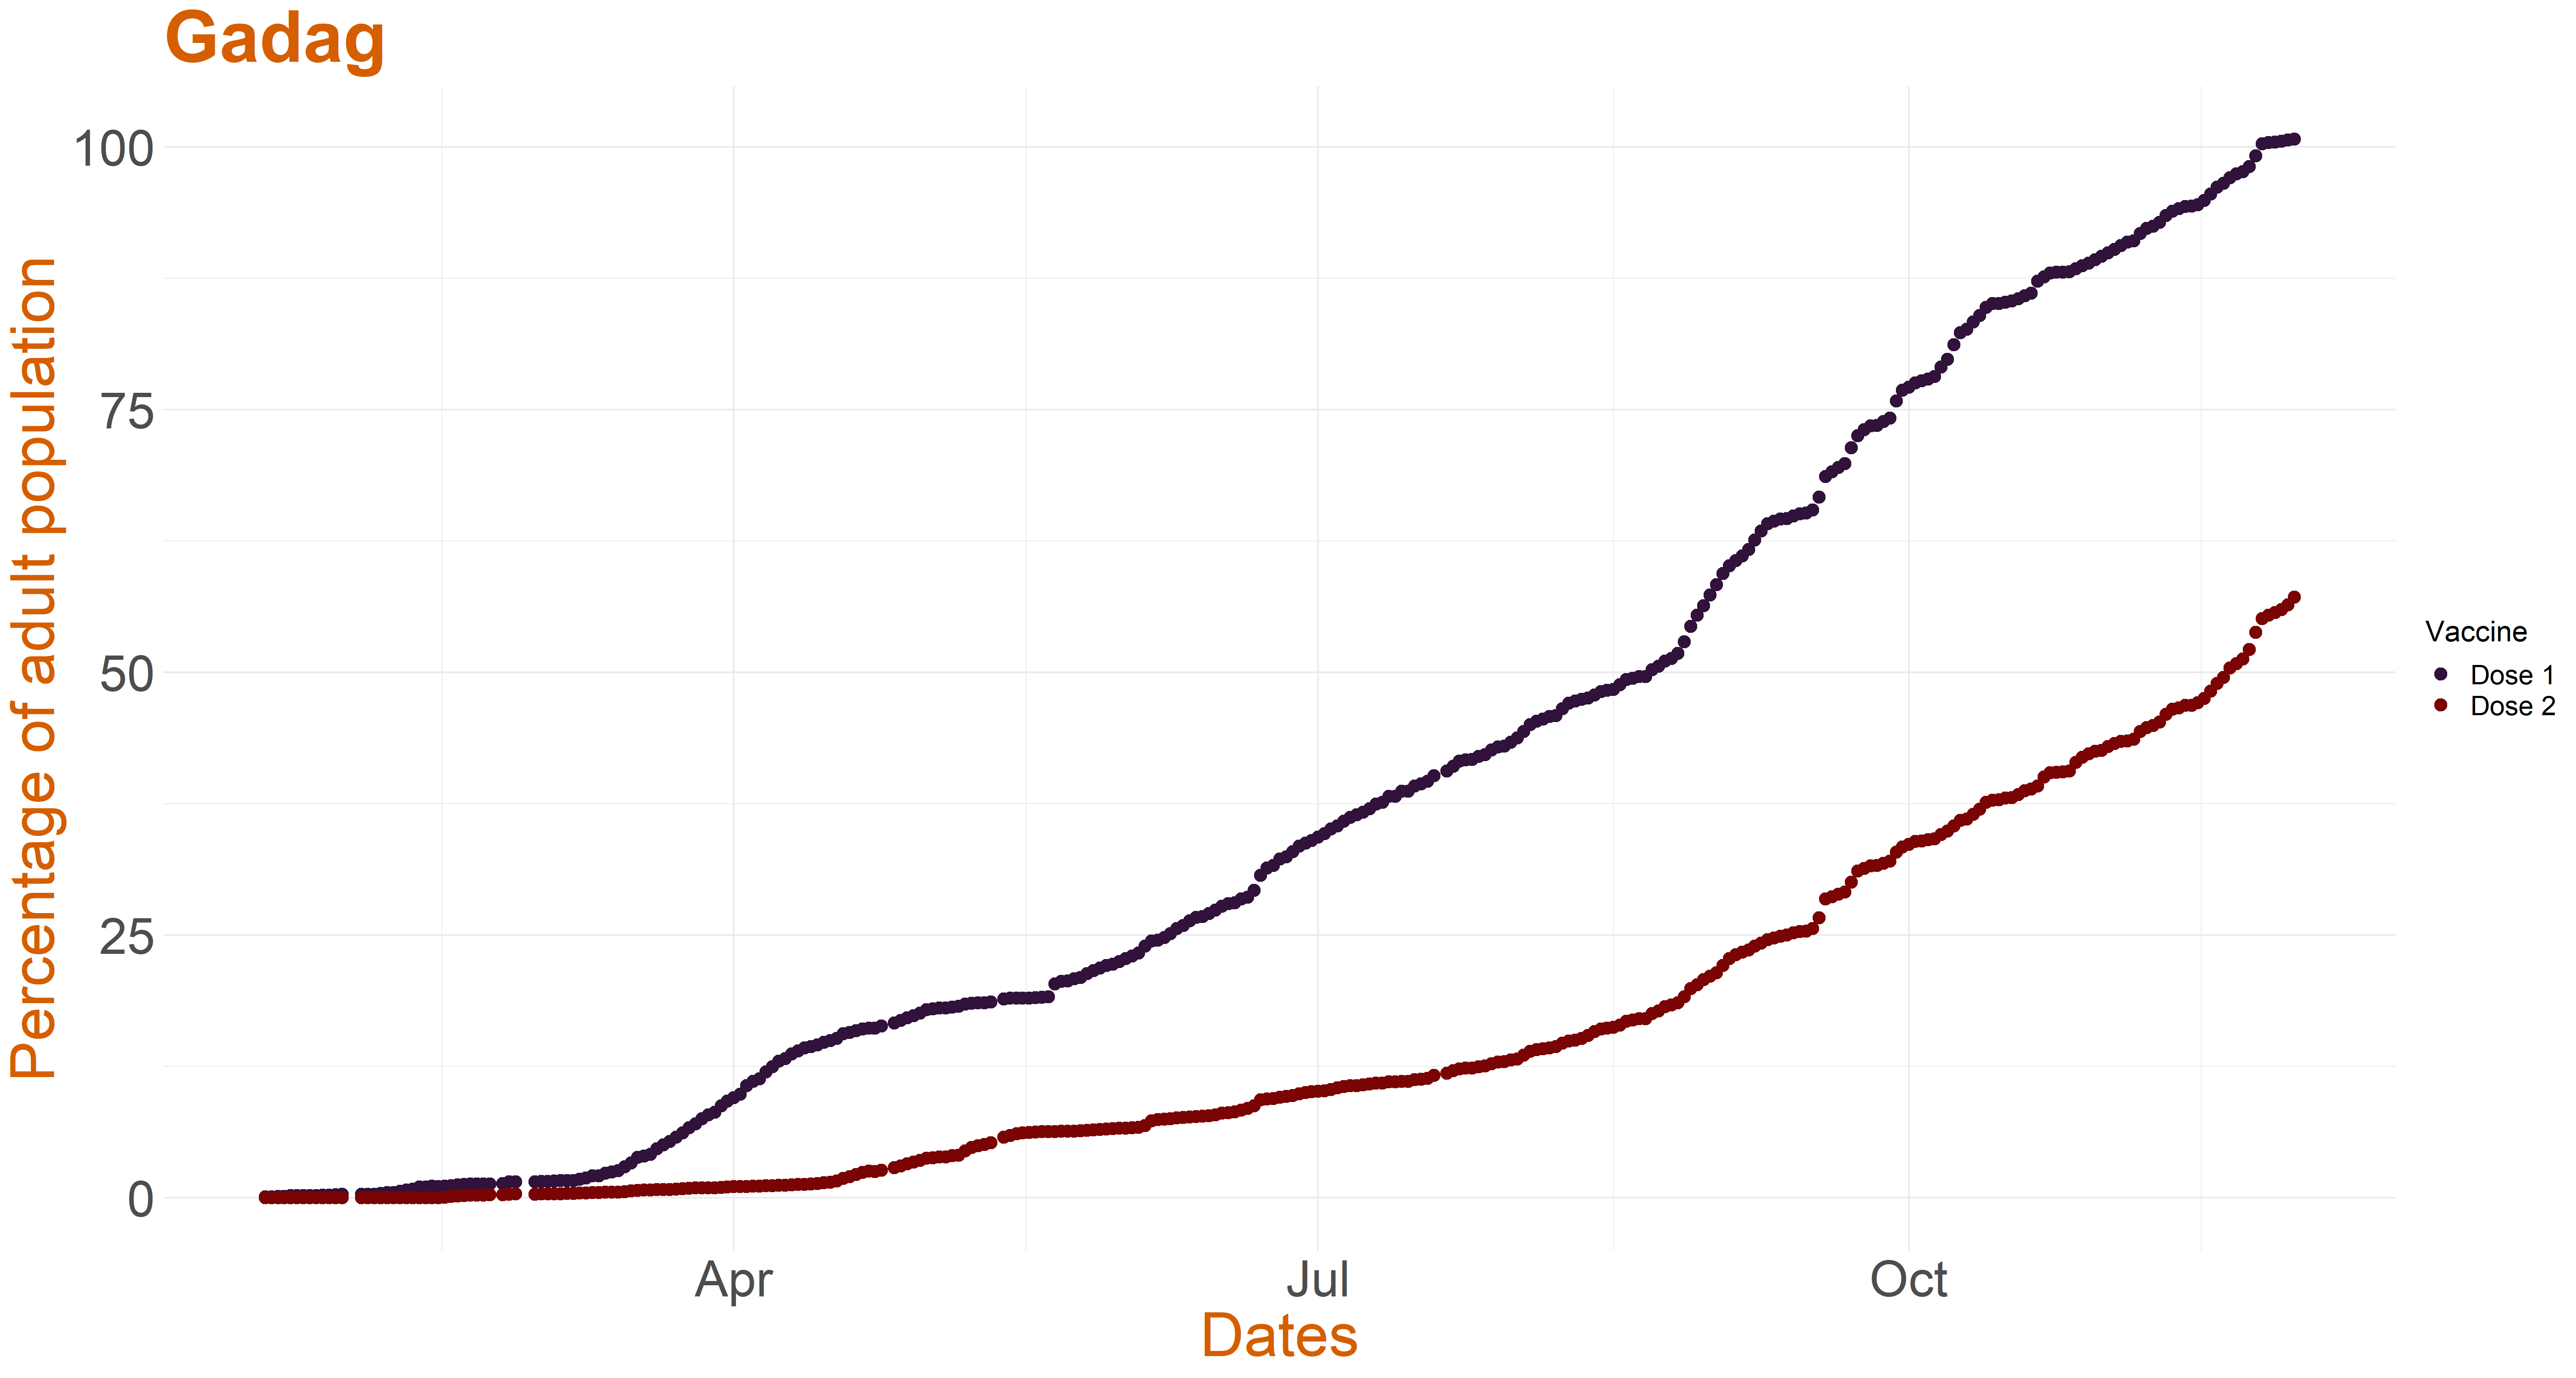
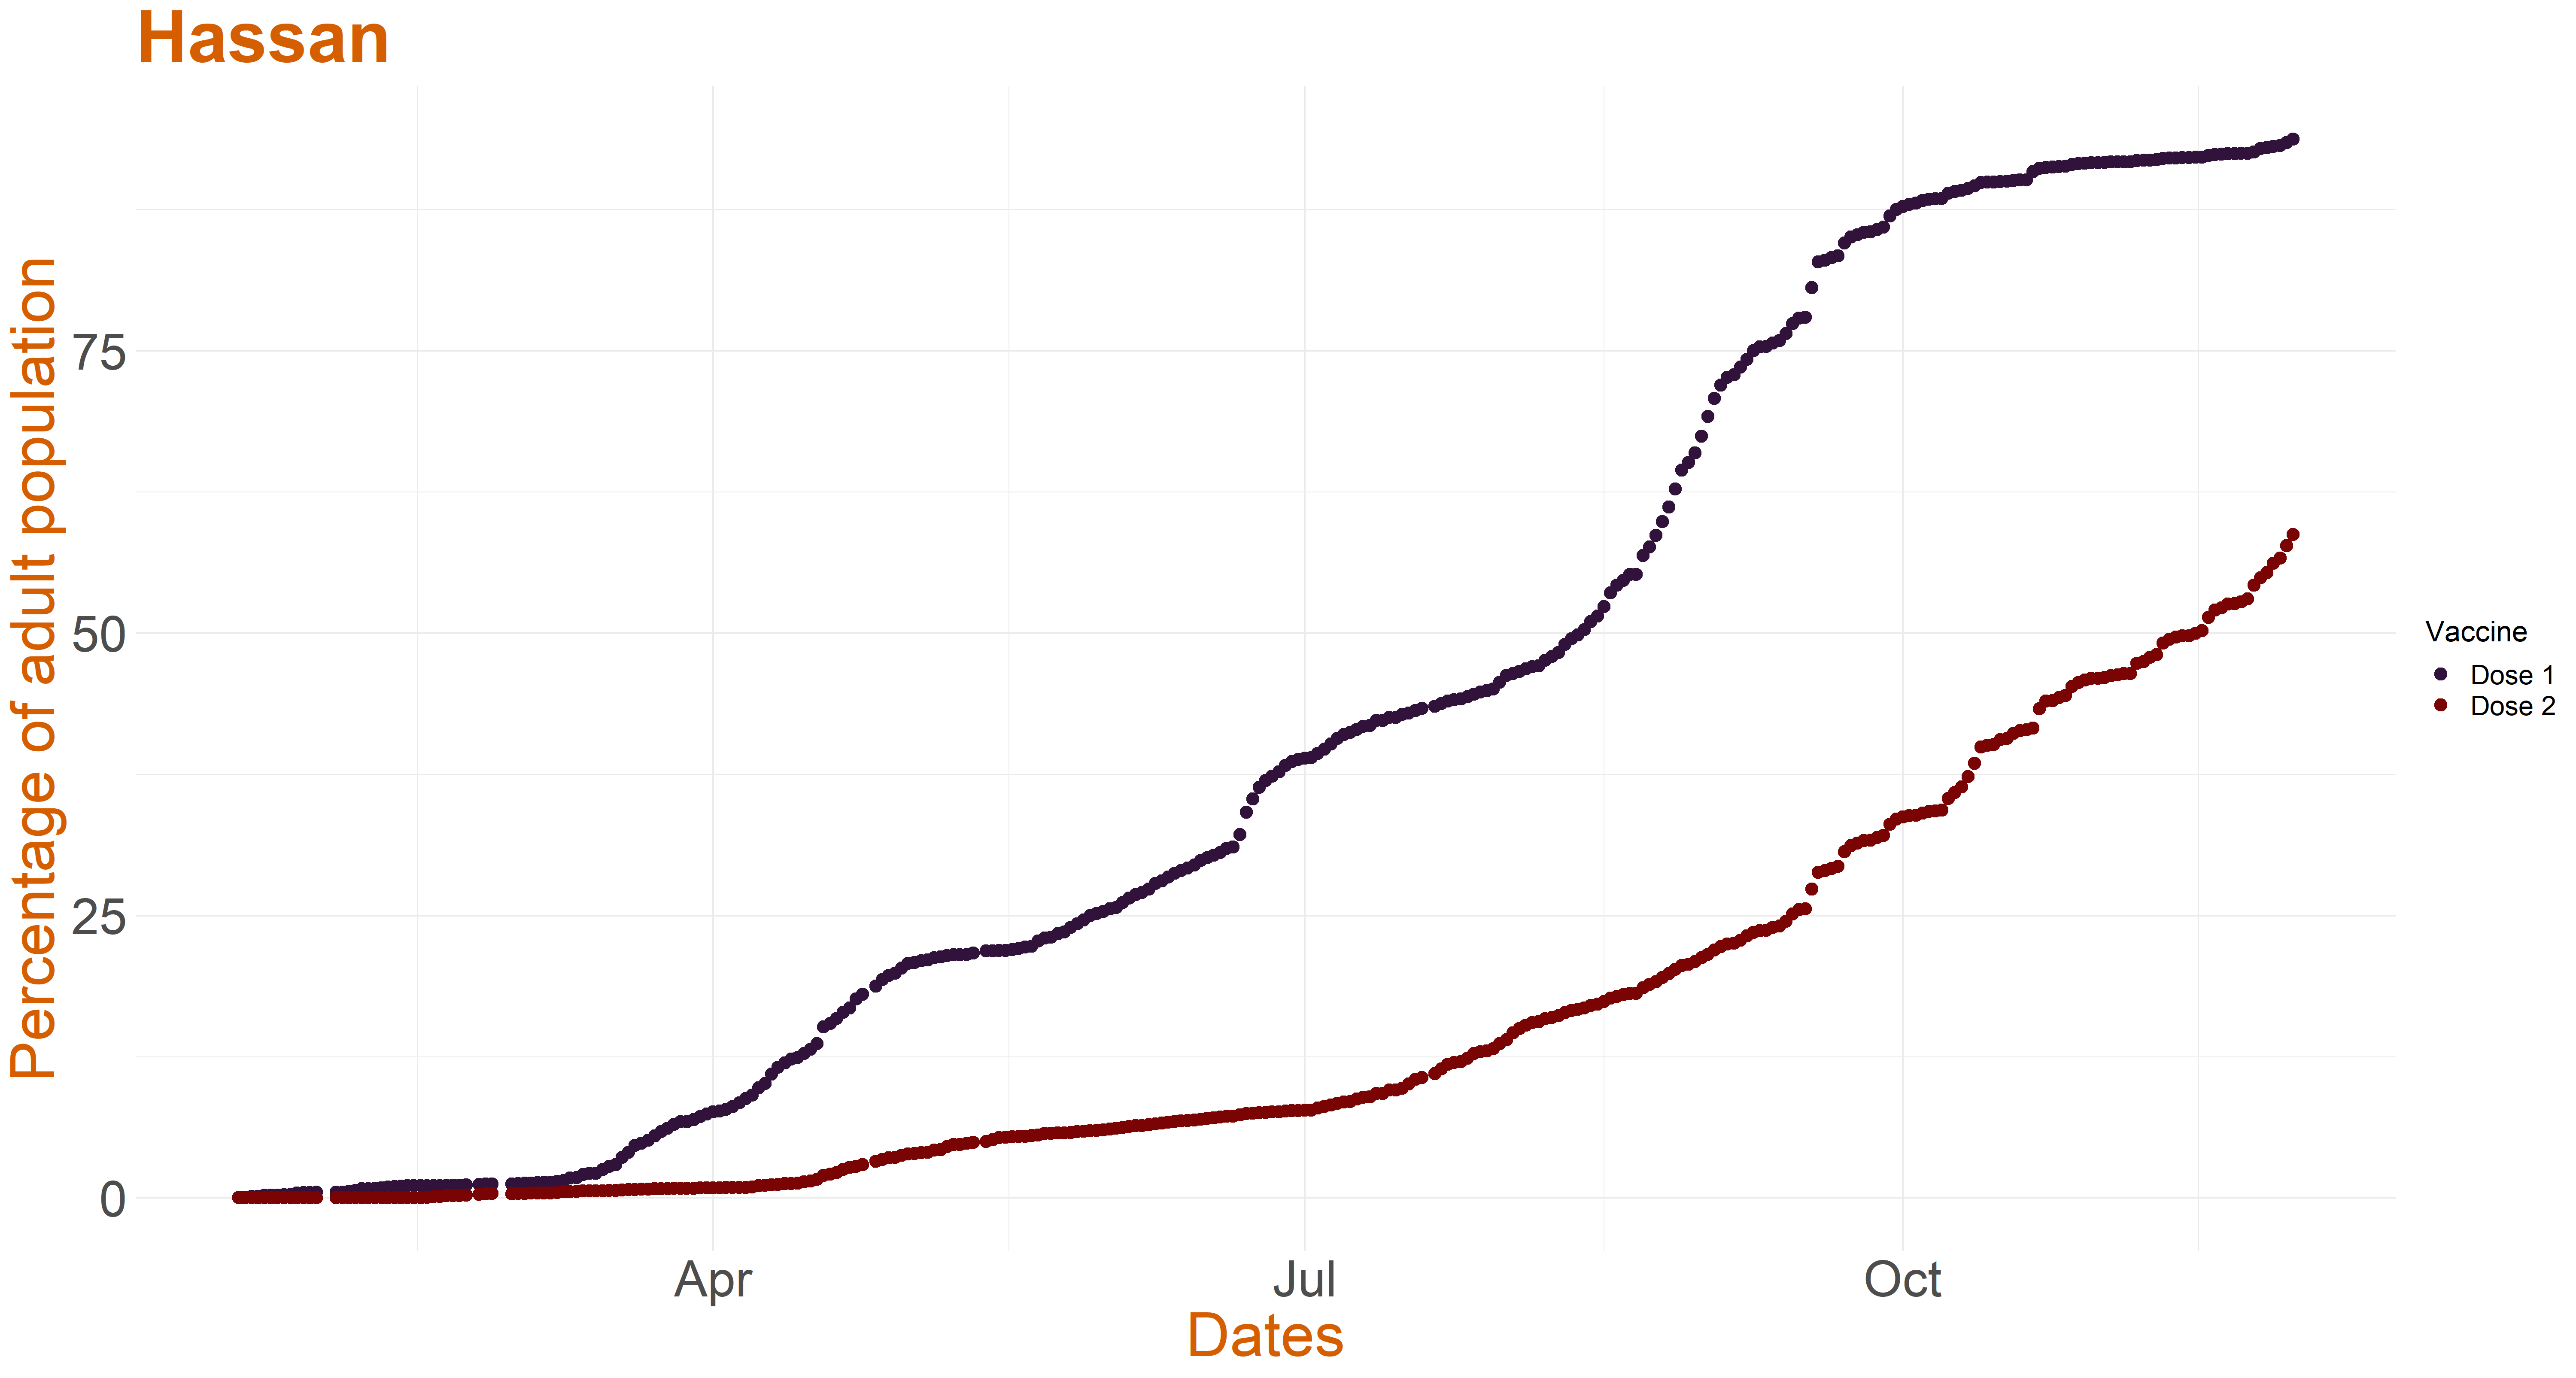
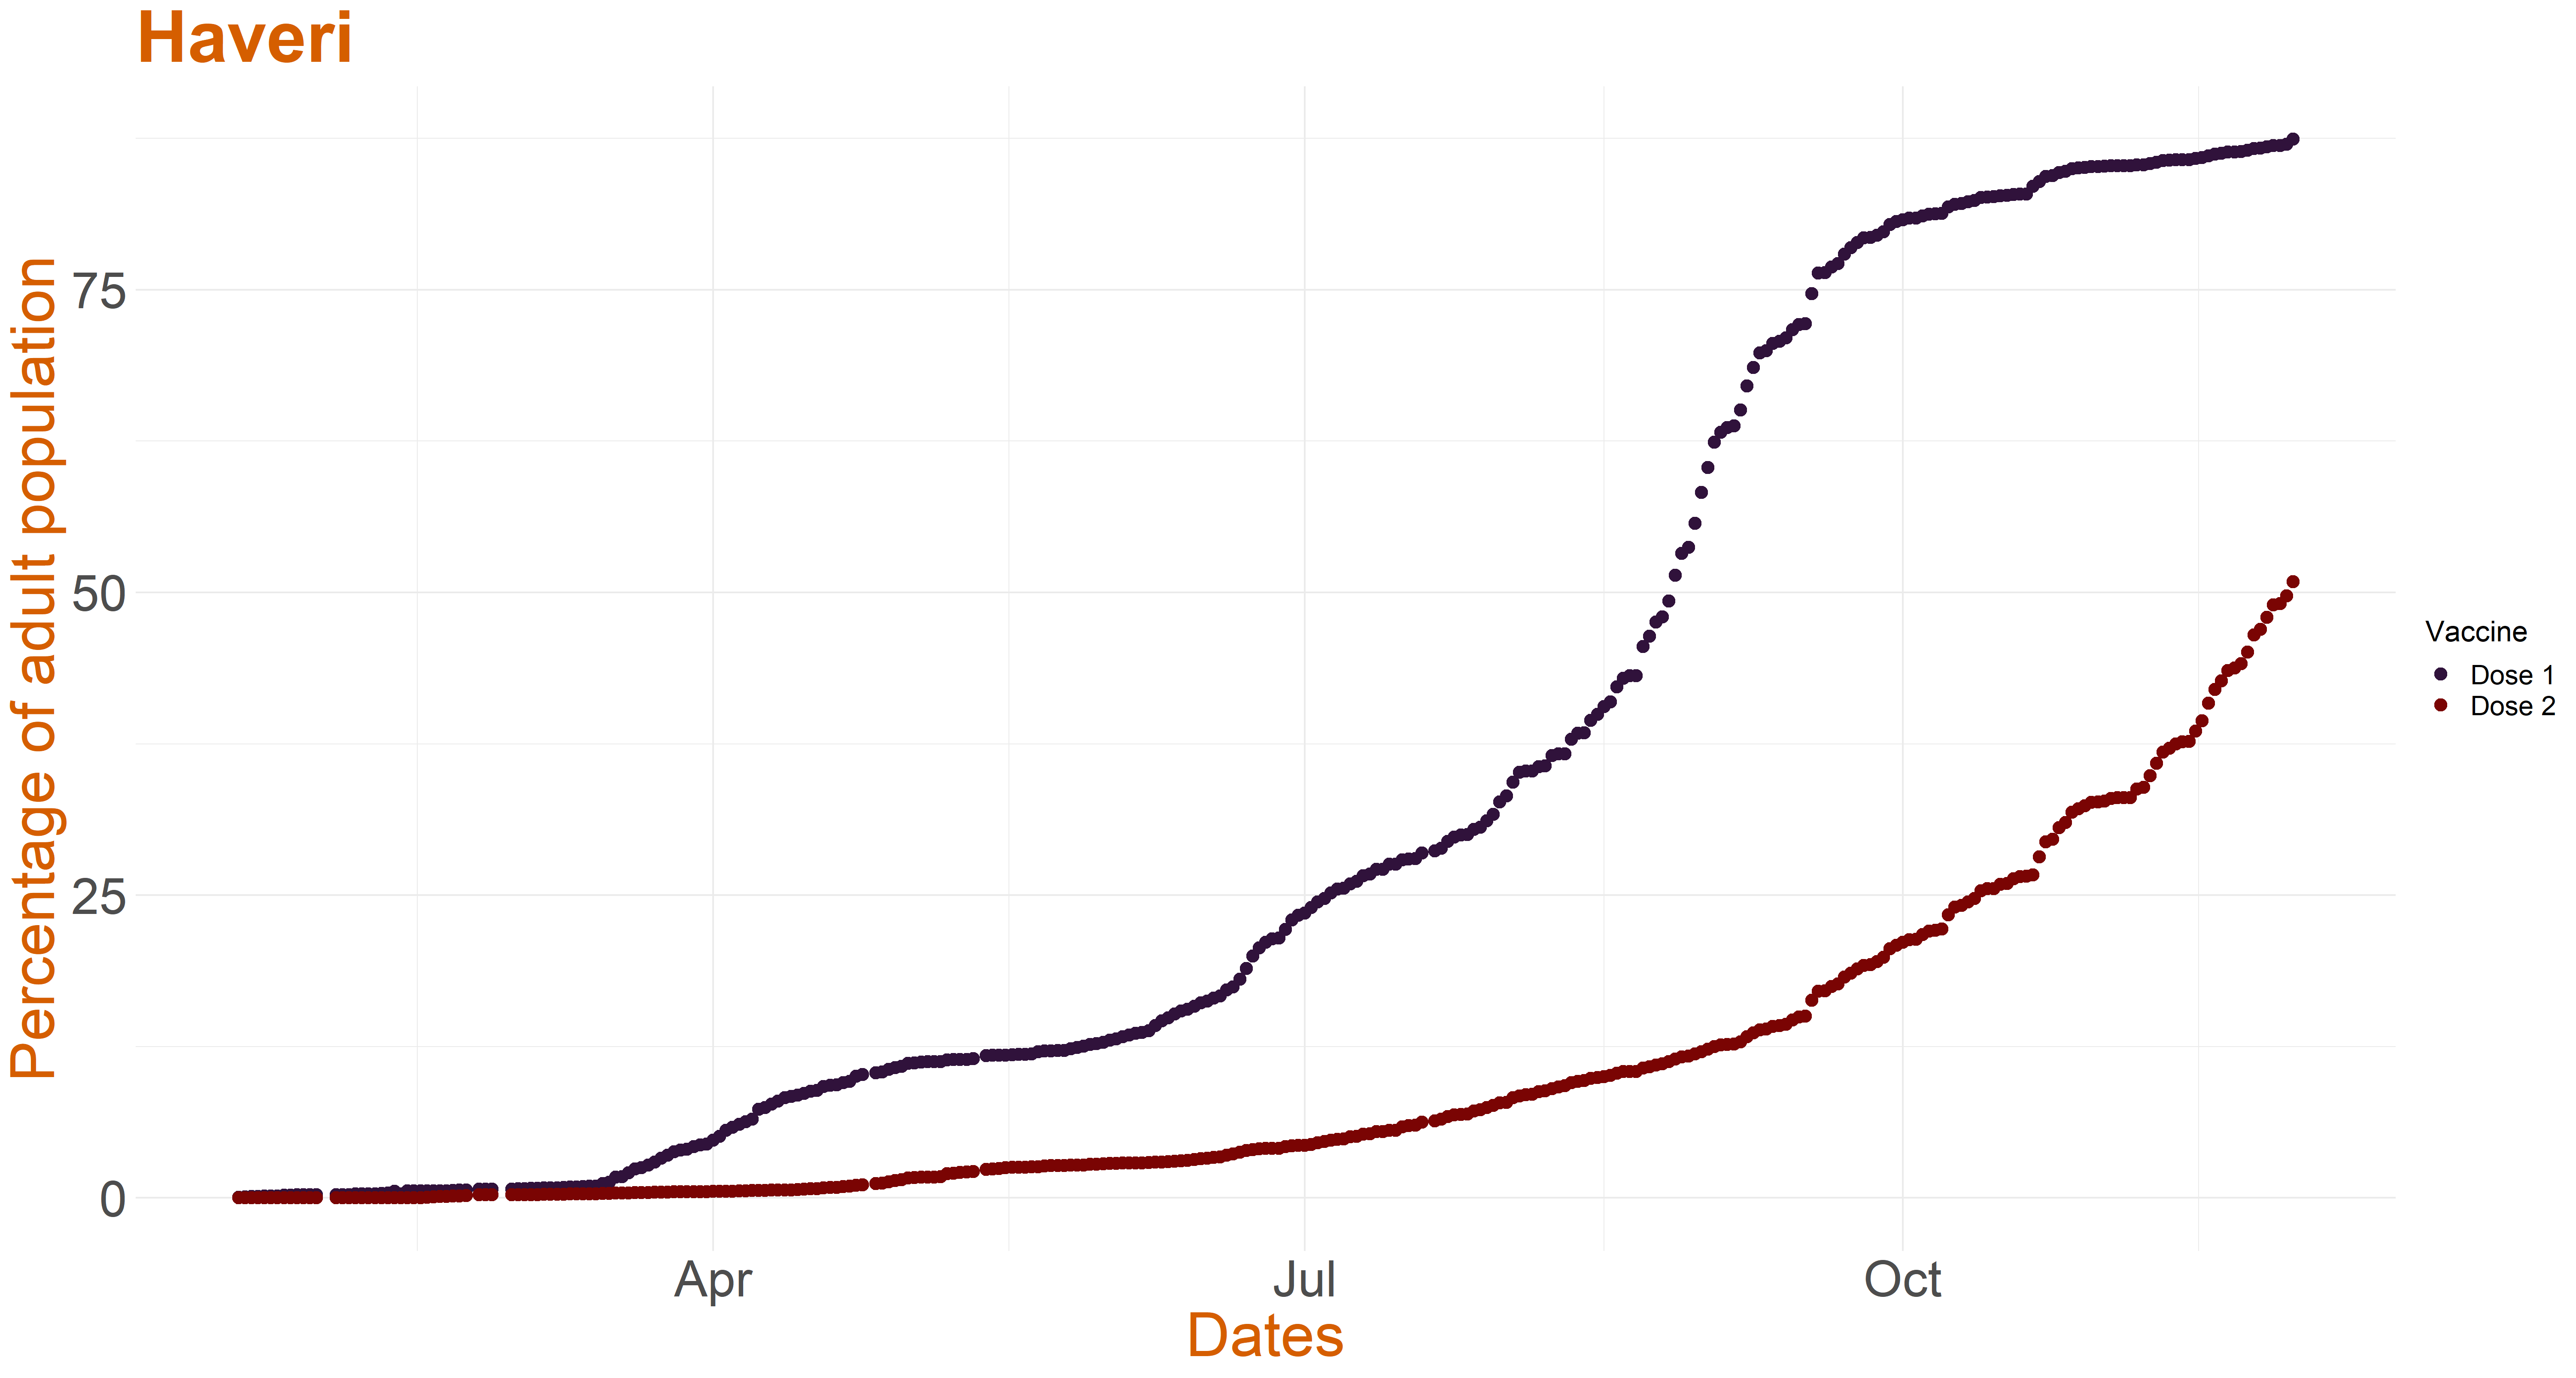
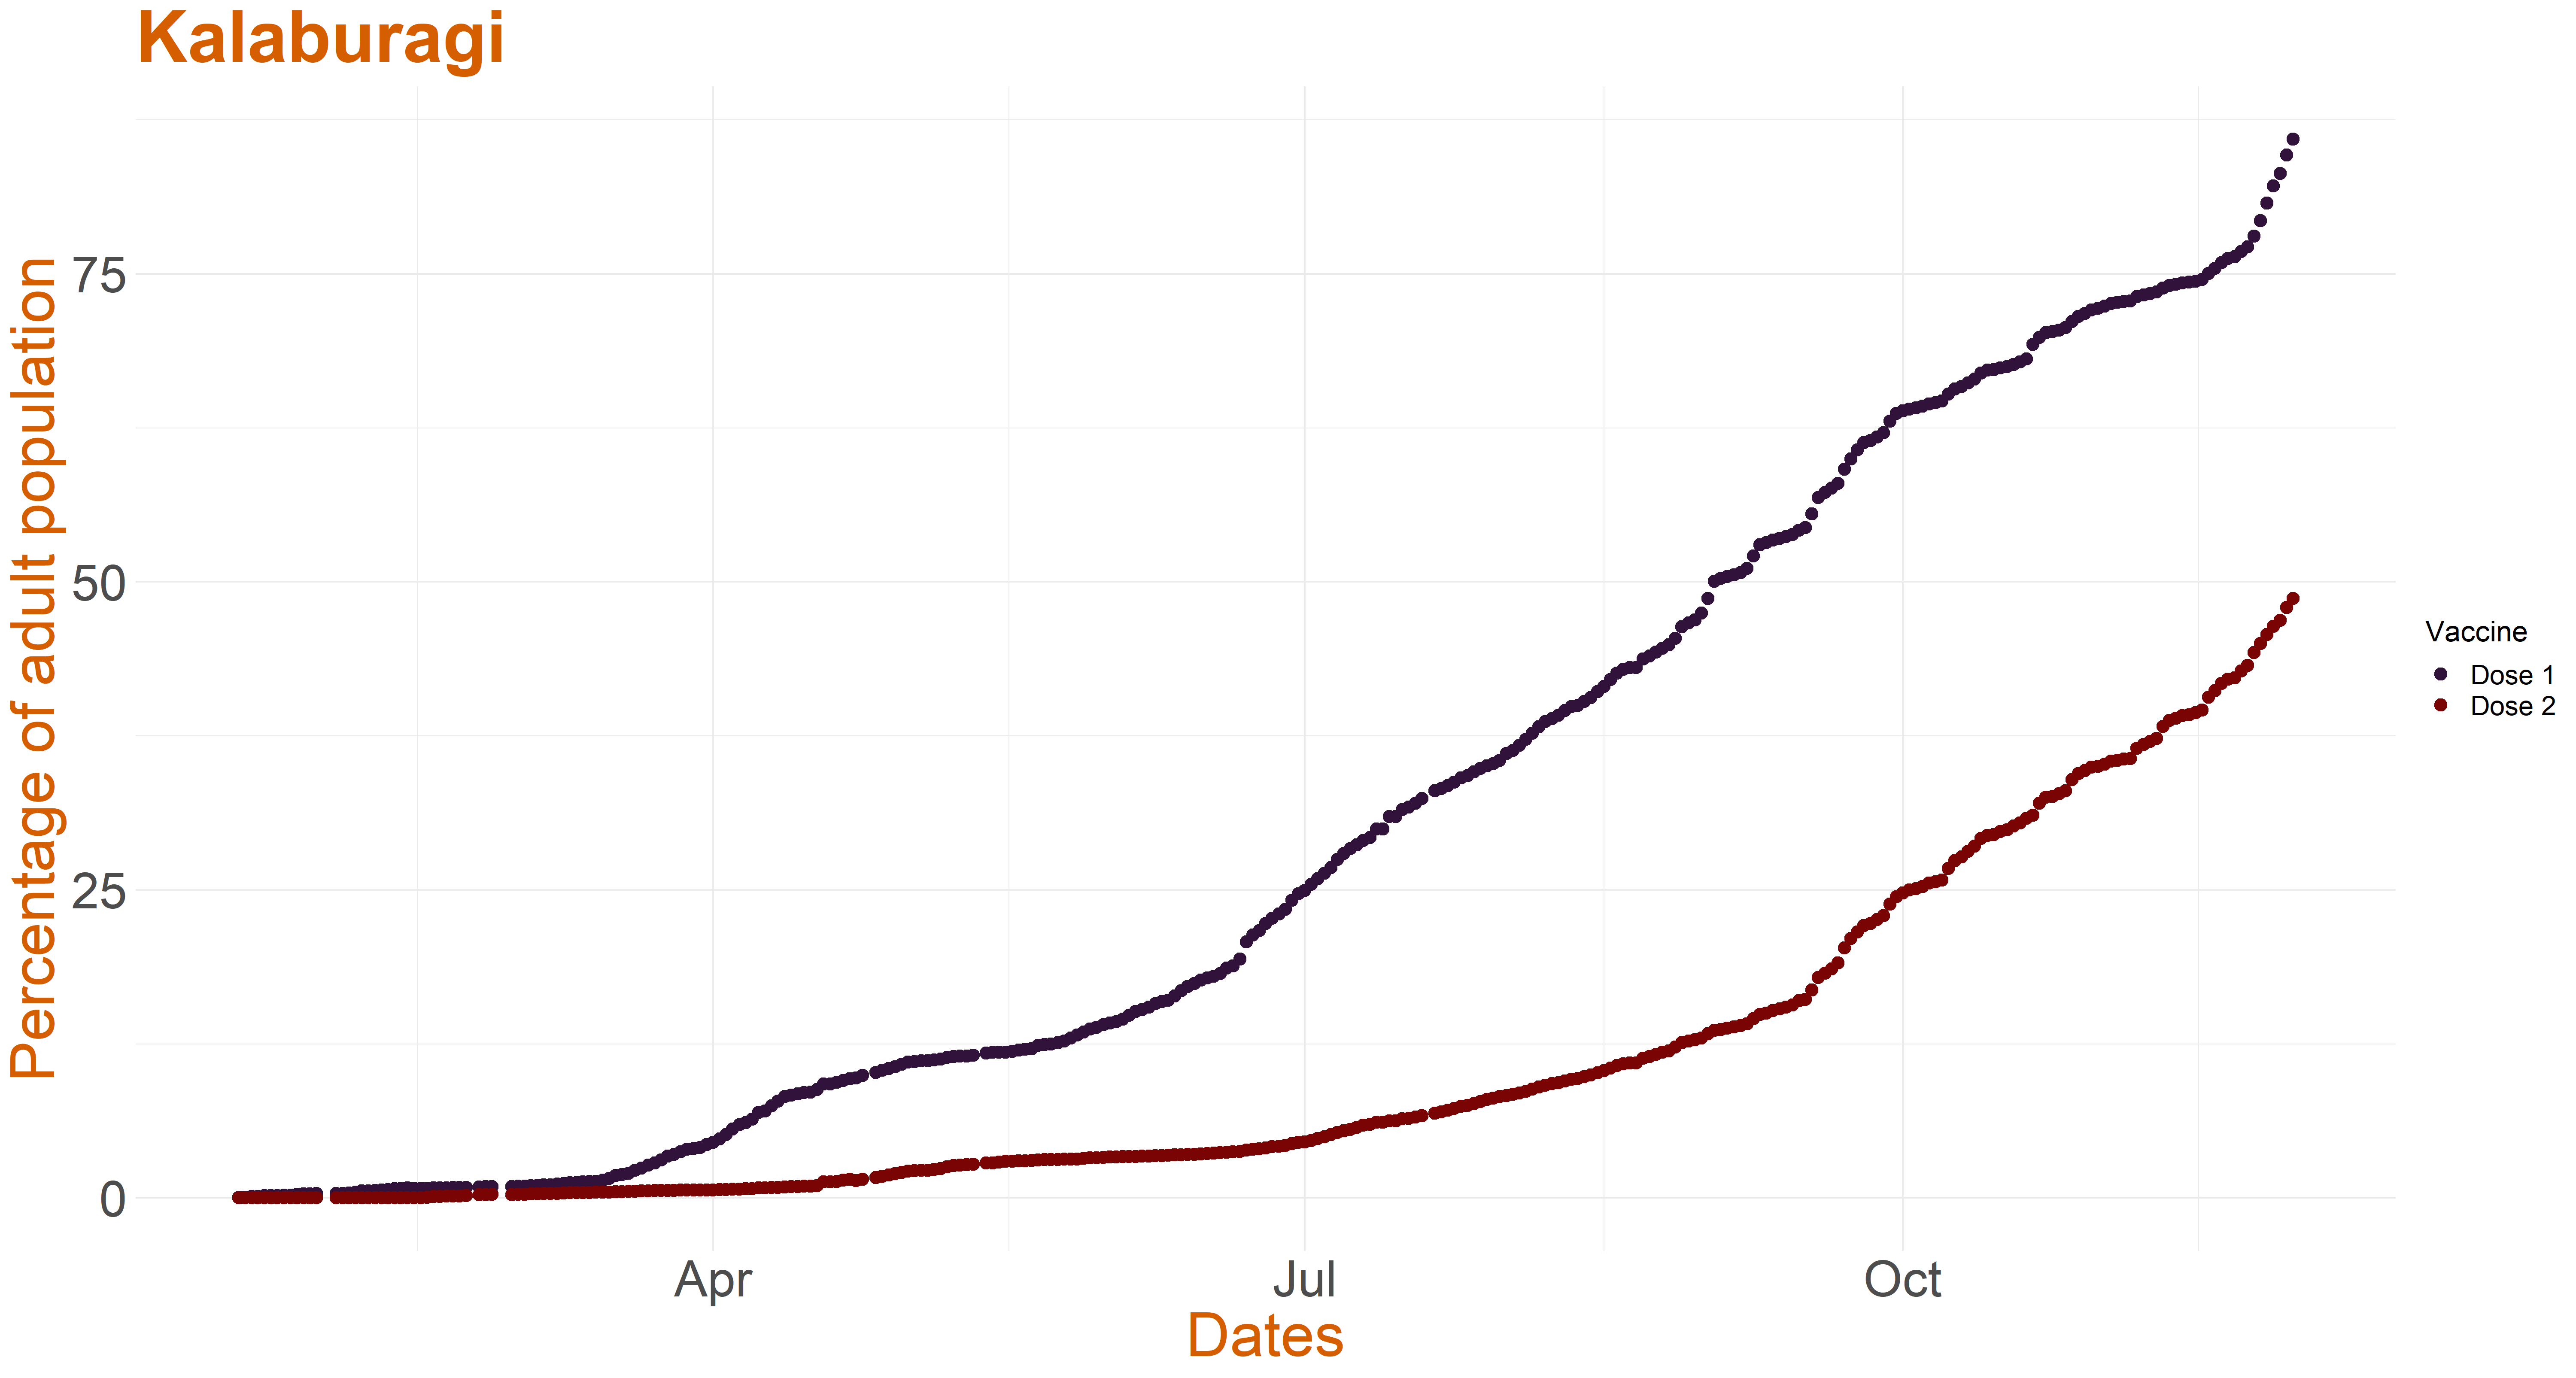
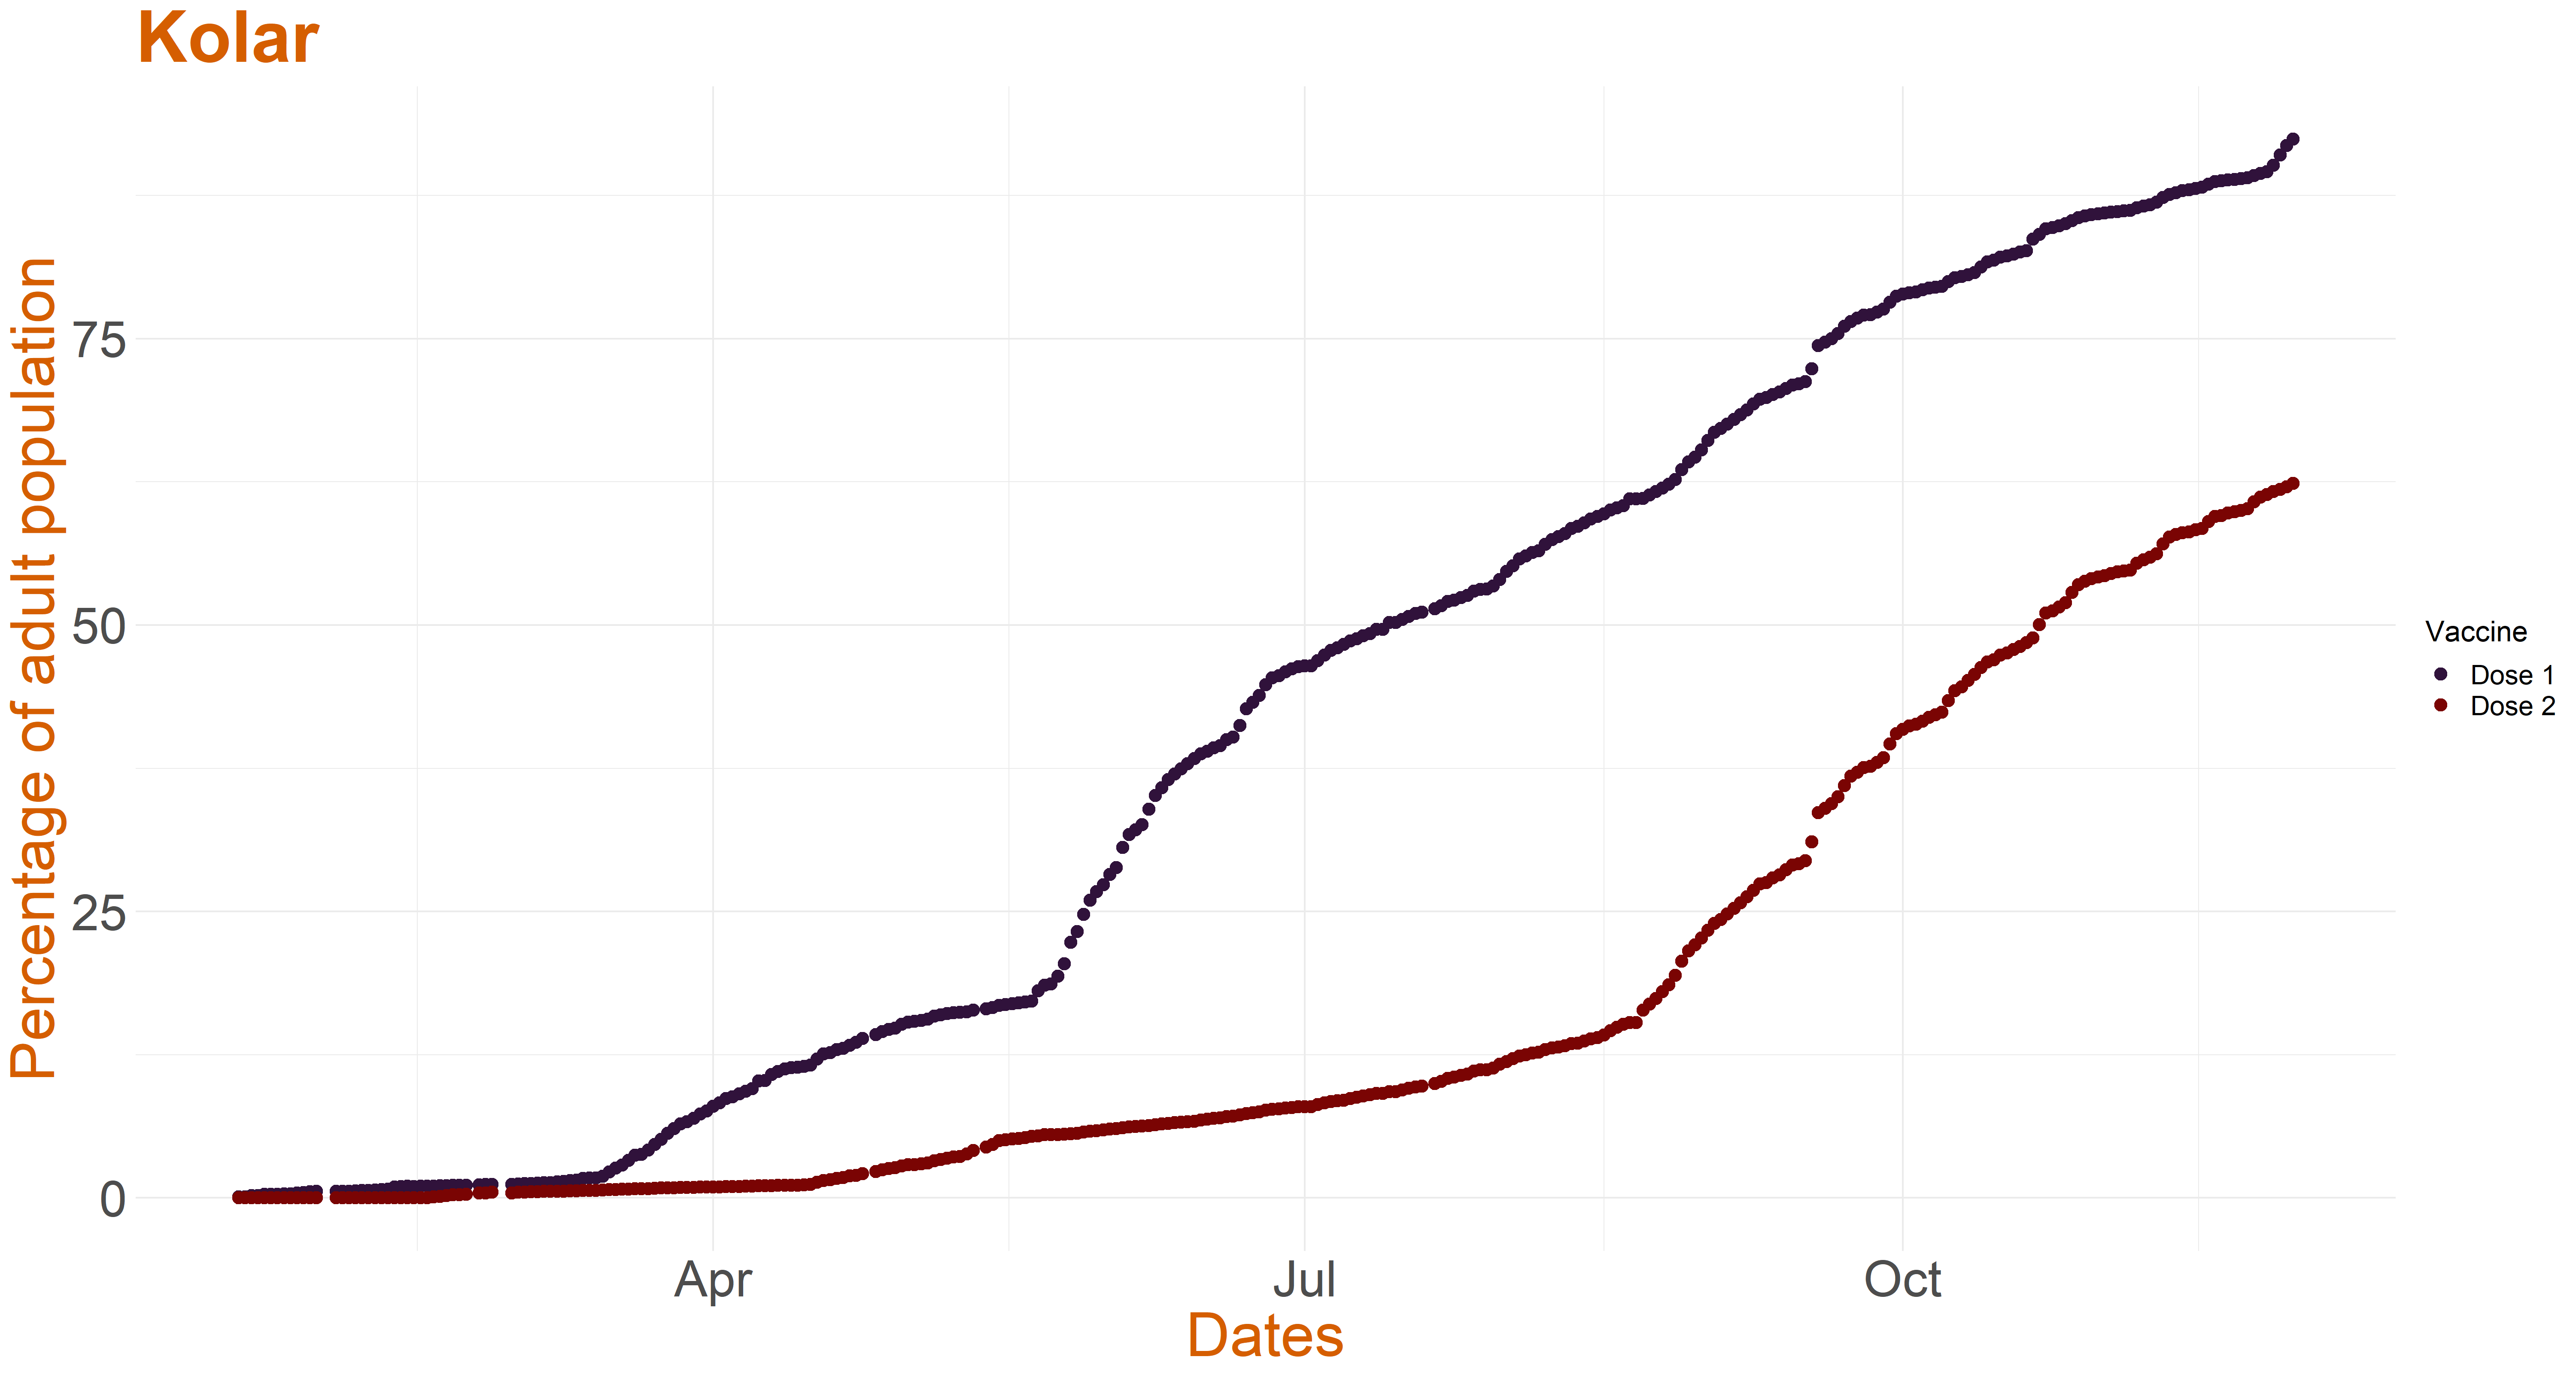
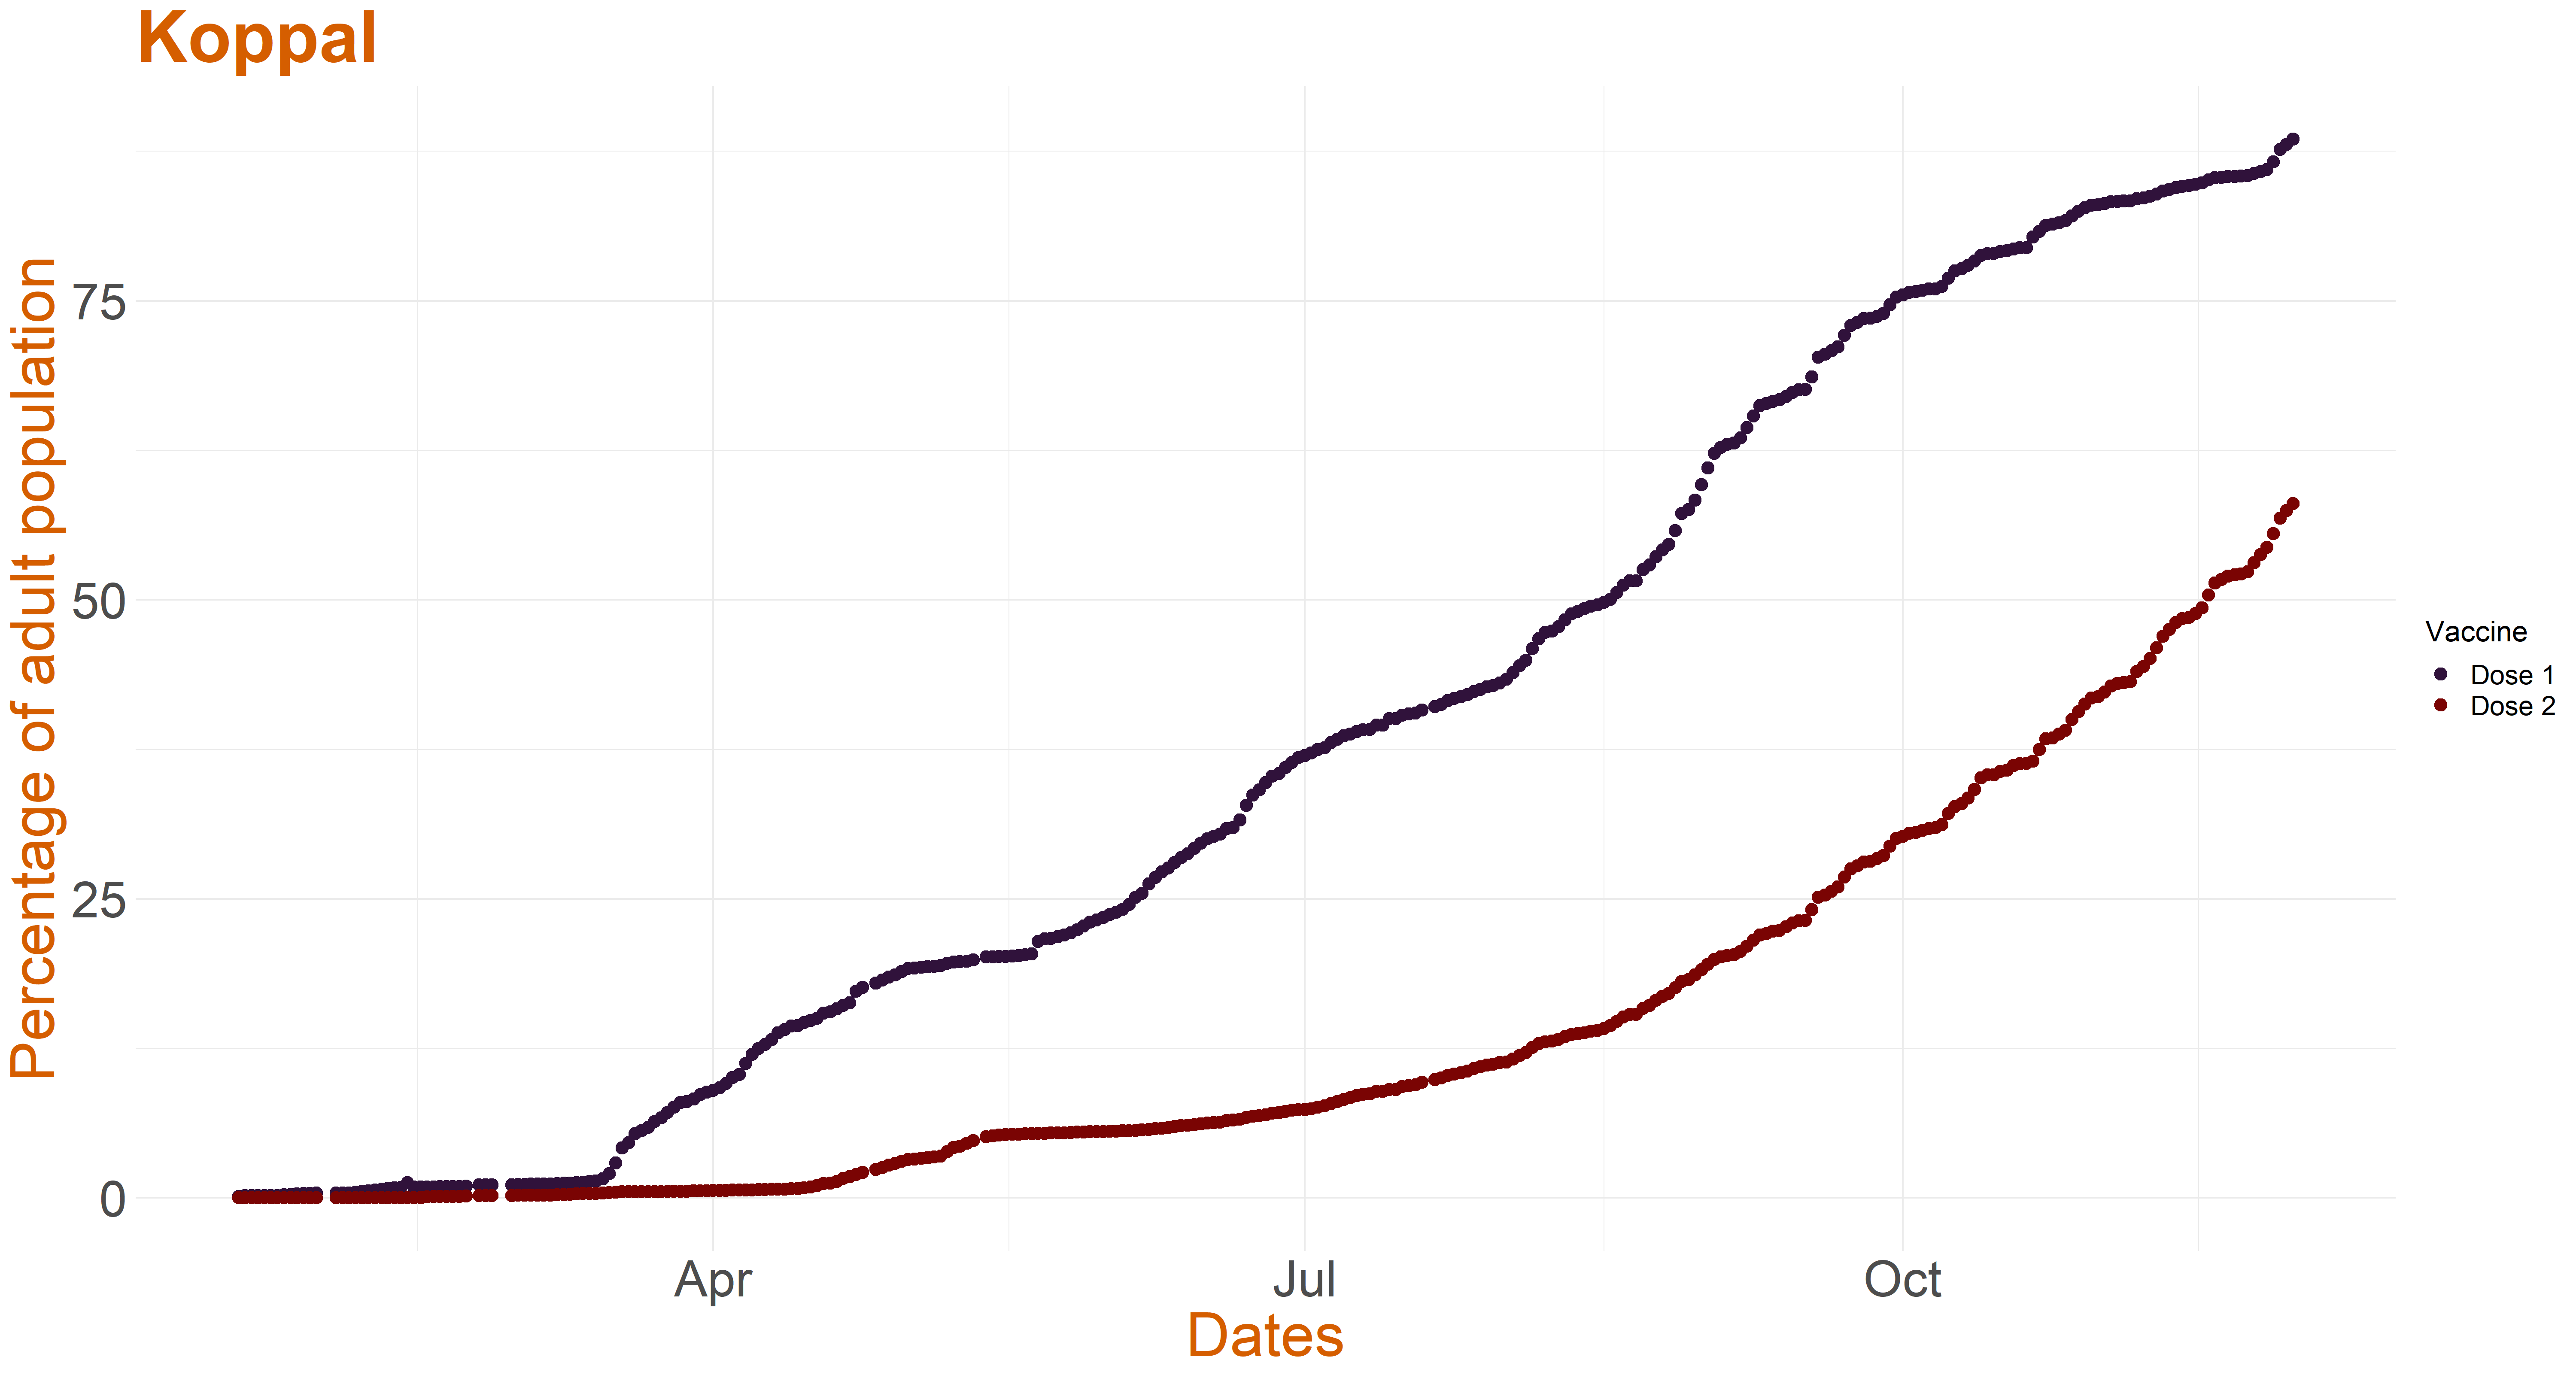
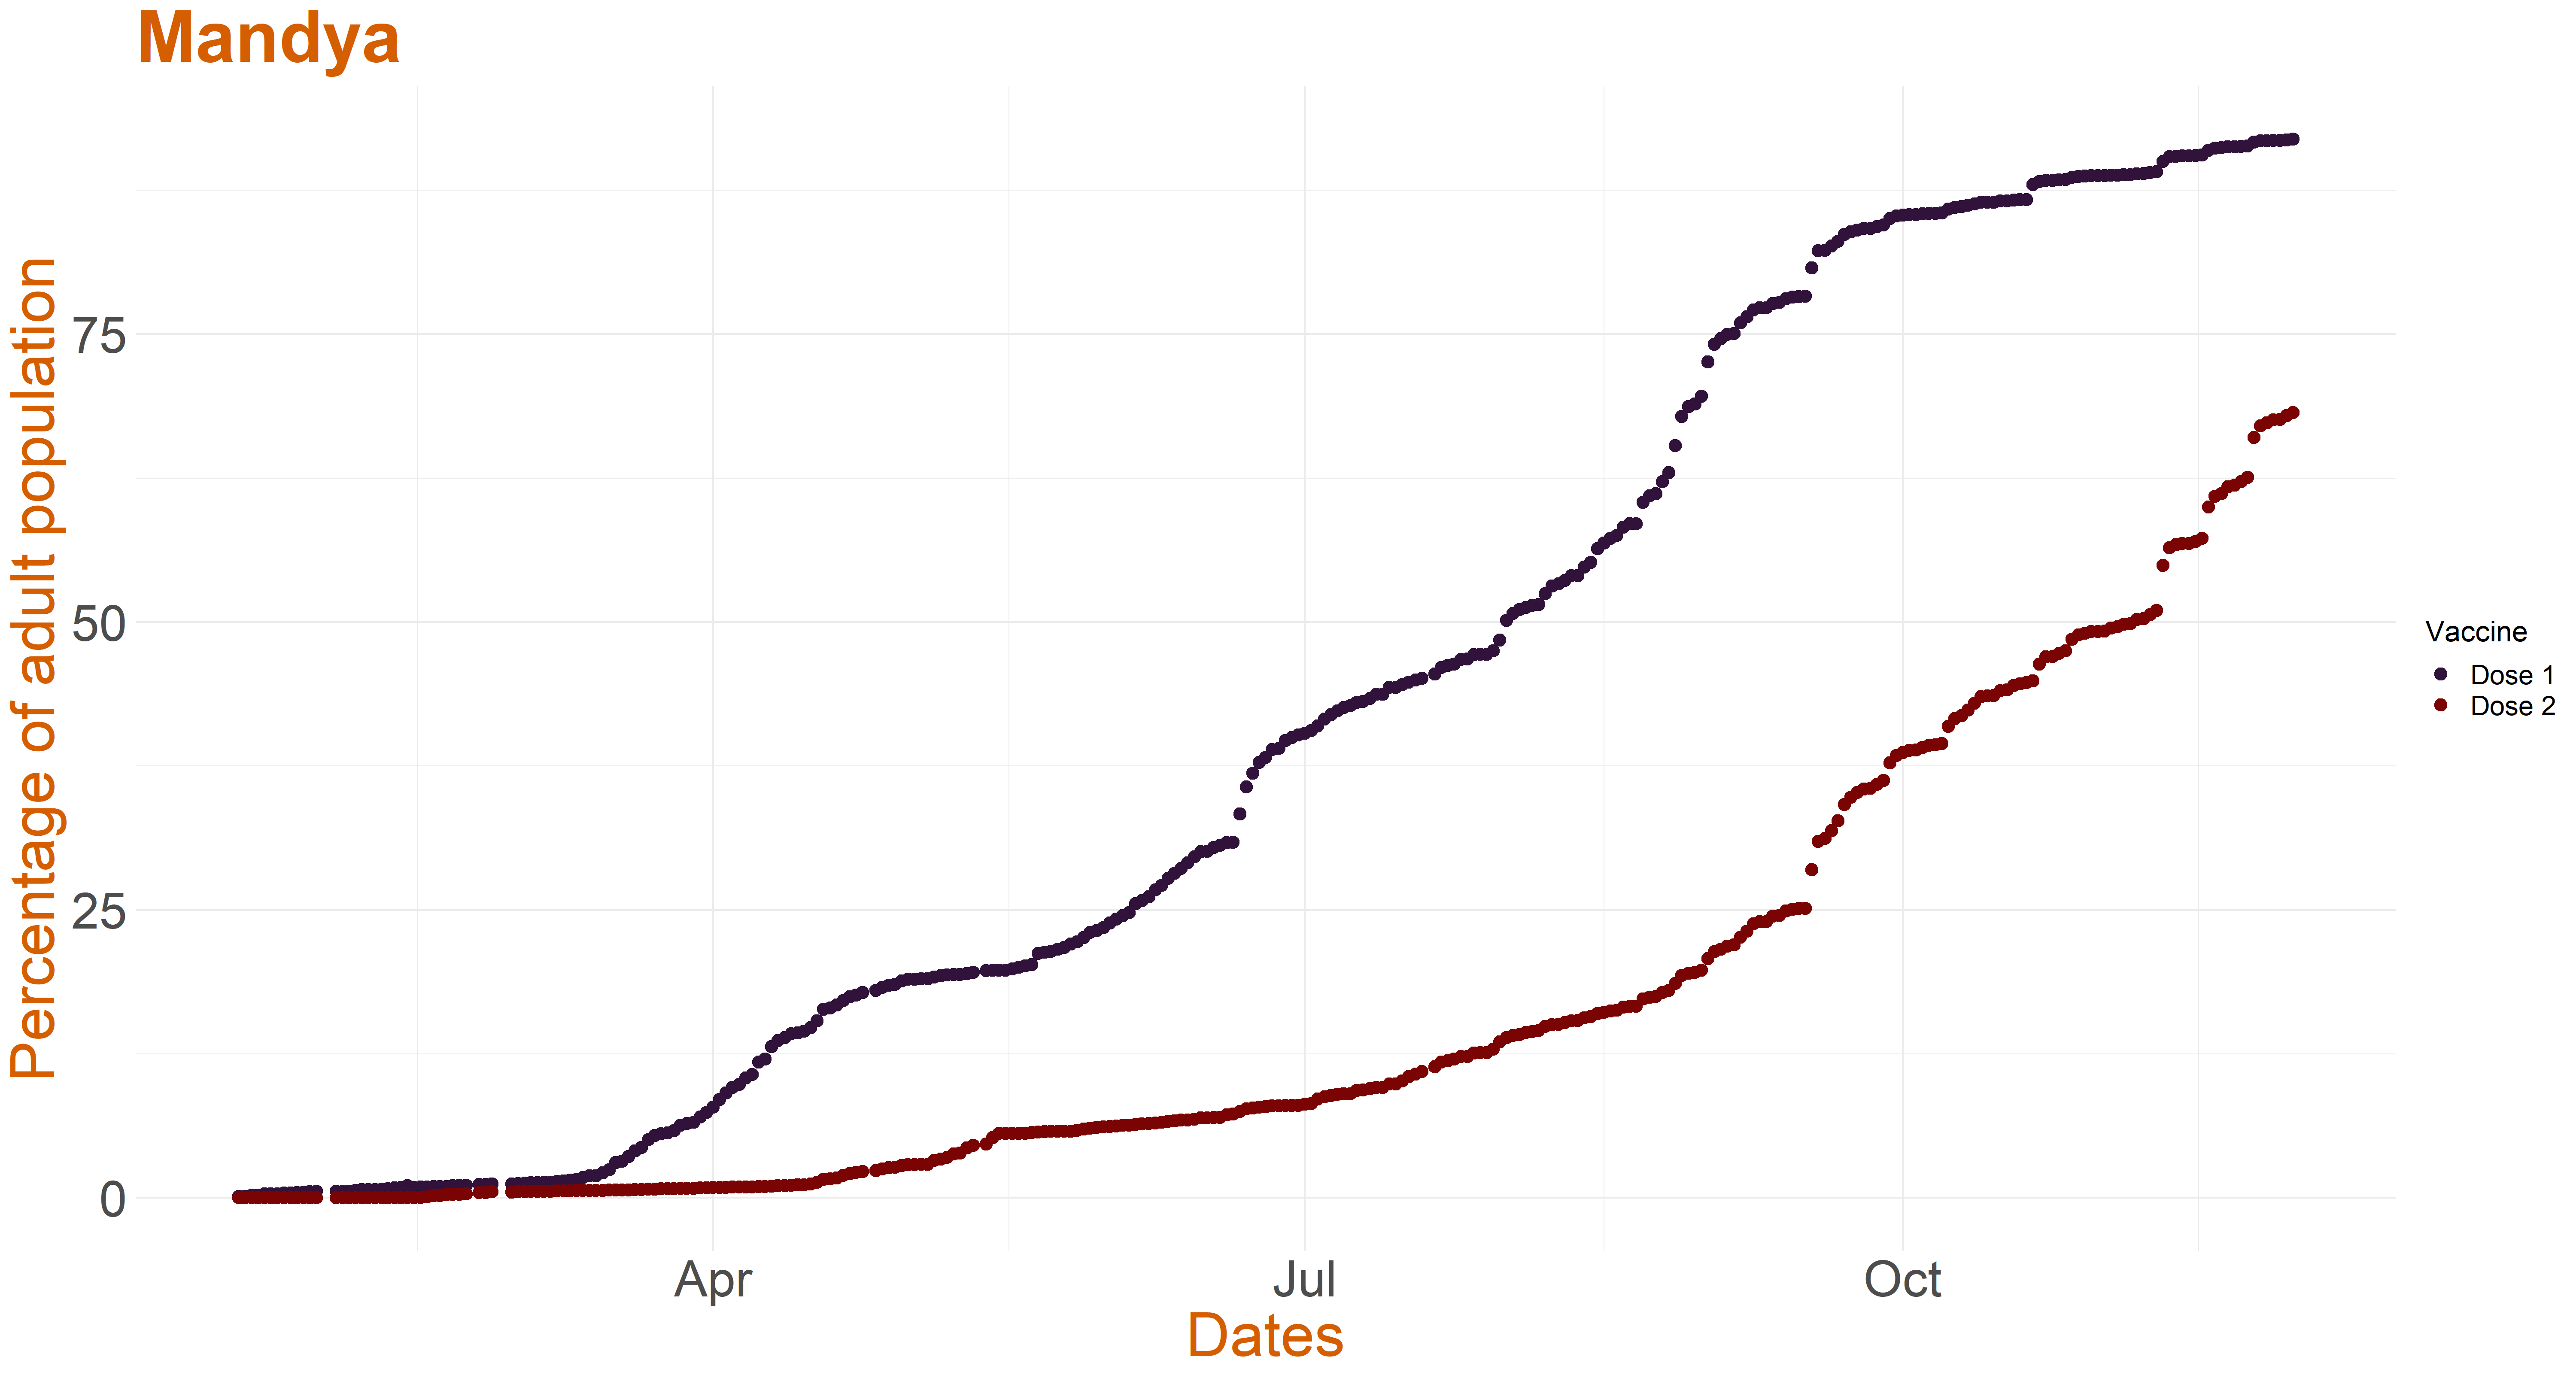
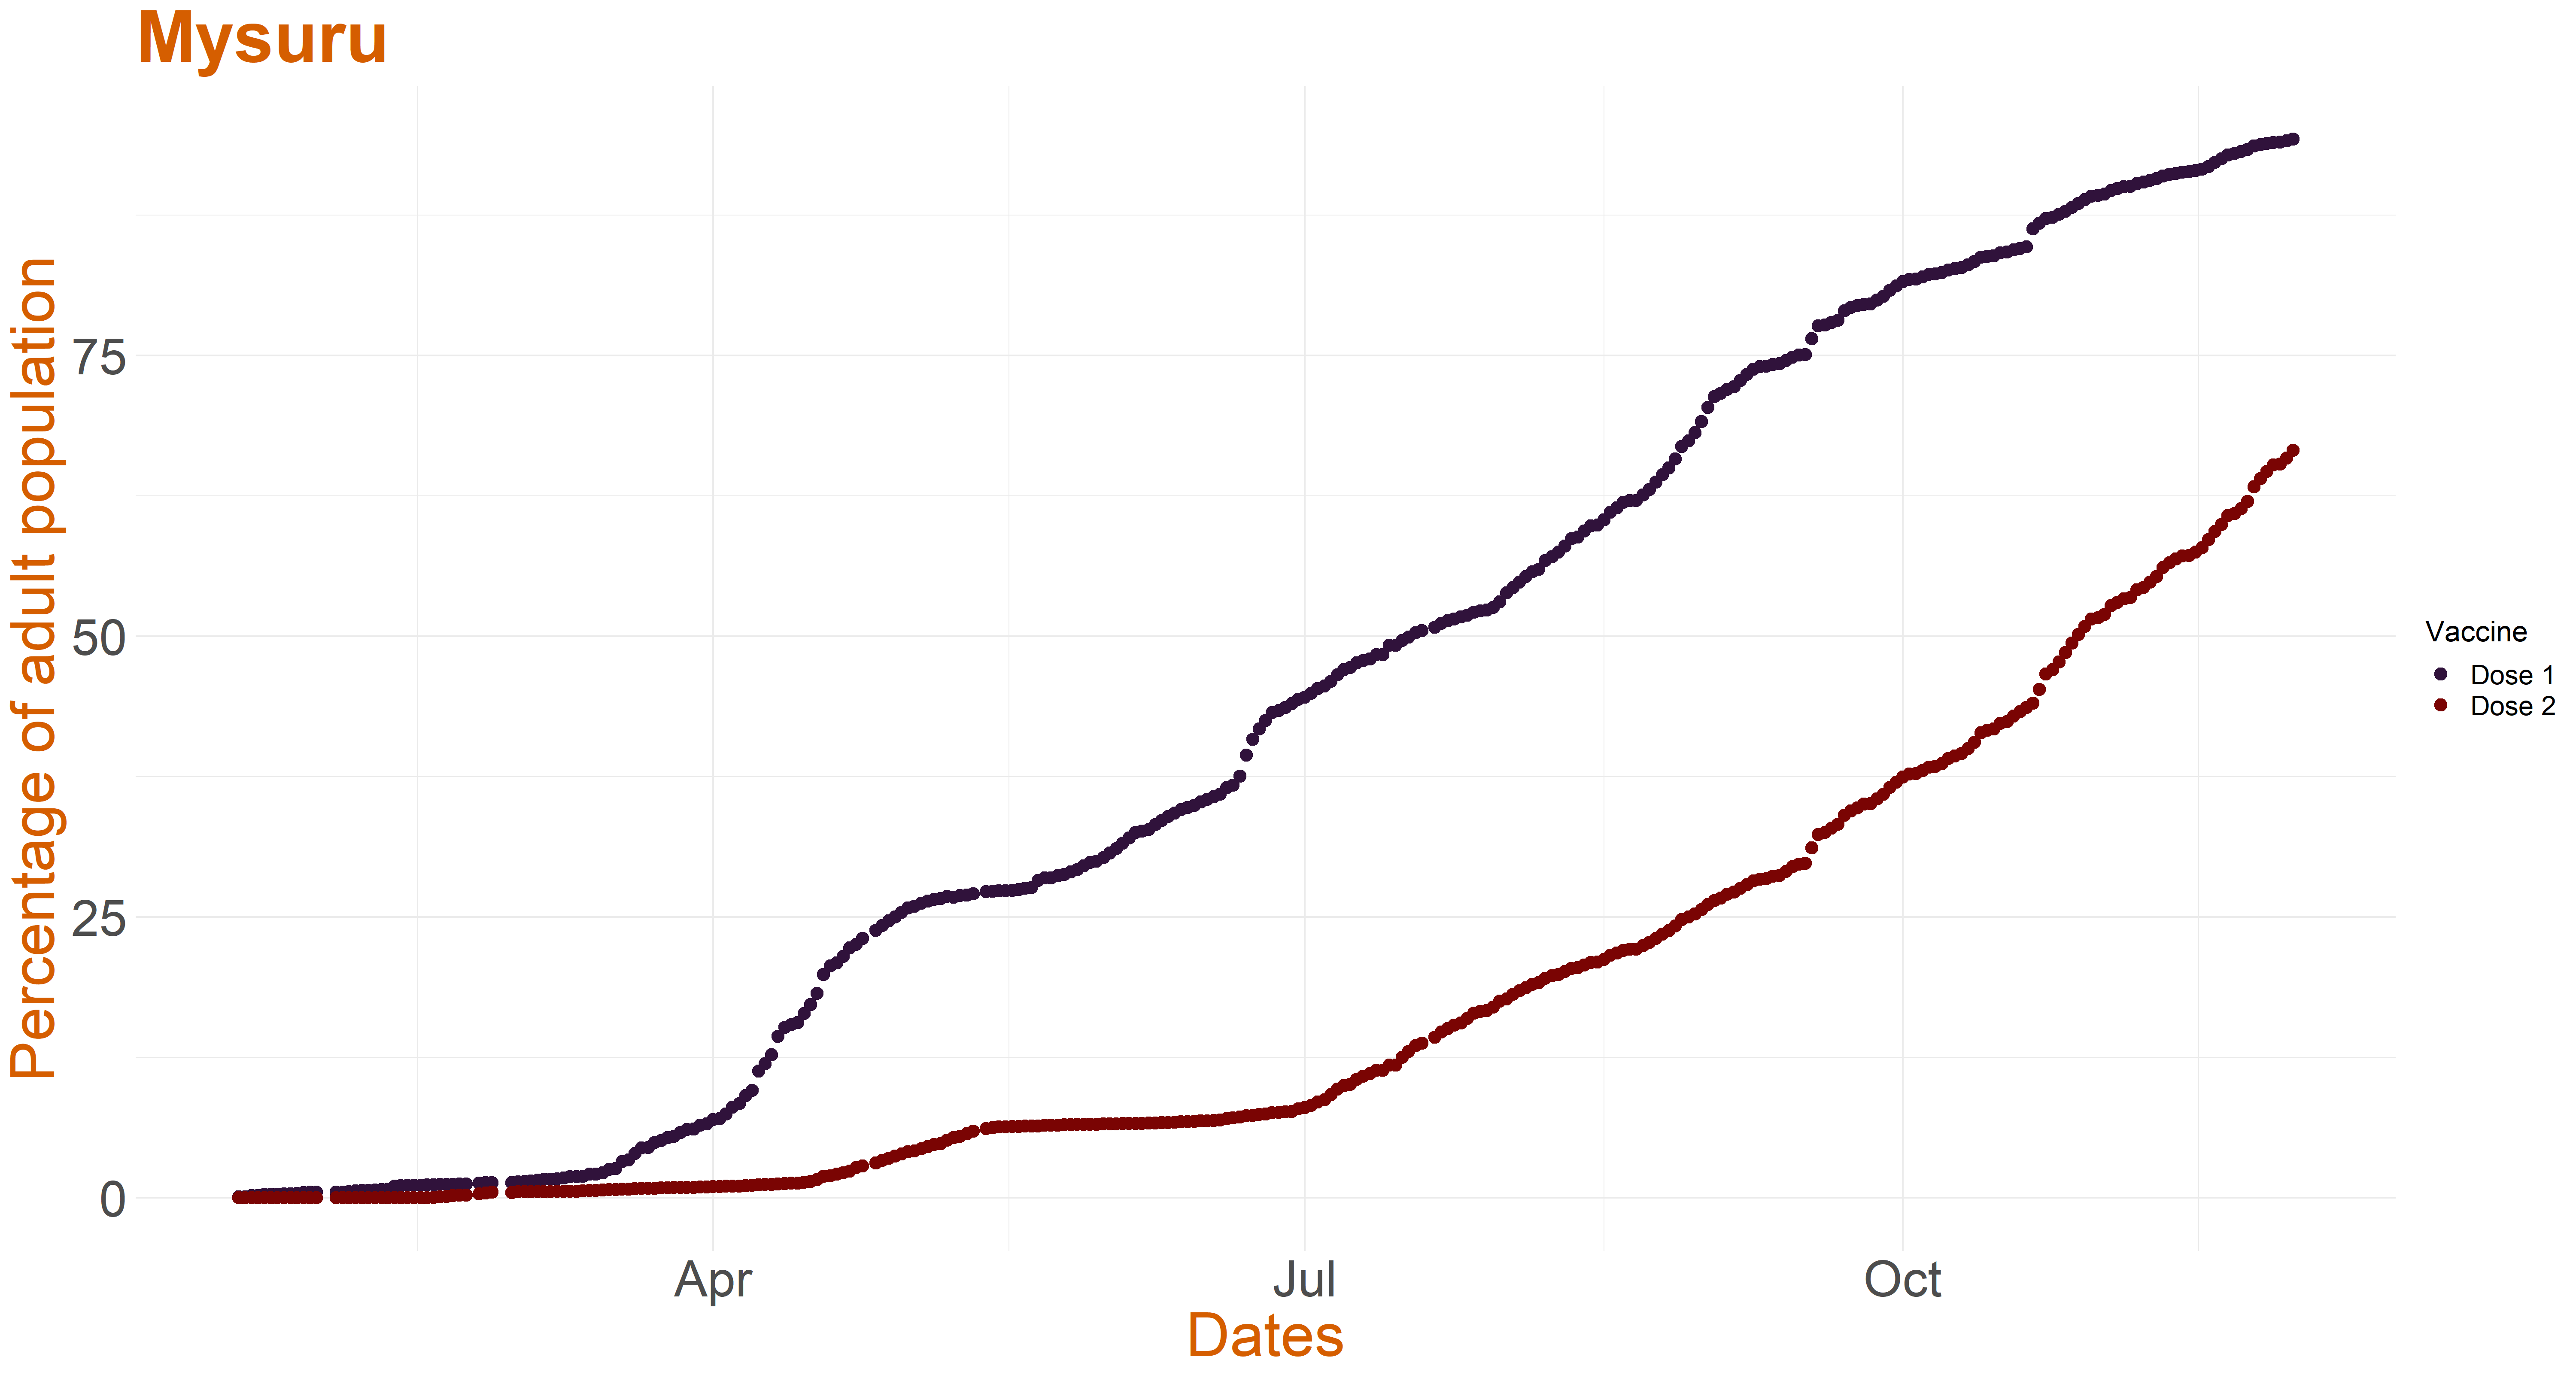
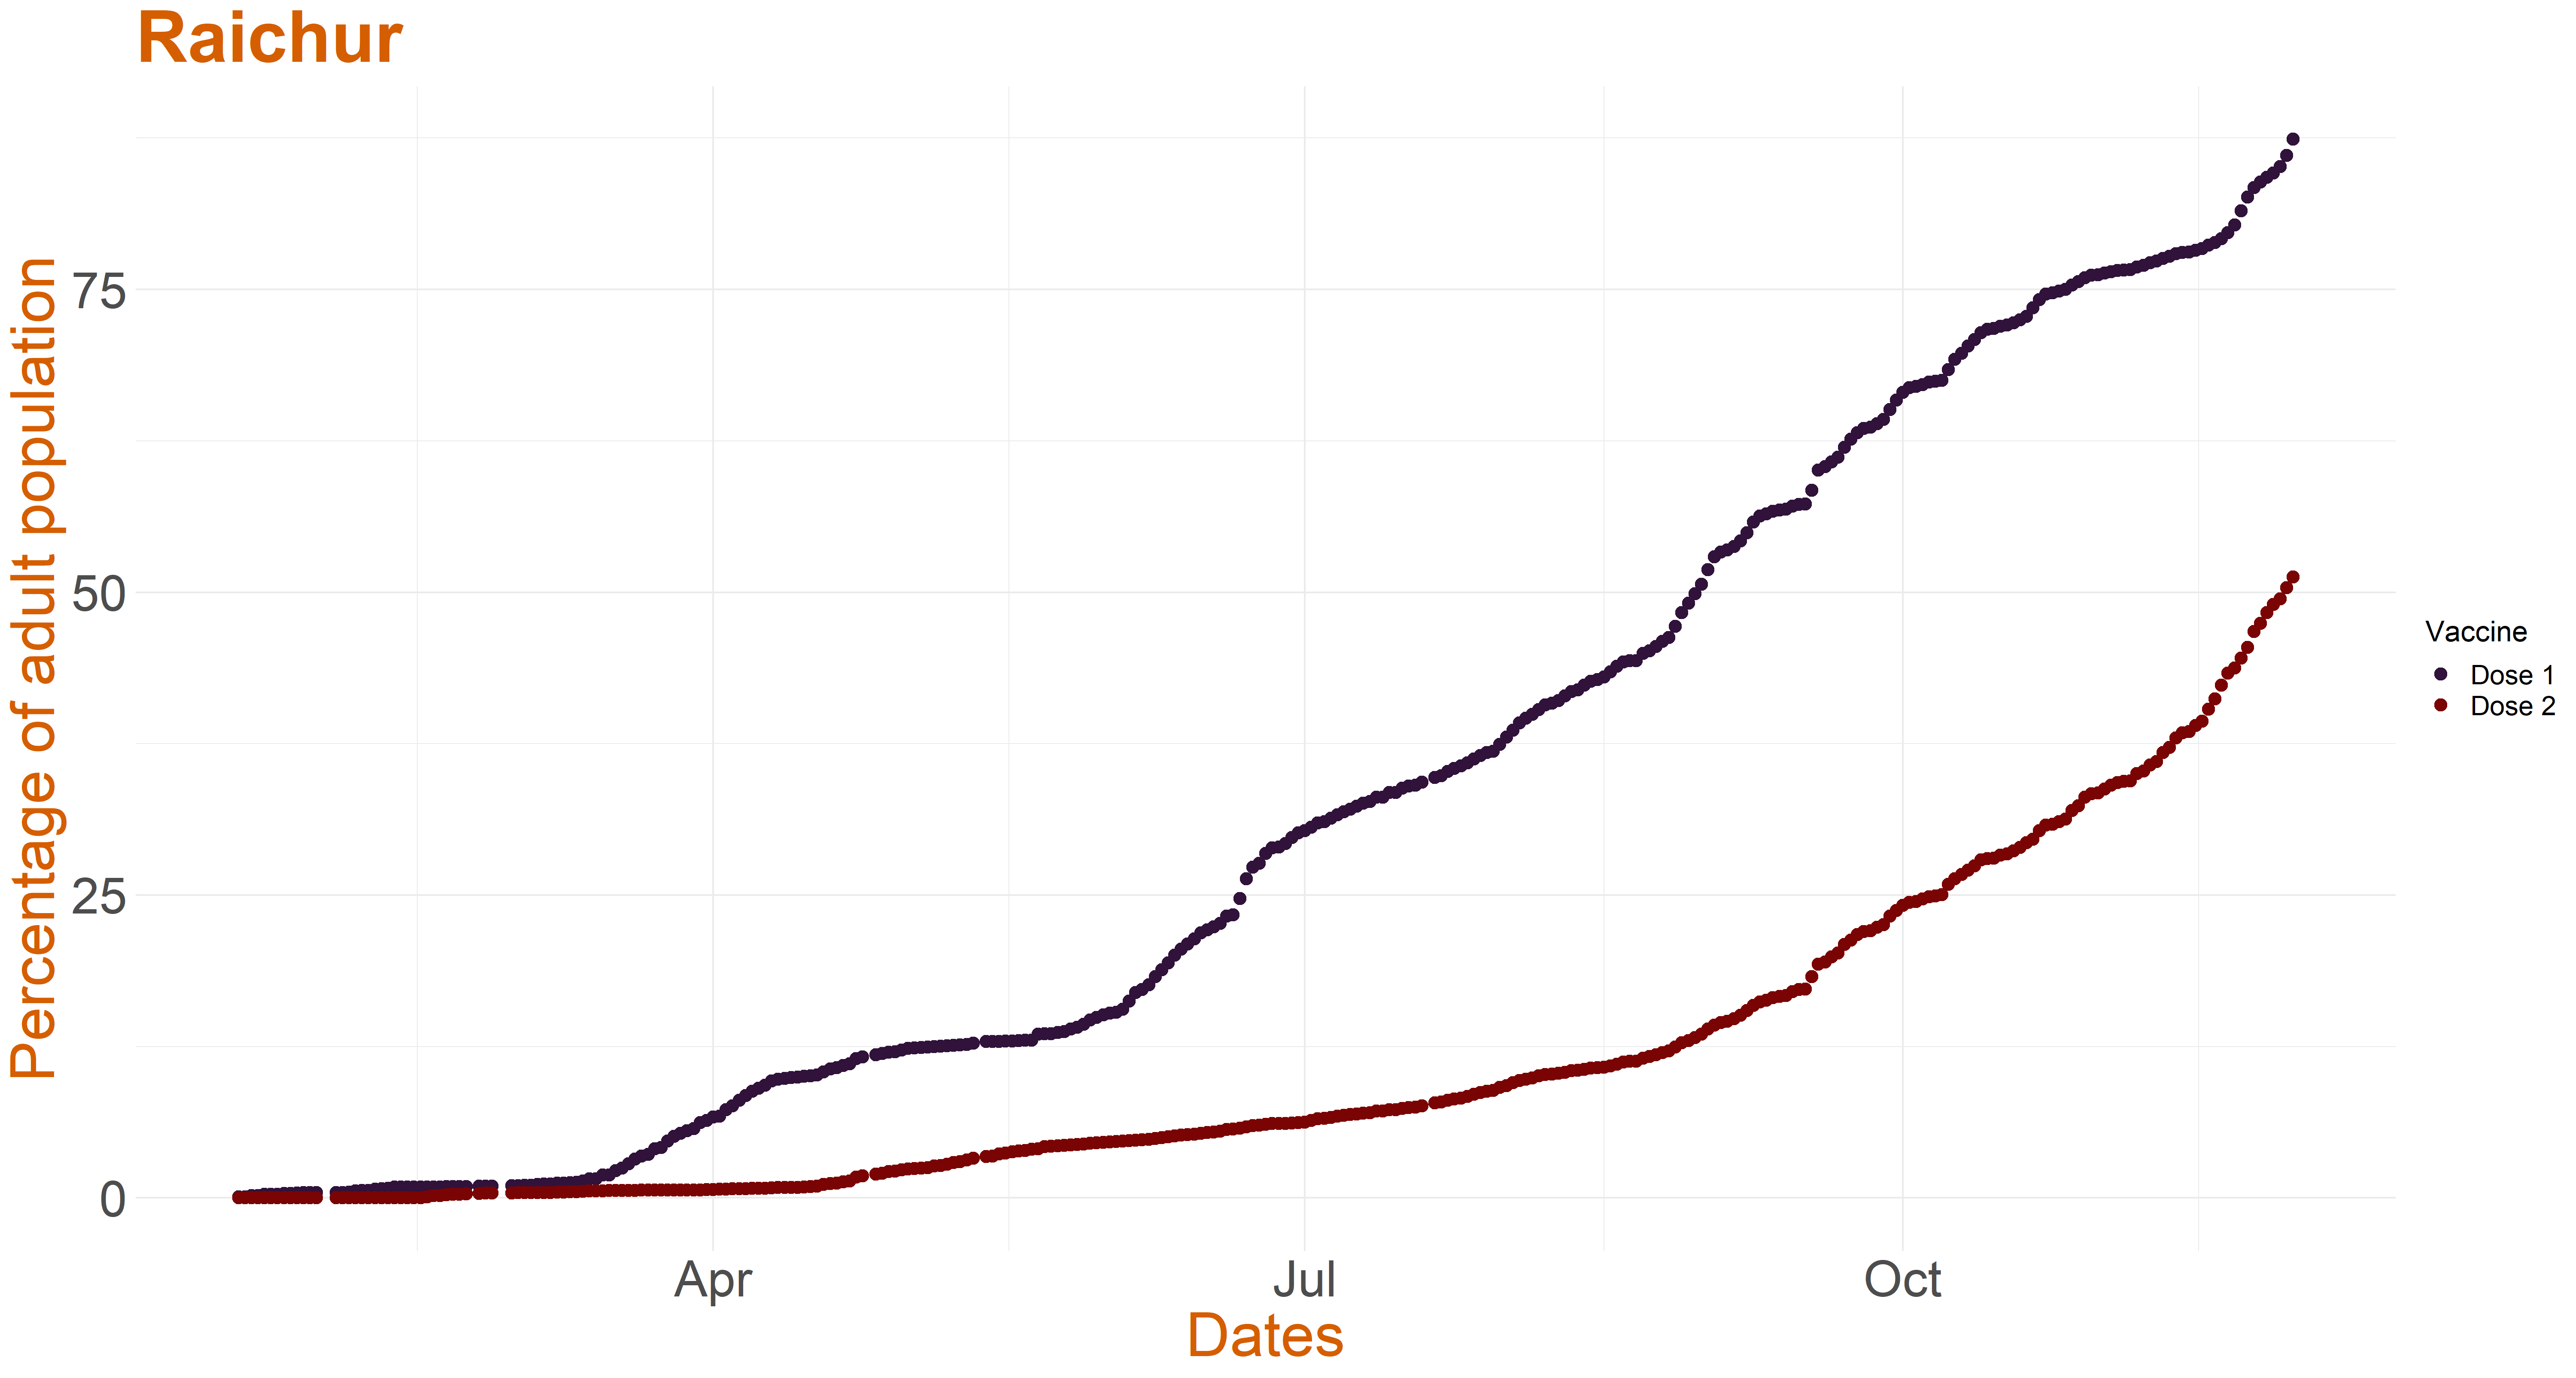
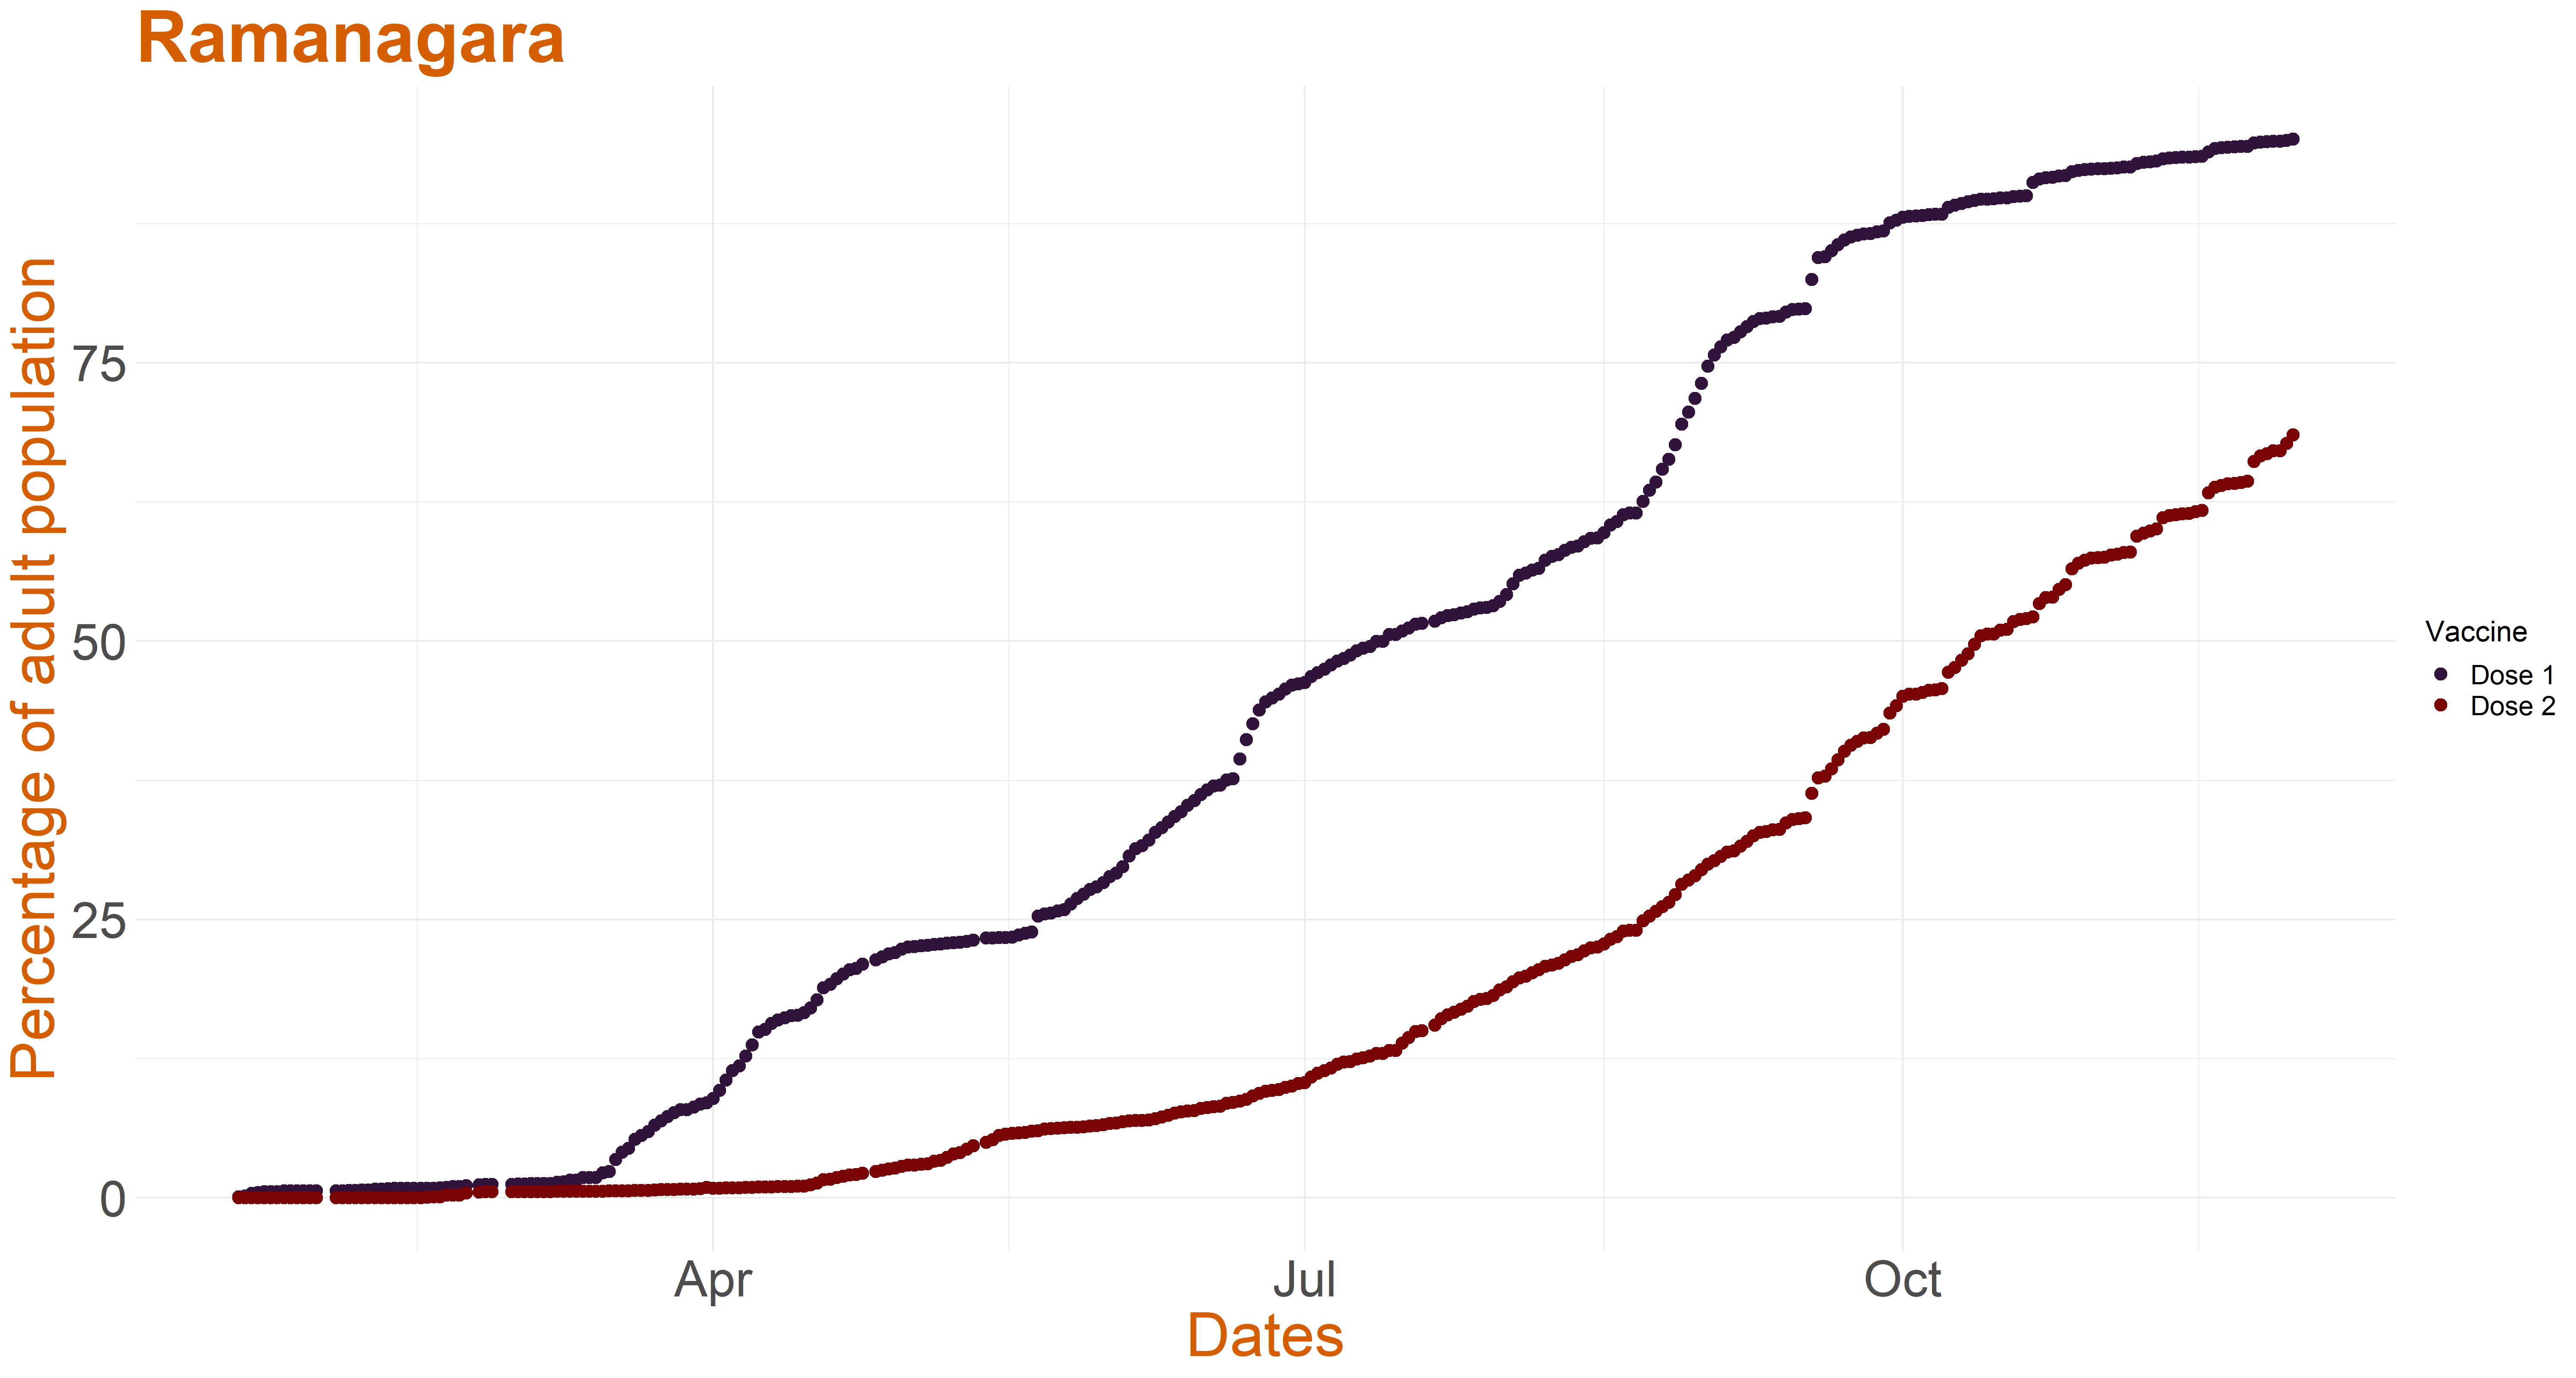
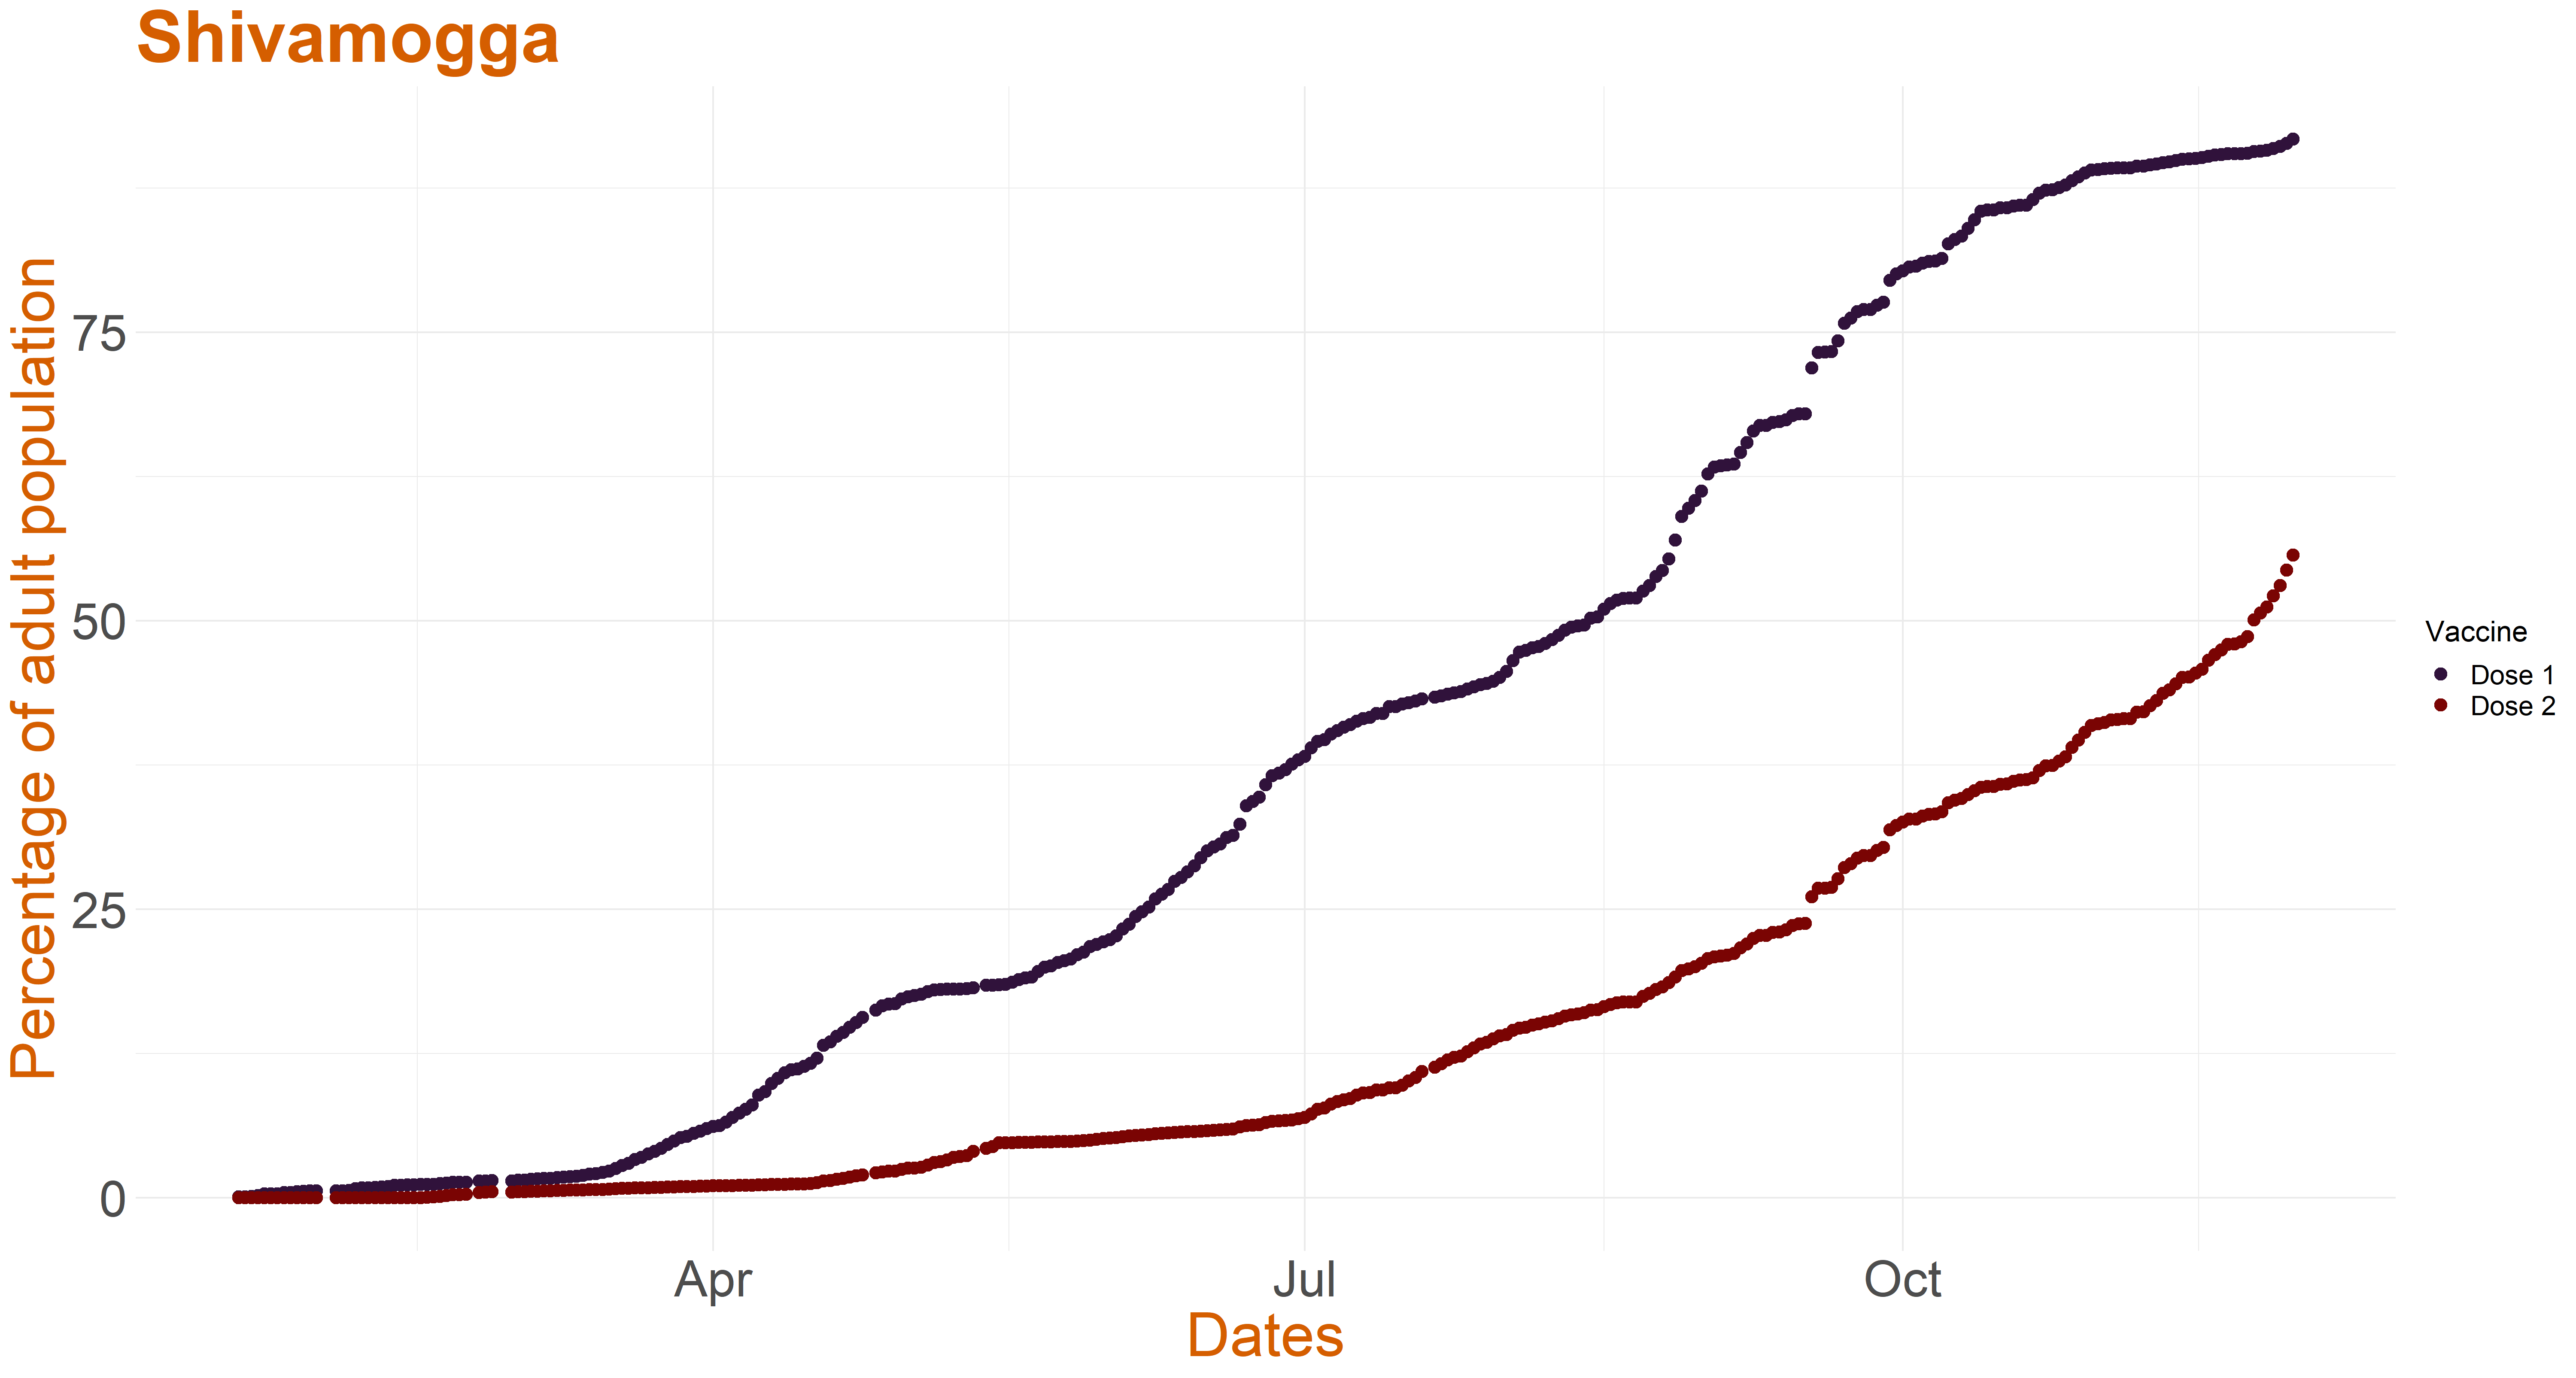
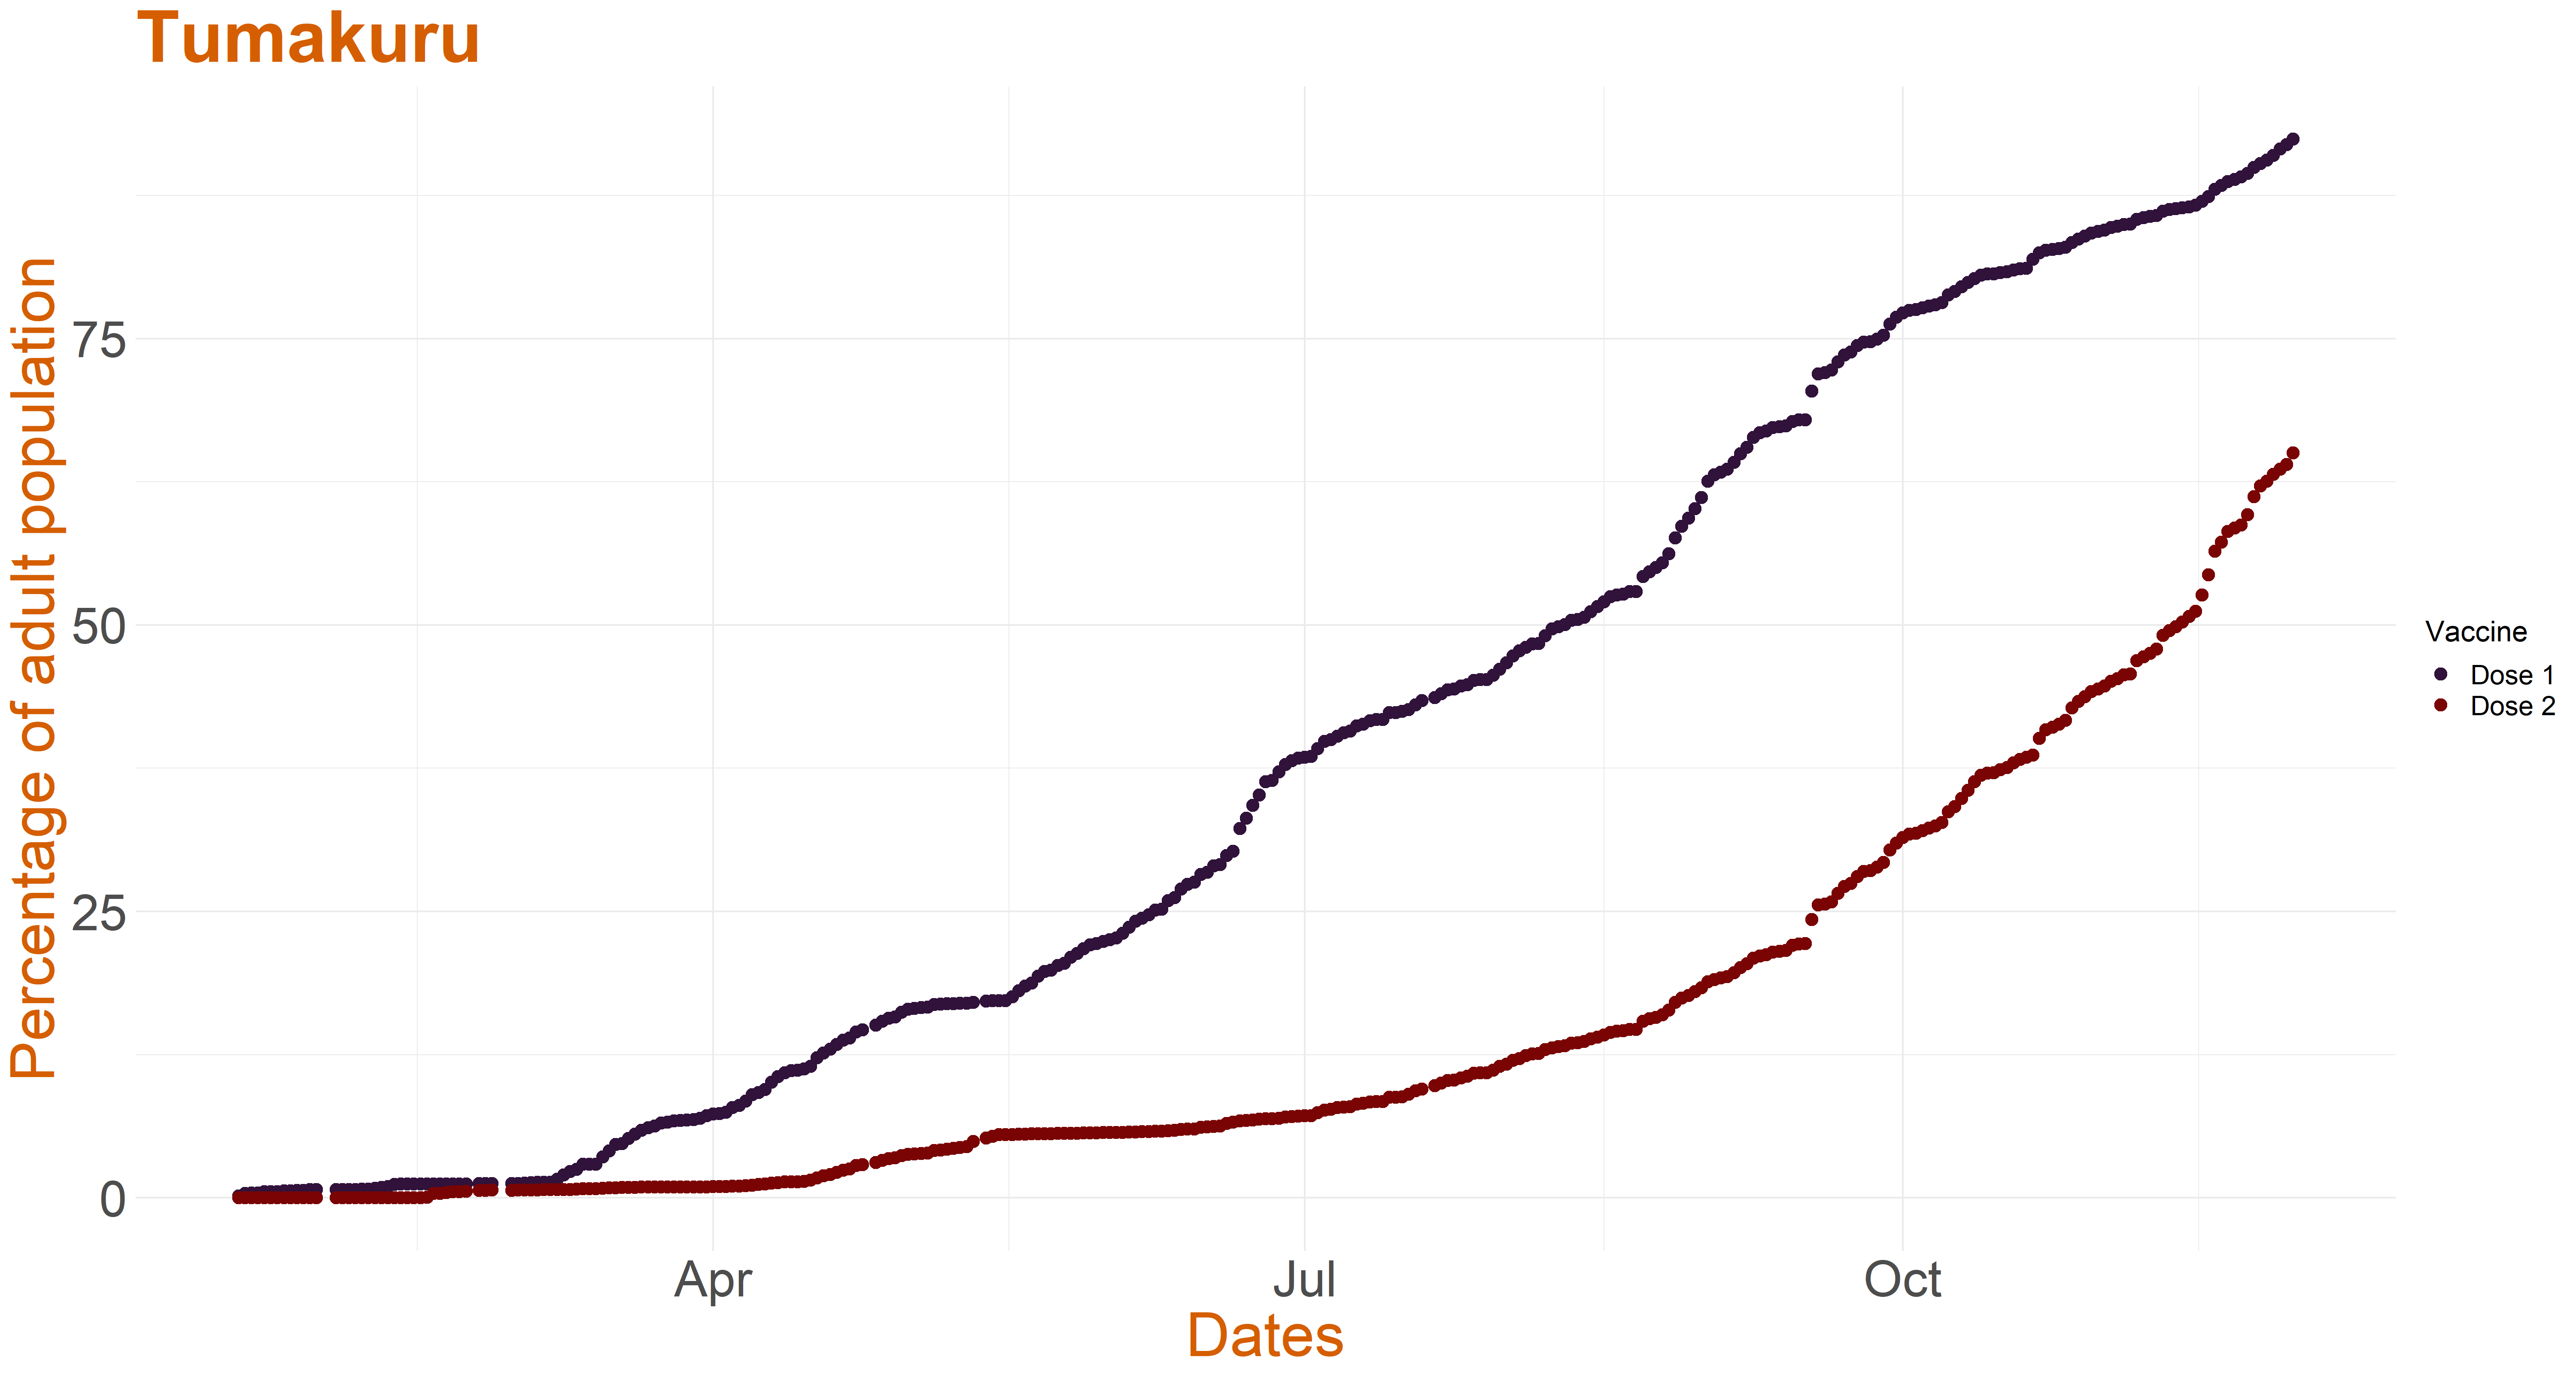
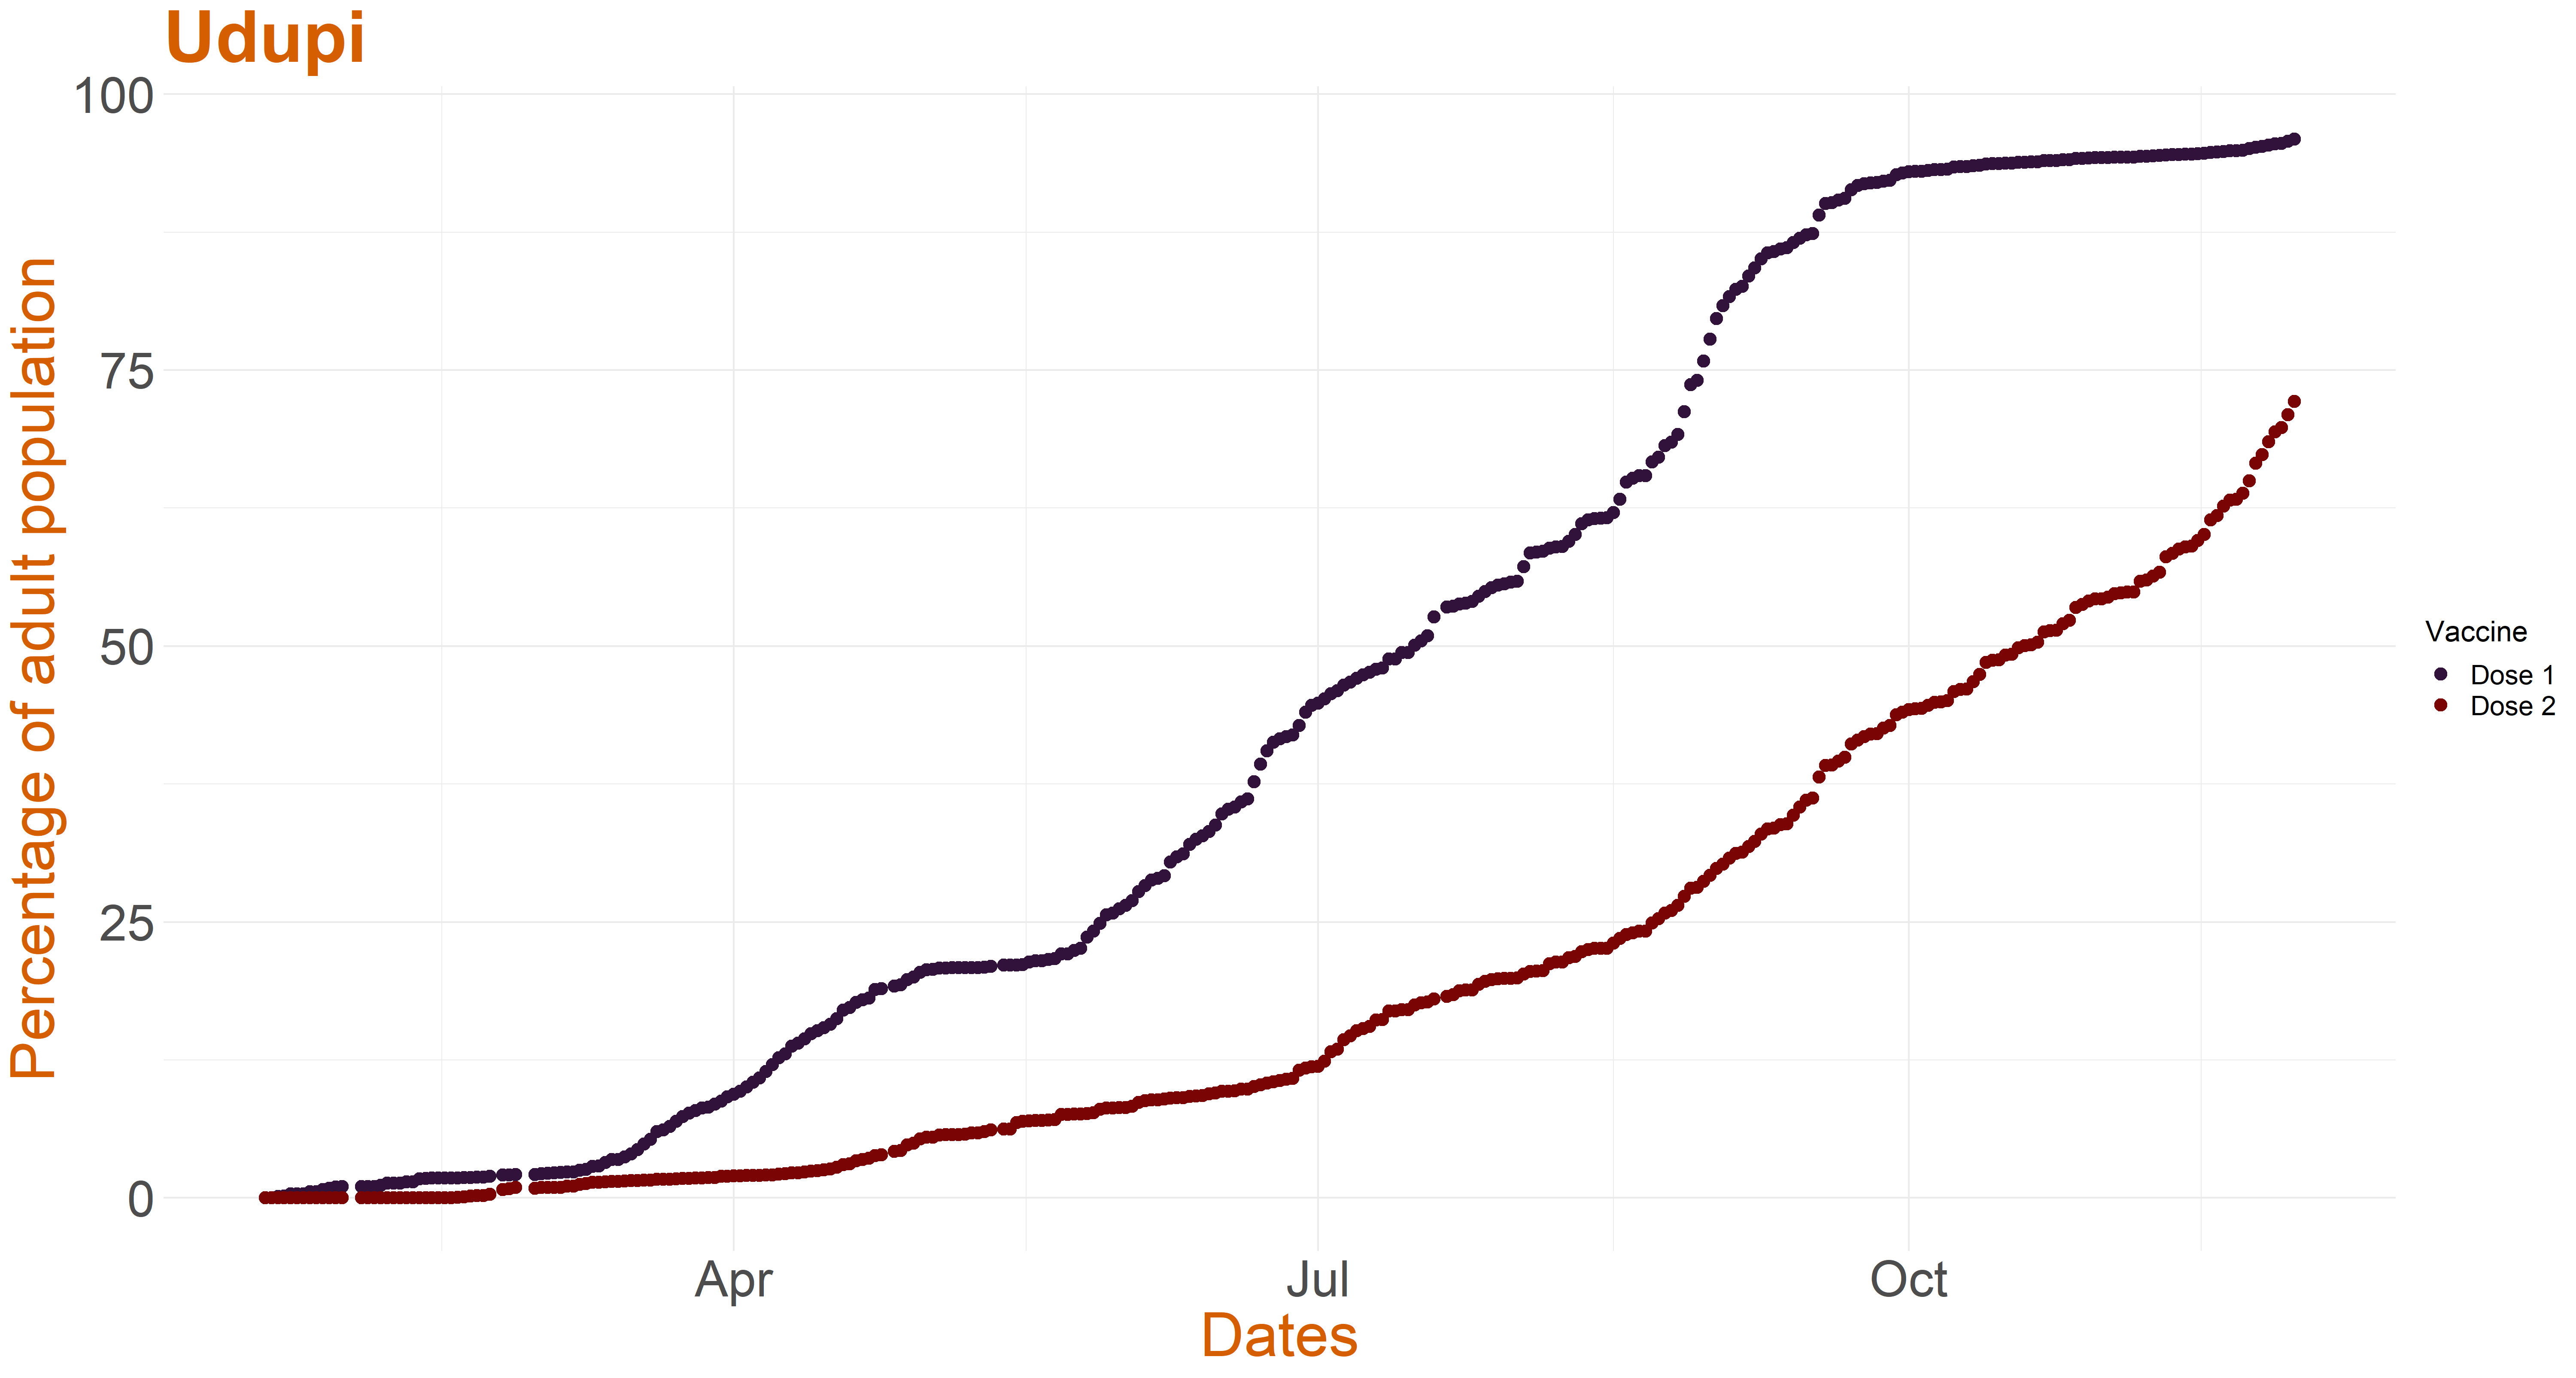
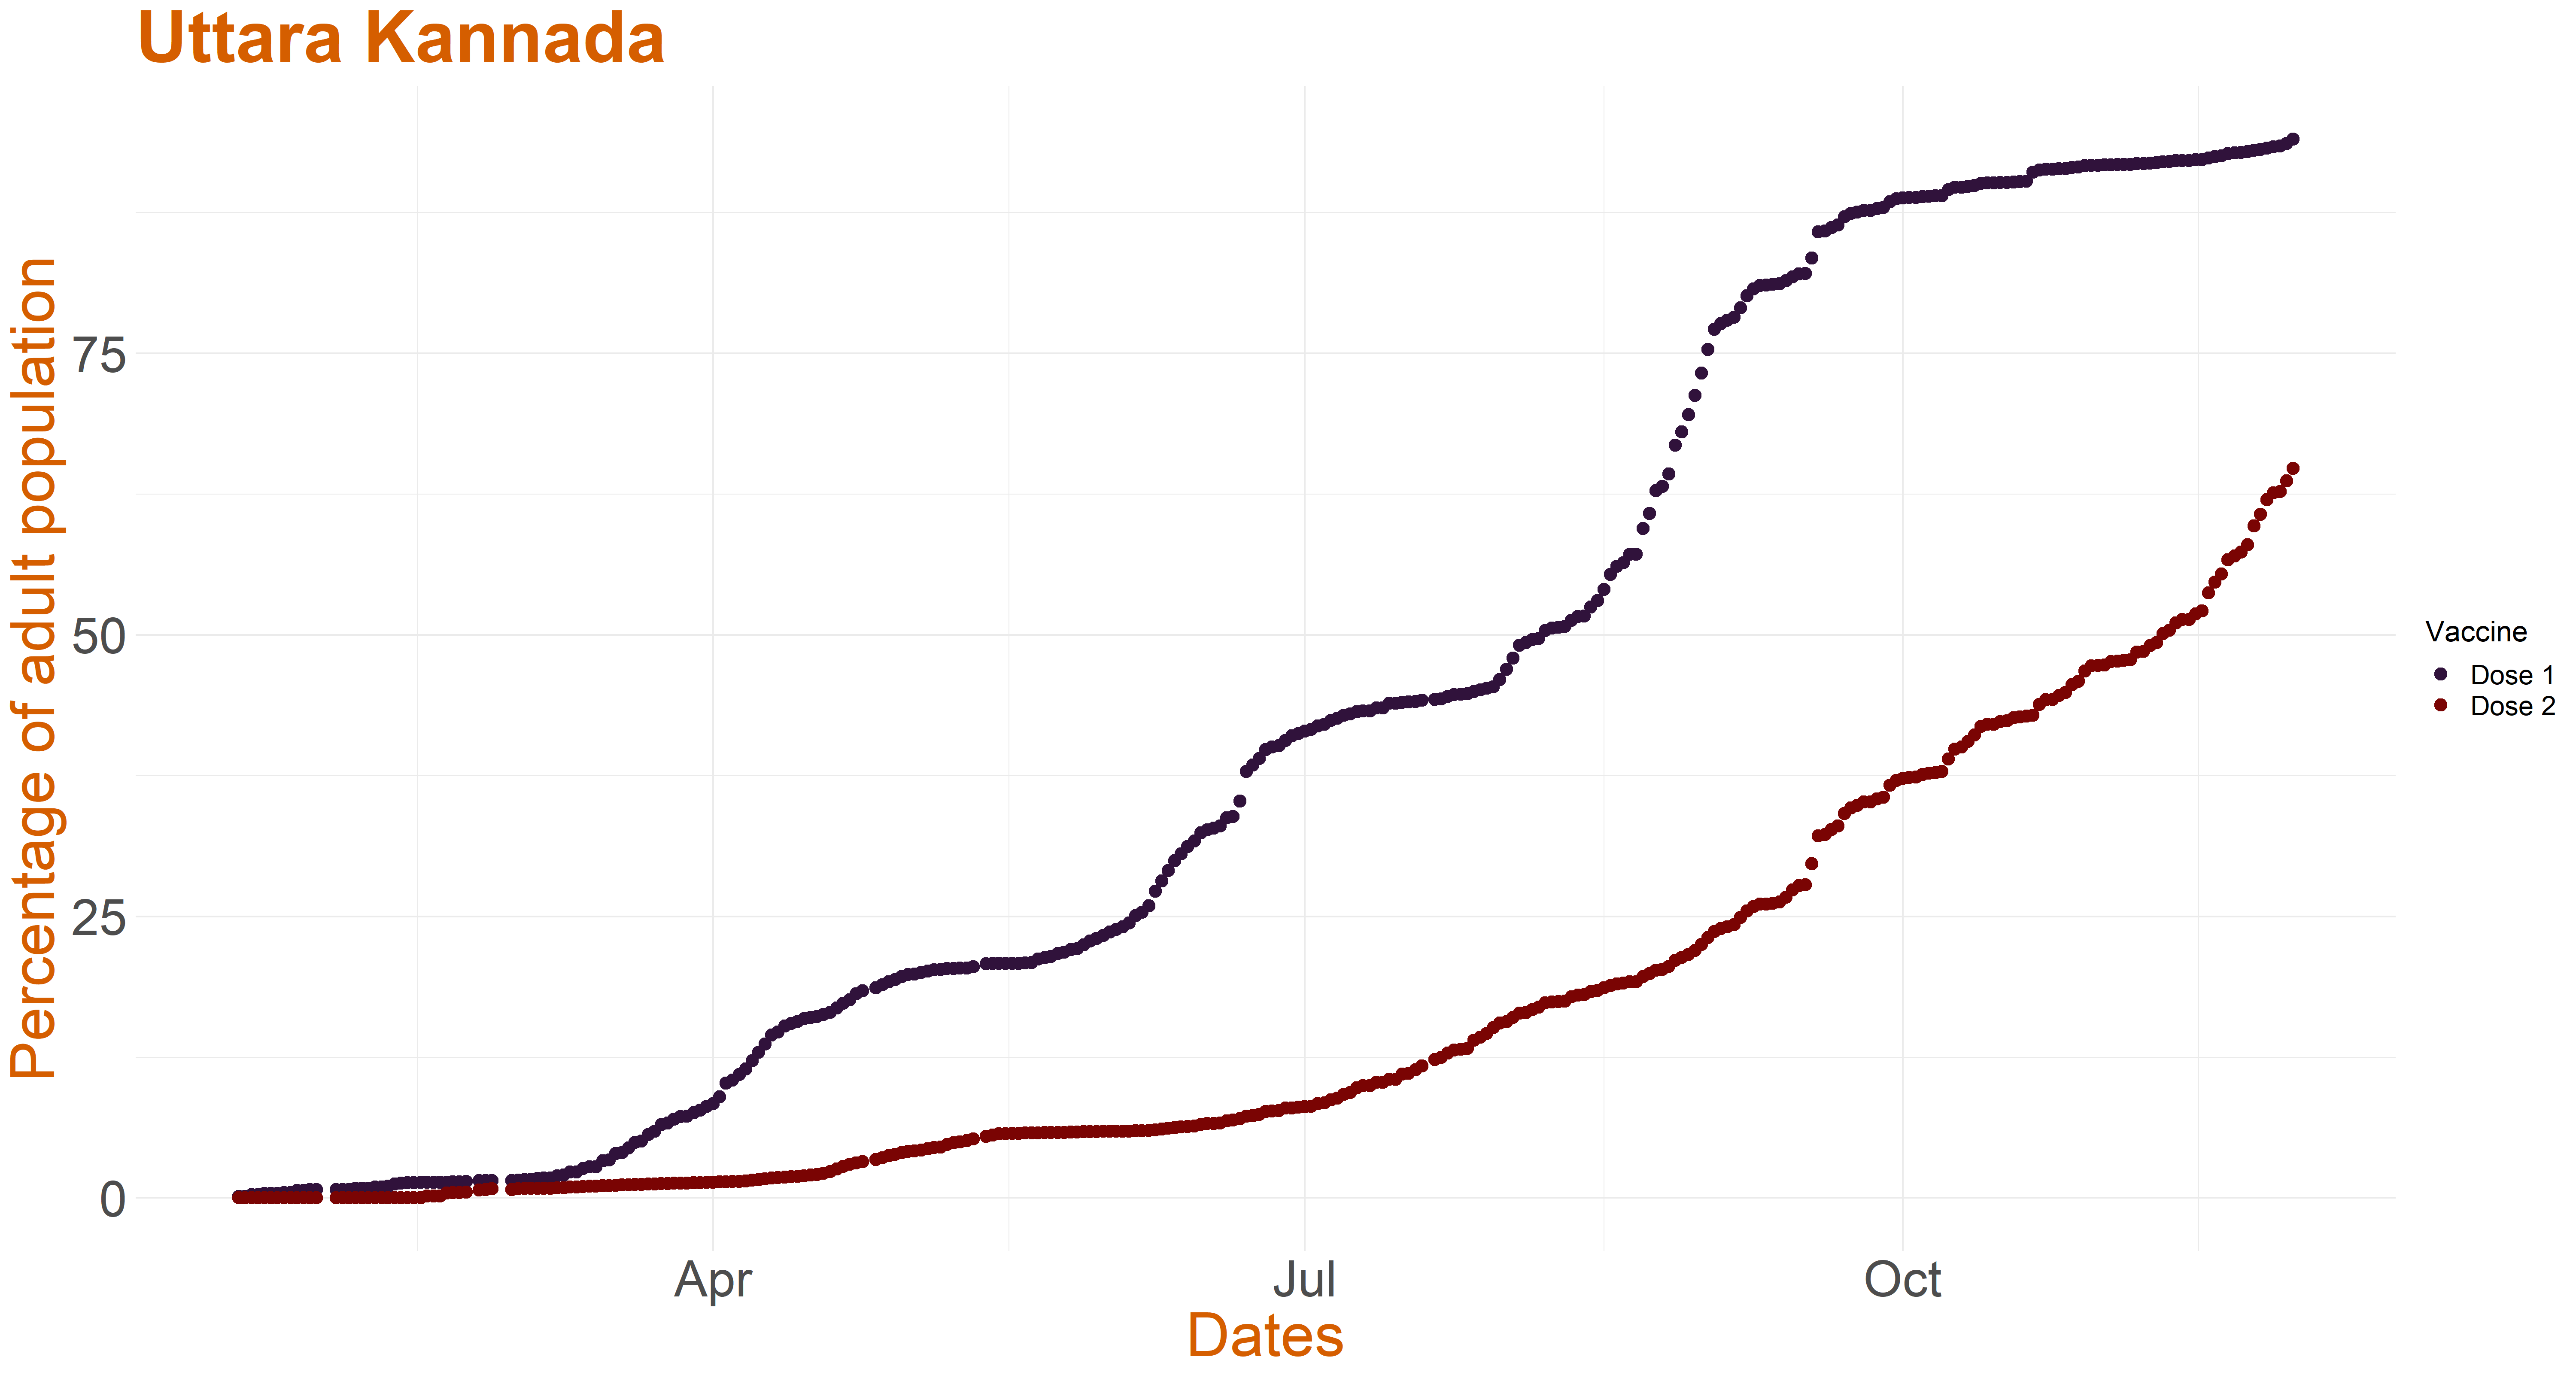
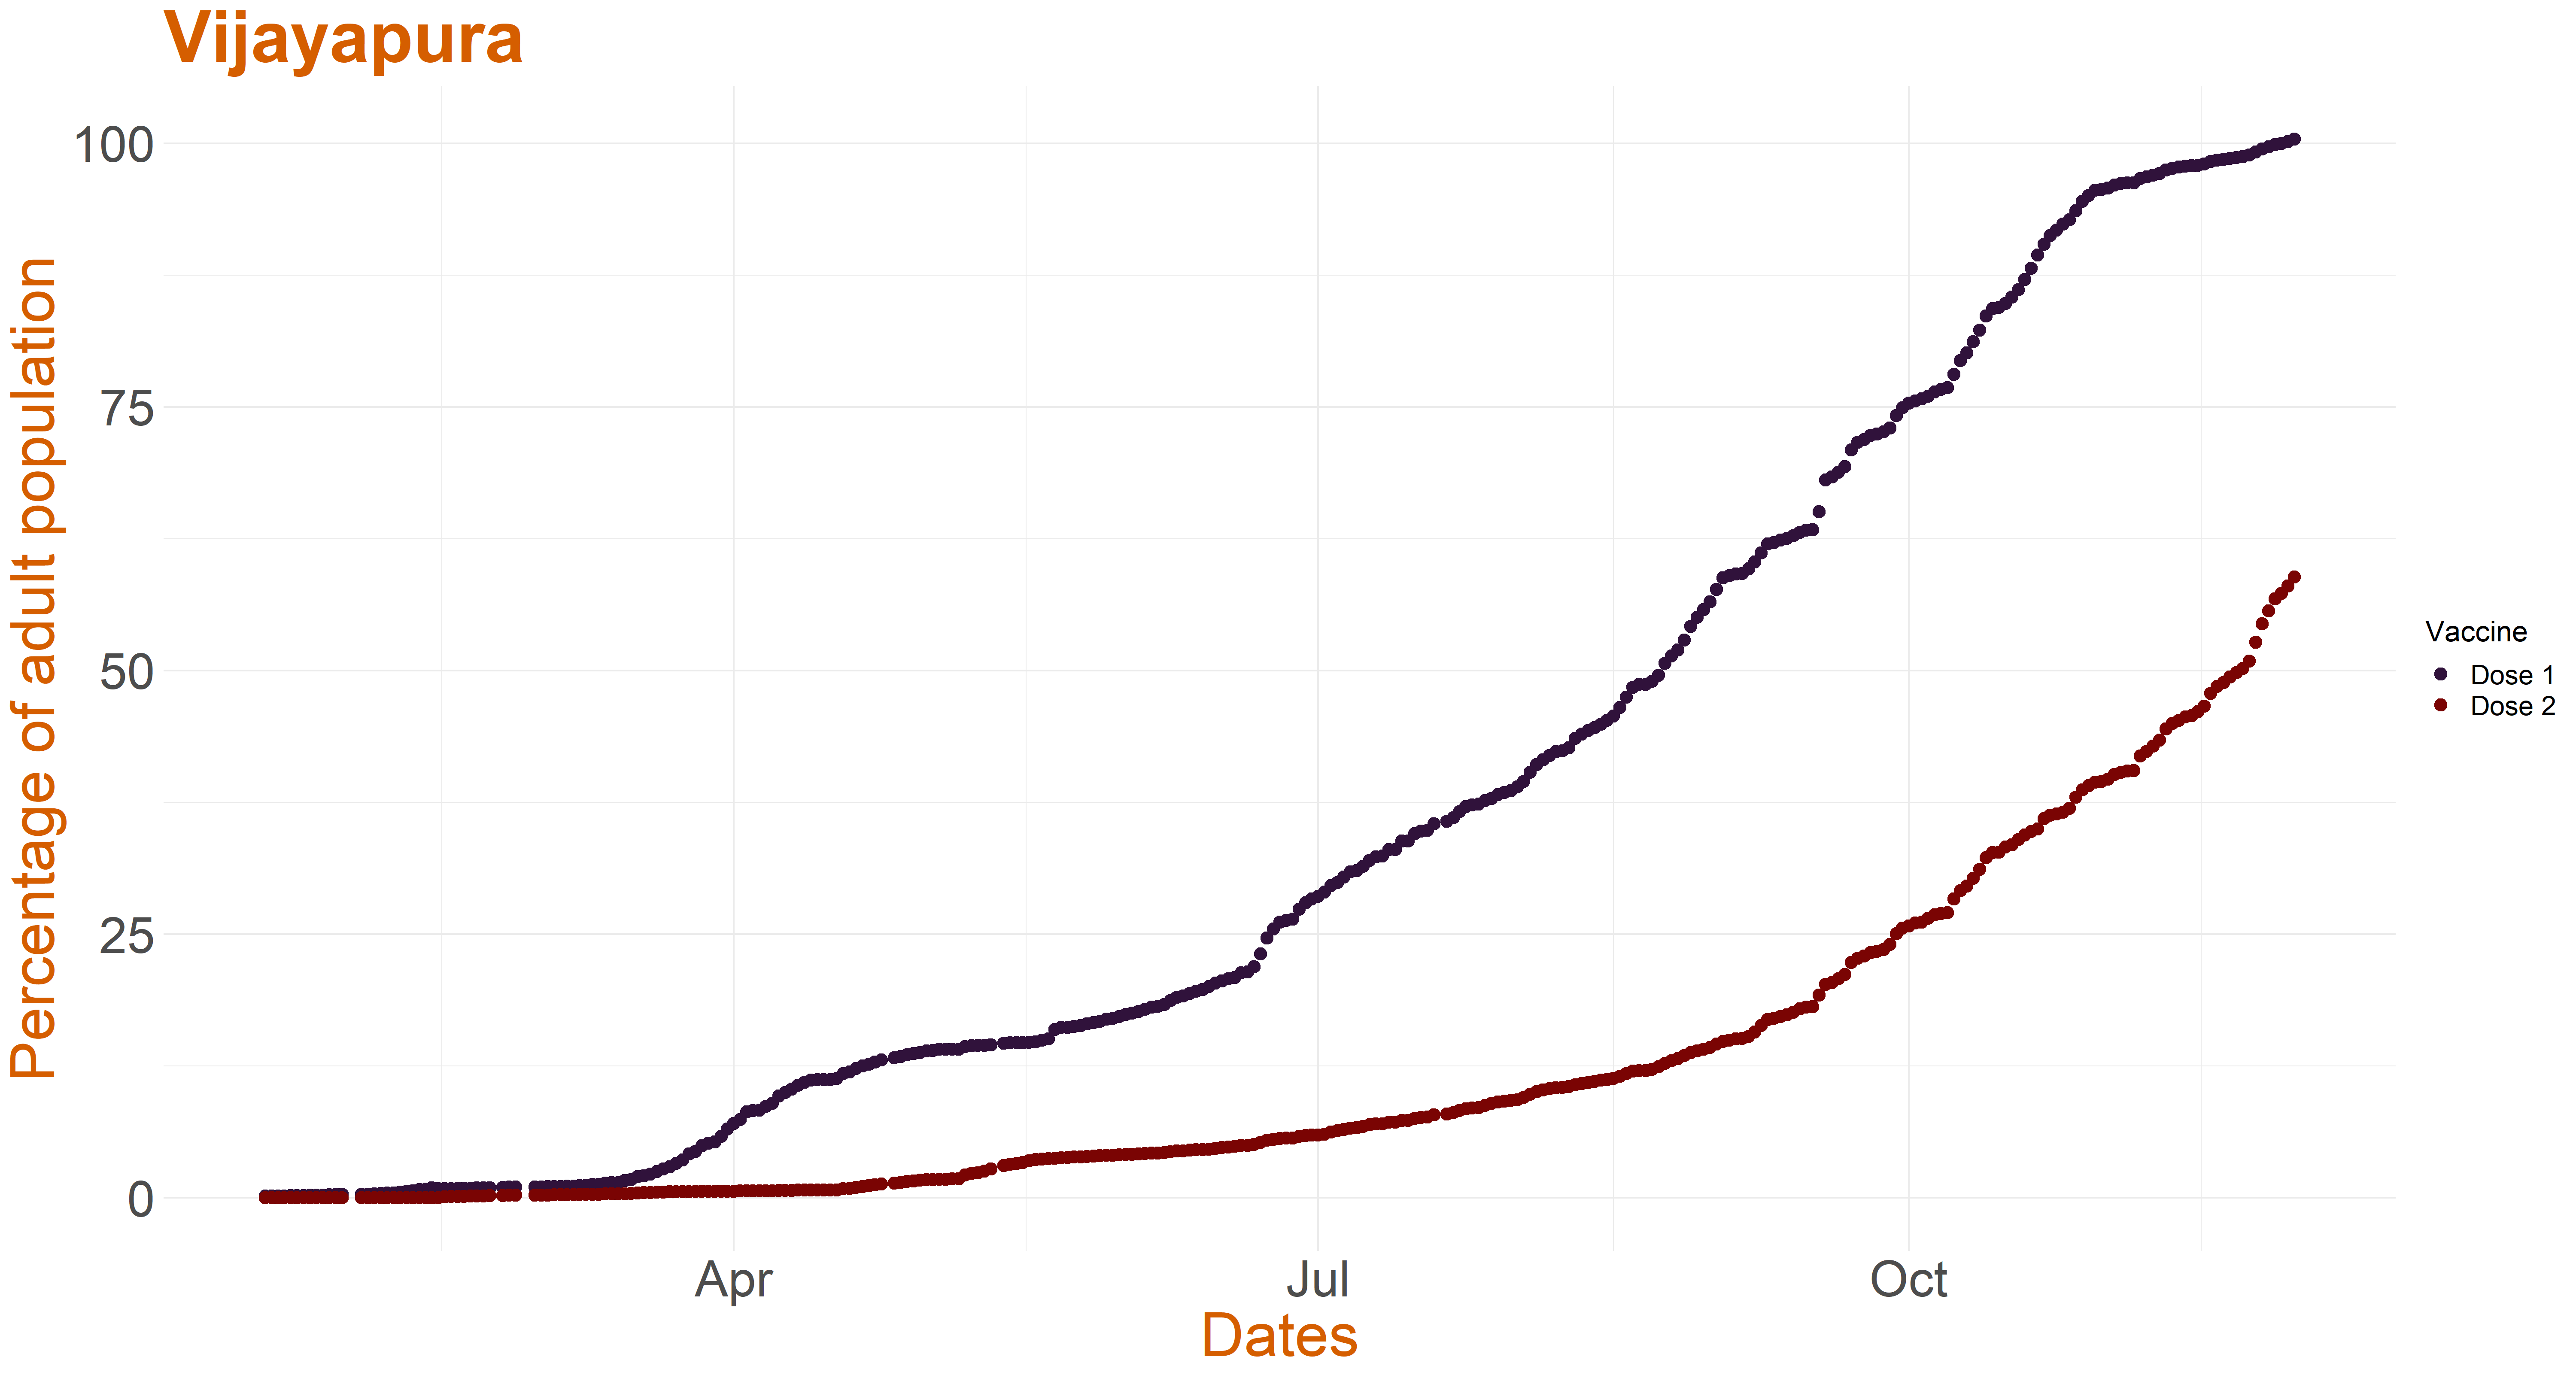
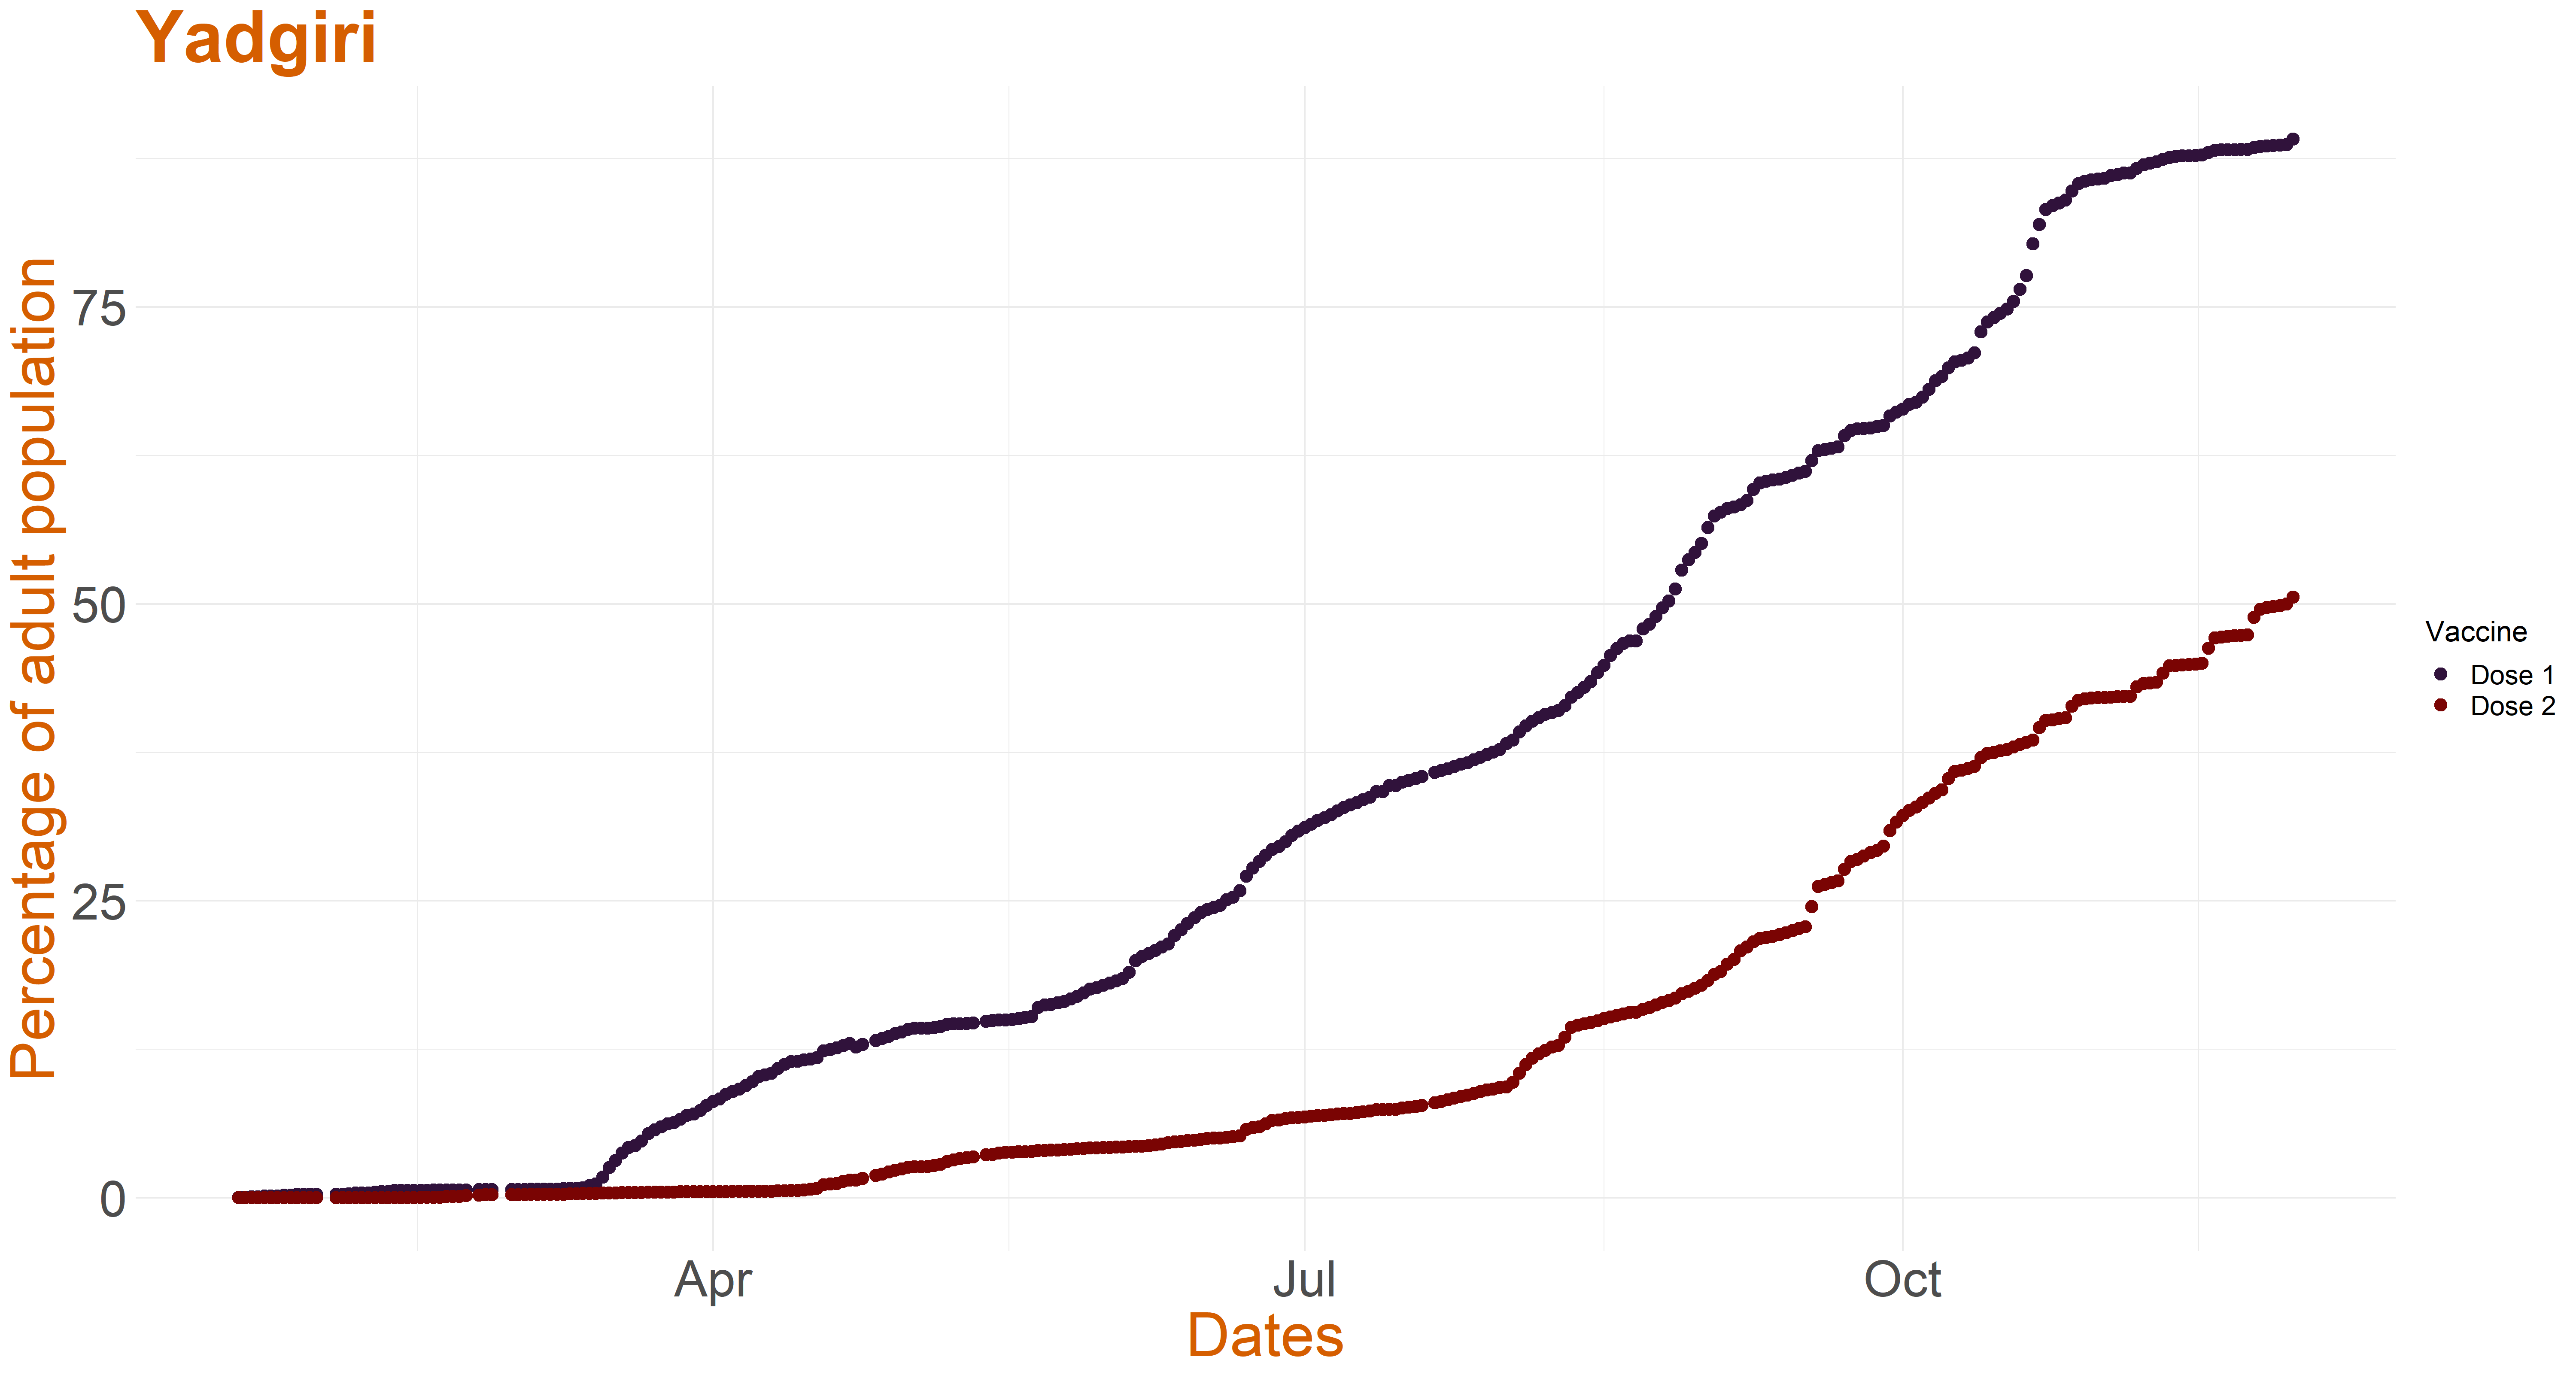
All the graphs below provide the cumulative dose 1 and dose 2 vaccination percentage for each district. The dose 1 and 2 counts of BBMP district, if present, were added to Bengaluru Urban.