COVID-19 India-Timeline an understanding across States and Union Territories
Hospitalisation Ratio for deceased patients across Districts
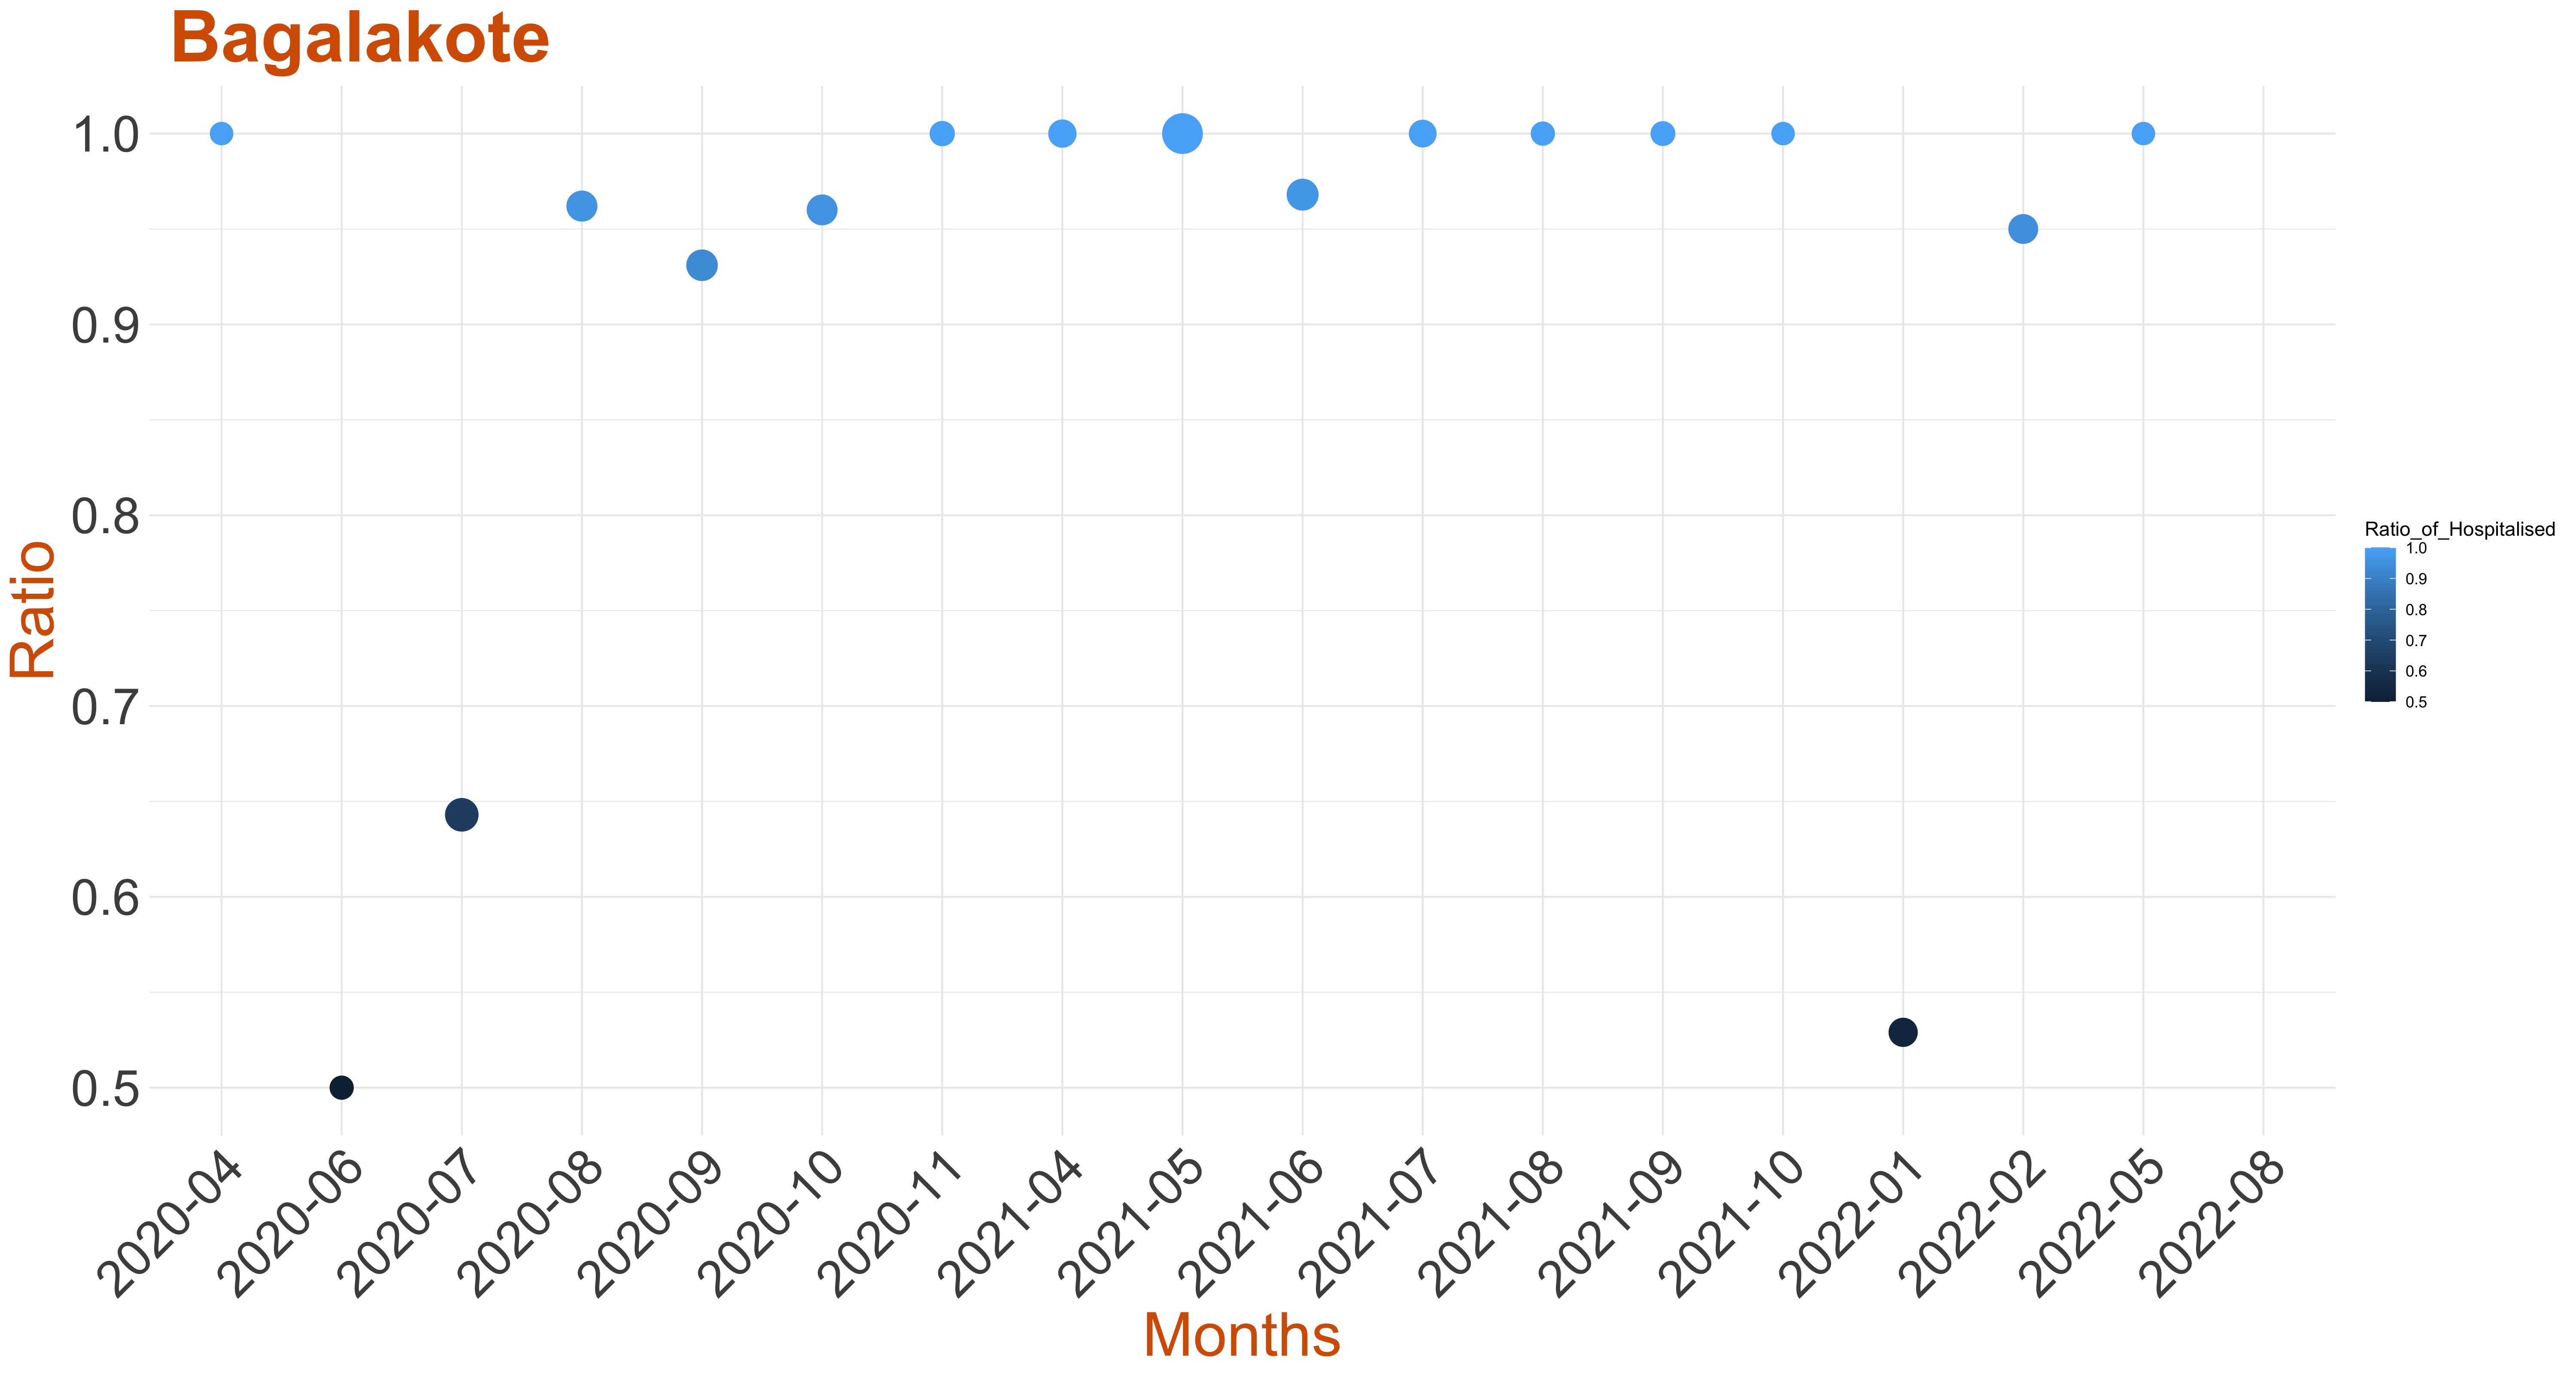
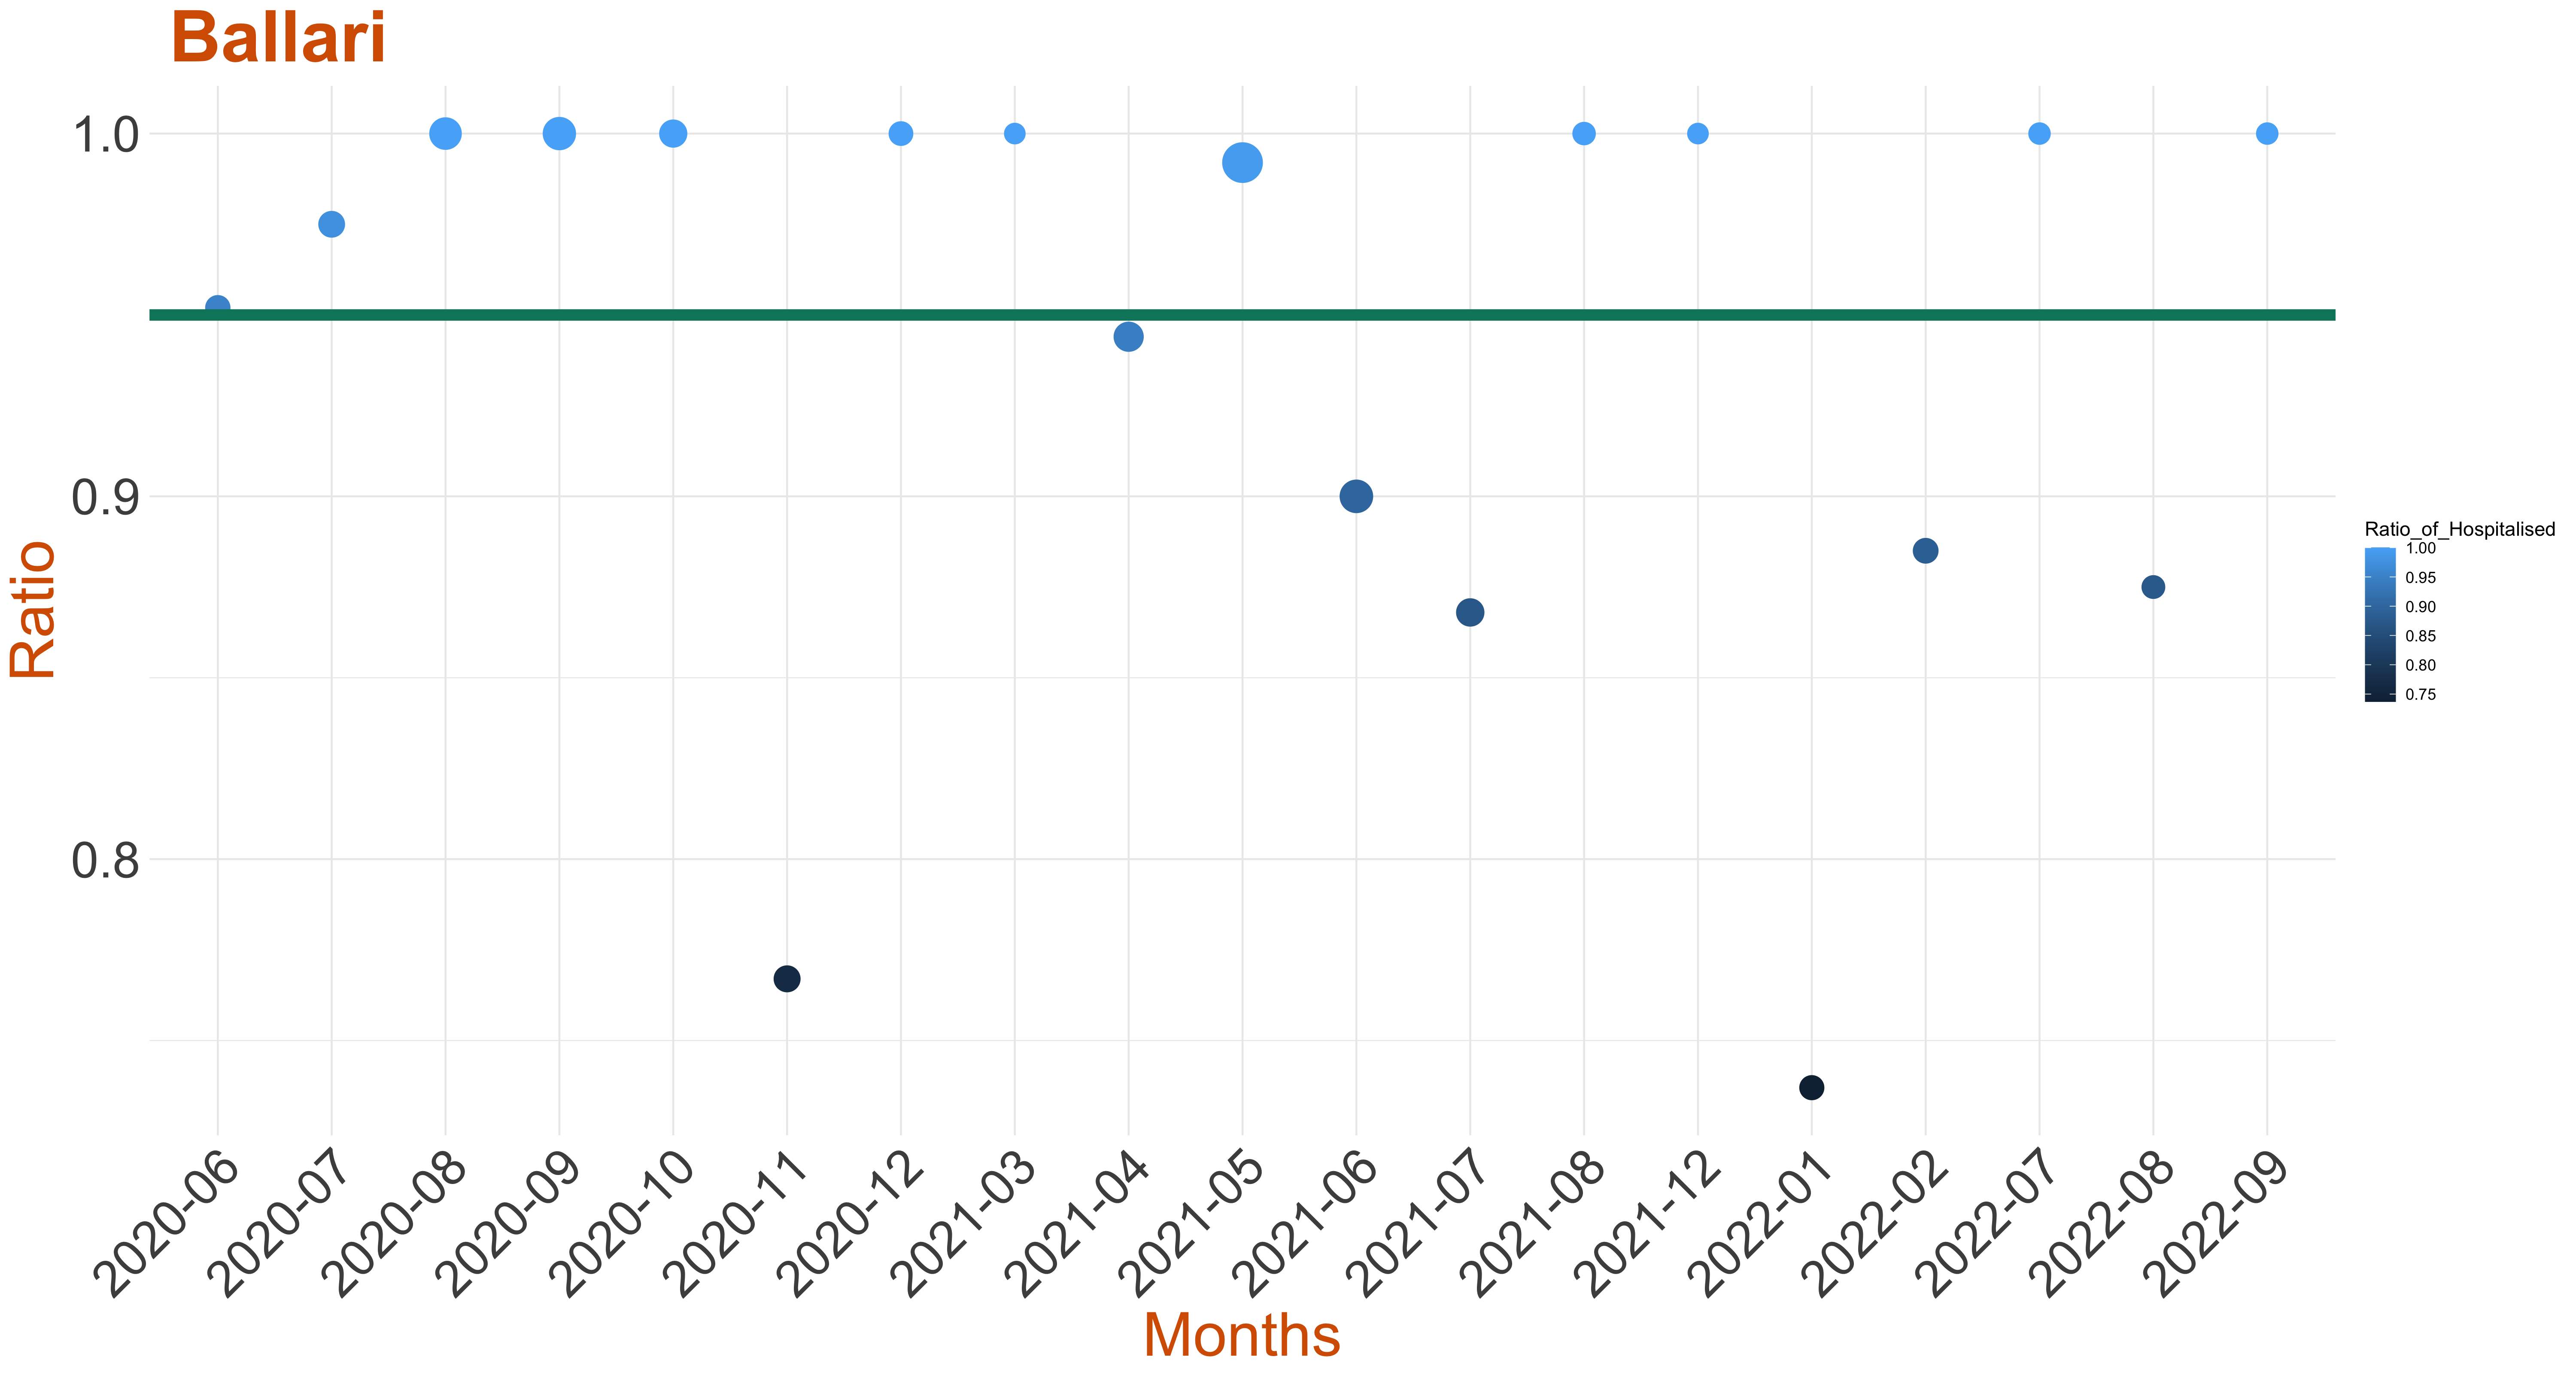
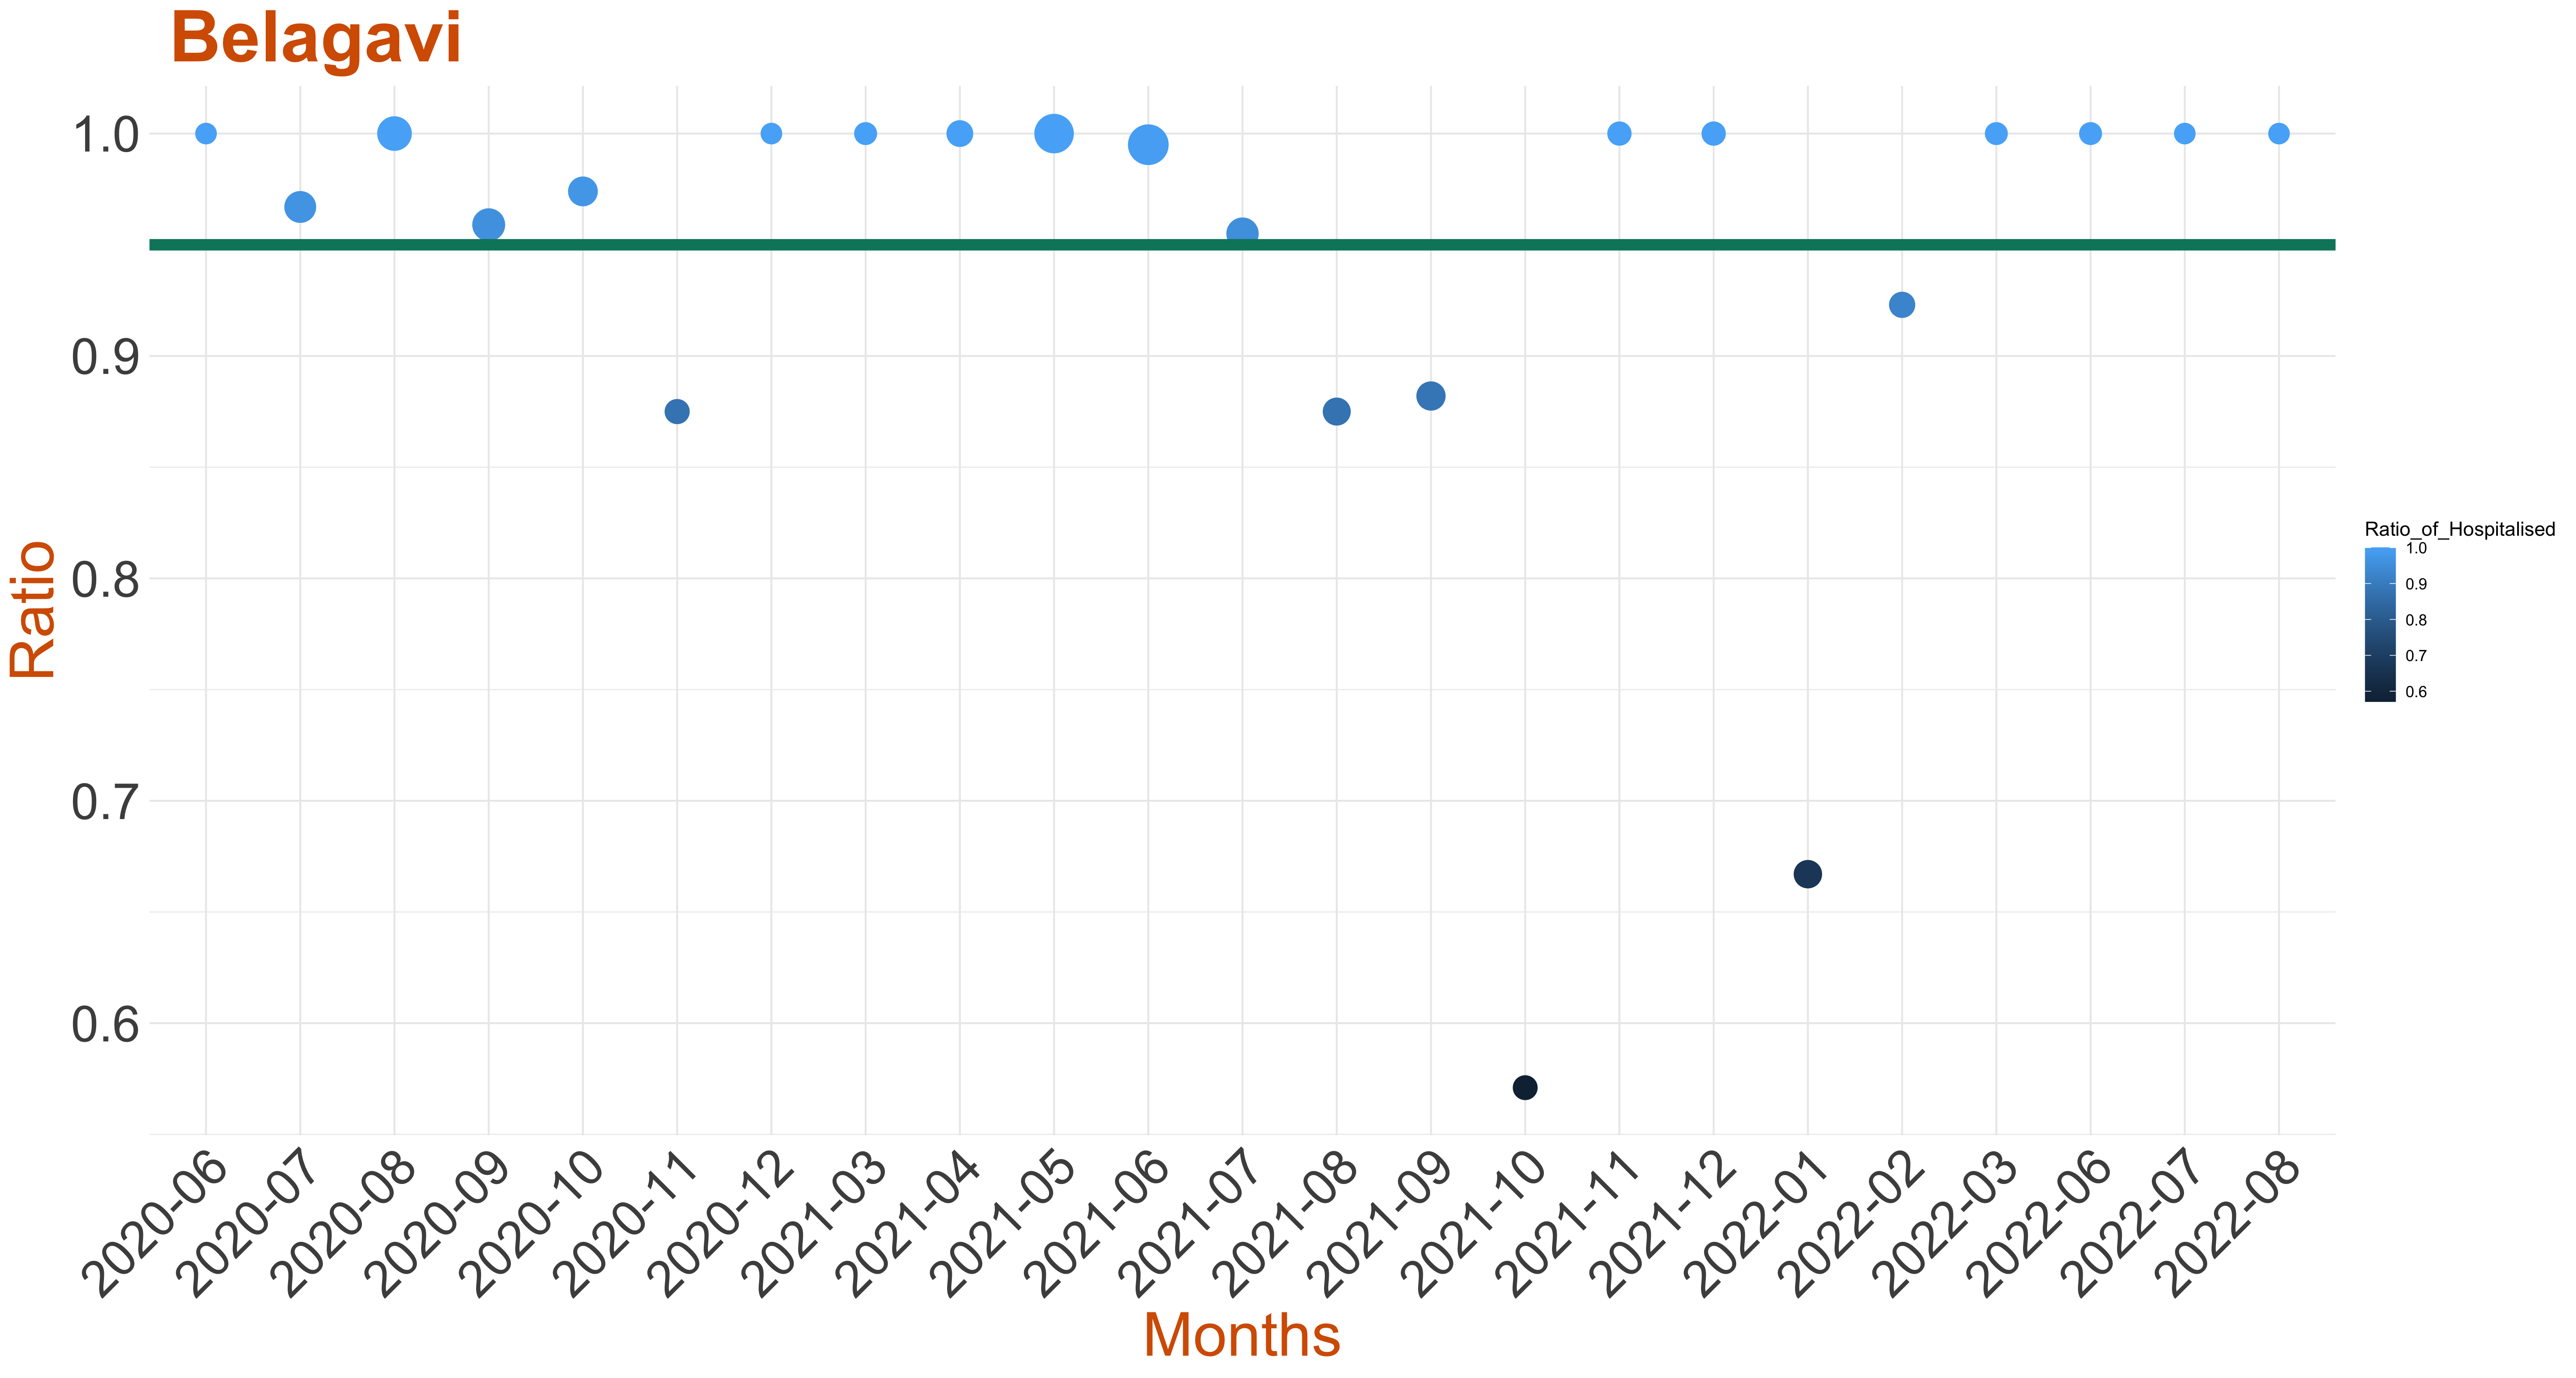
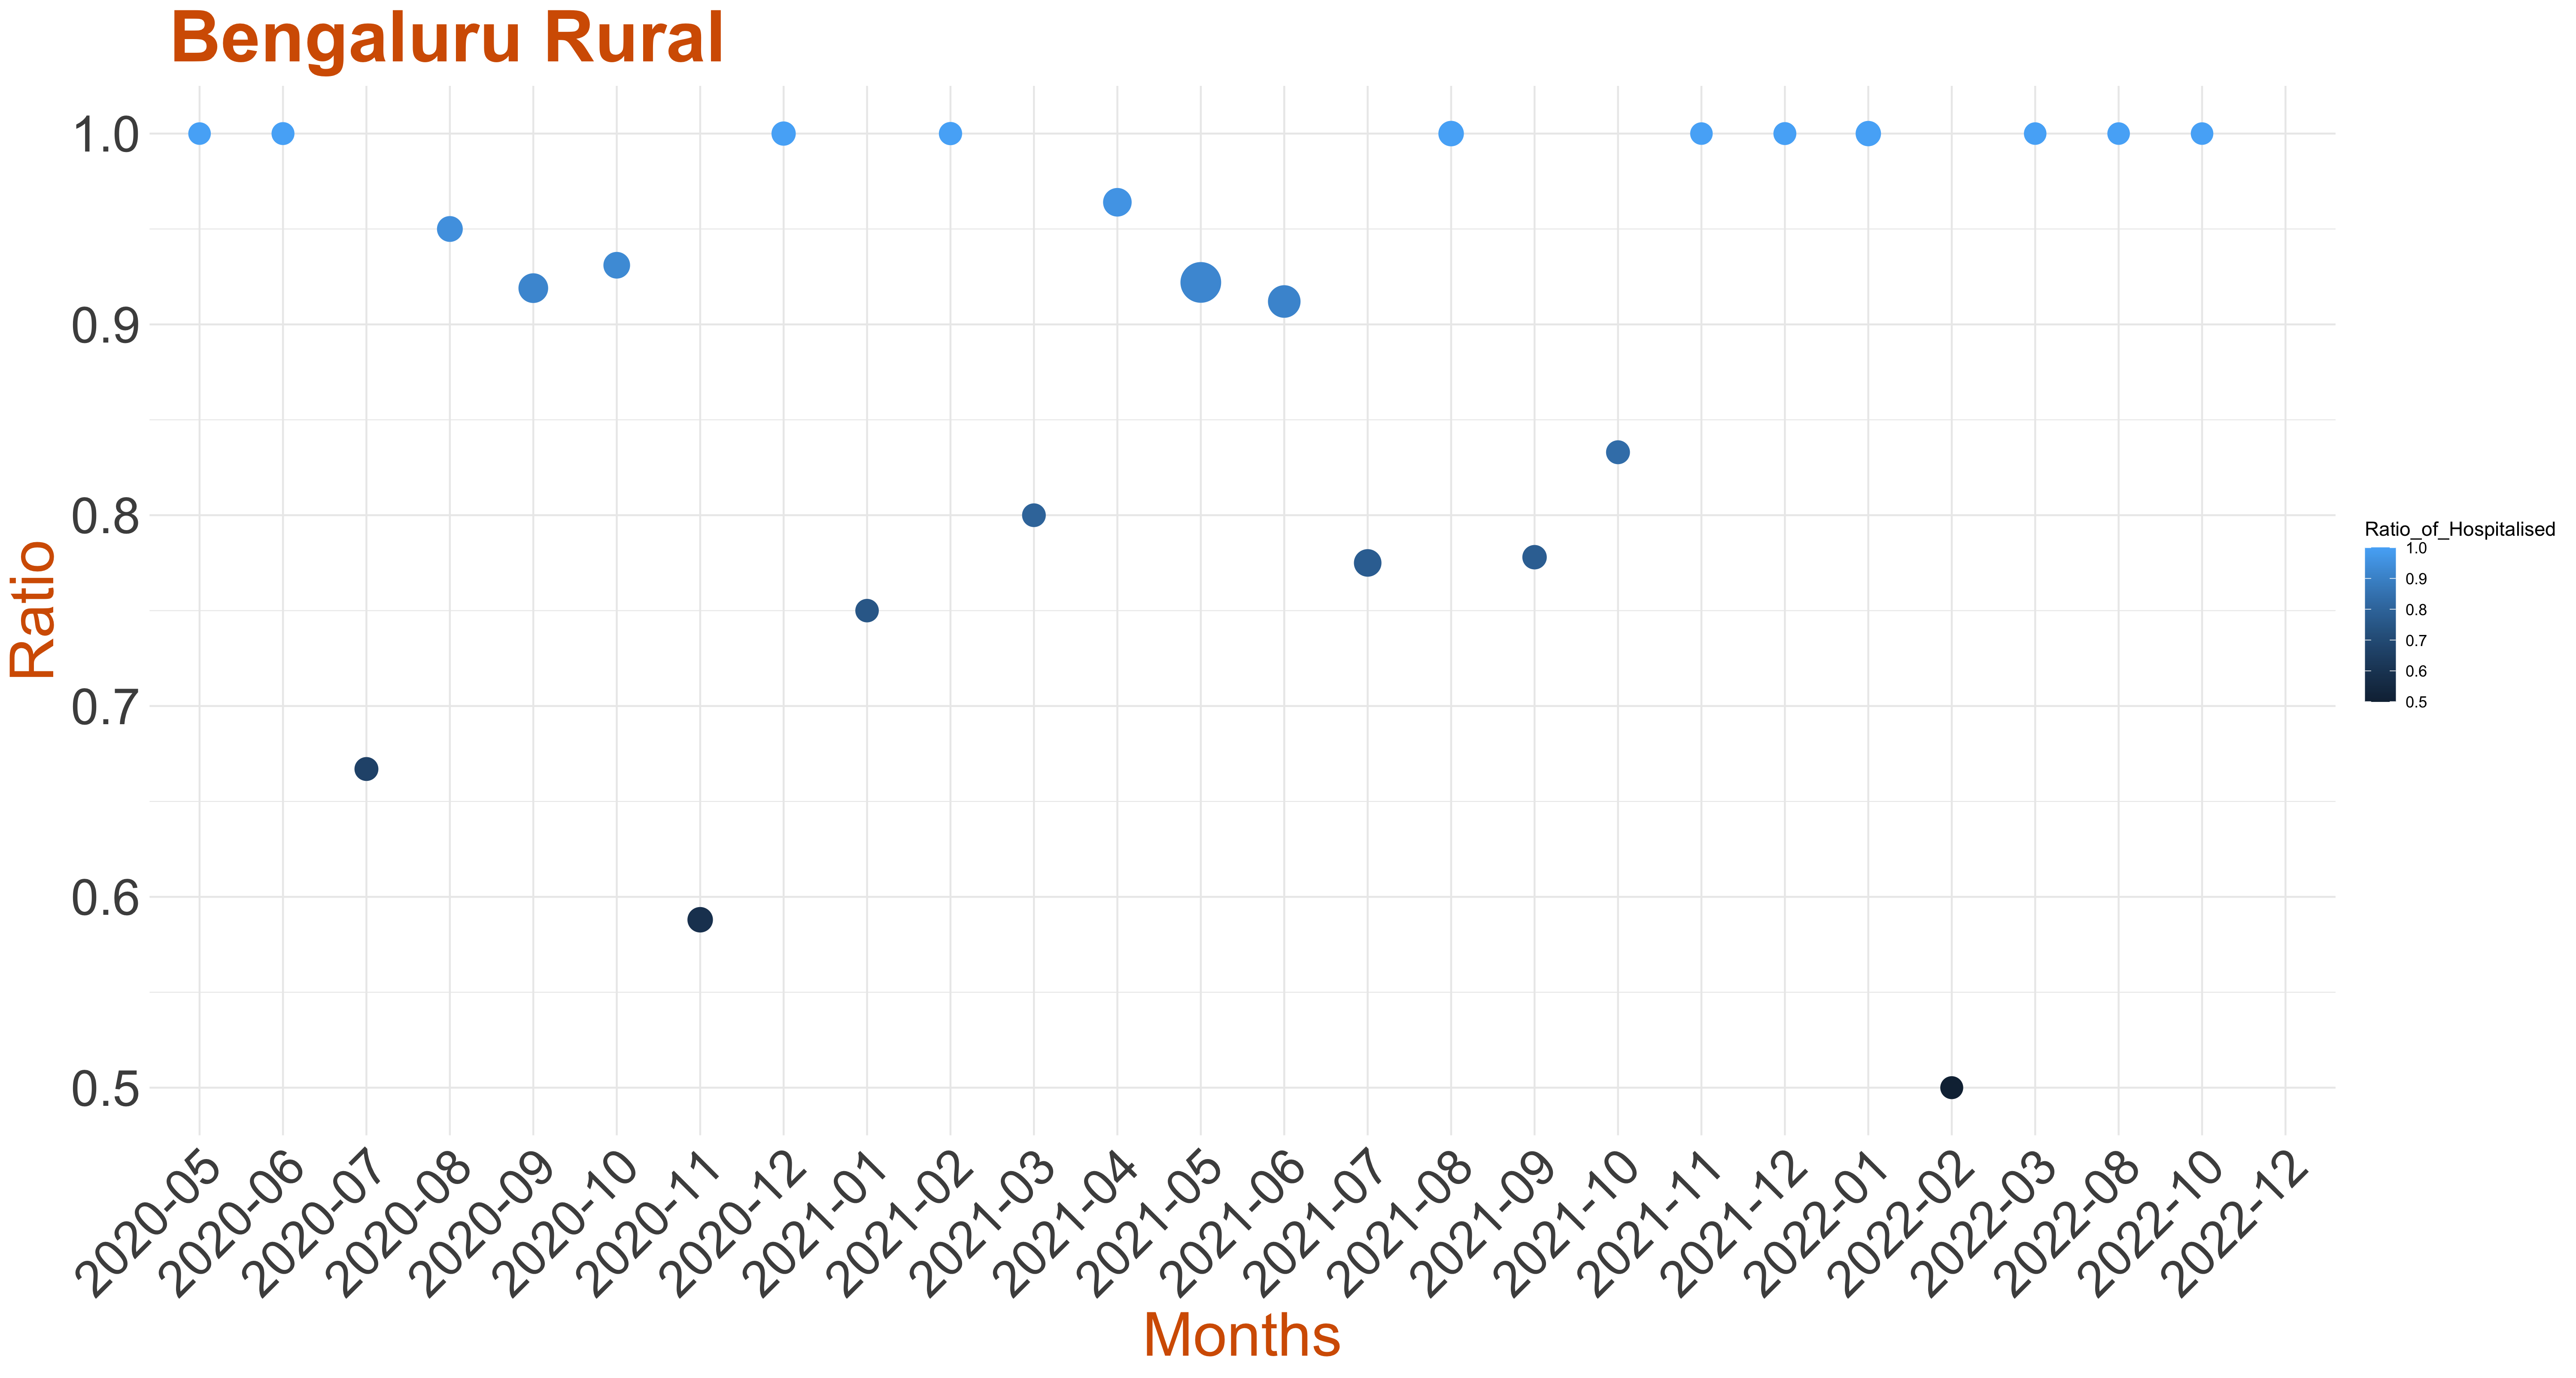
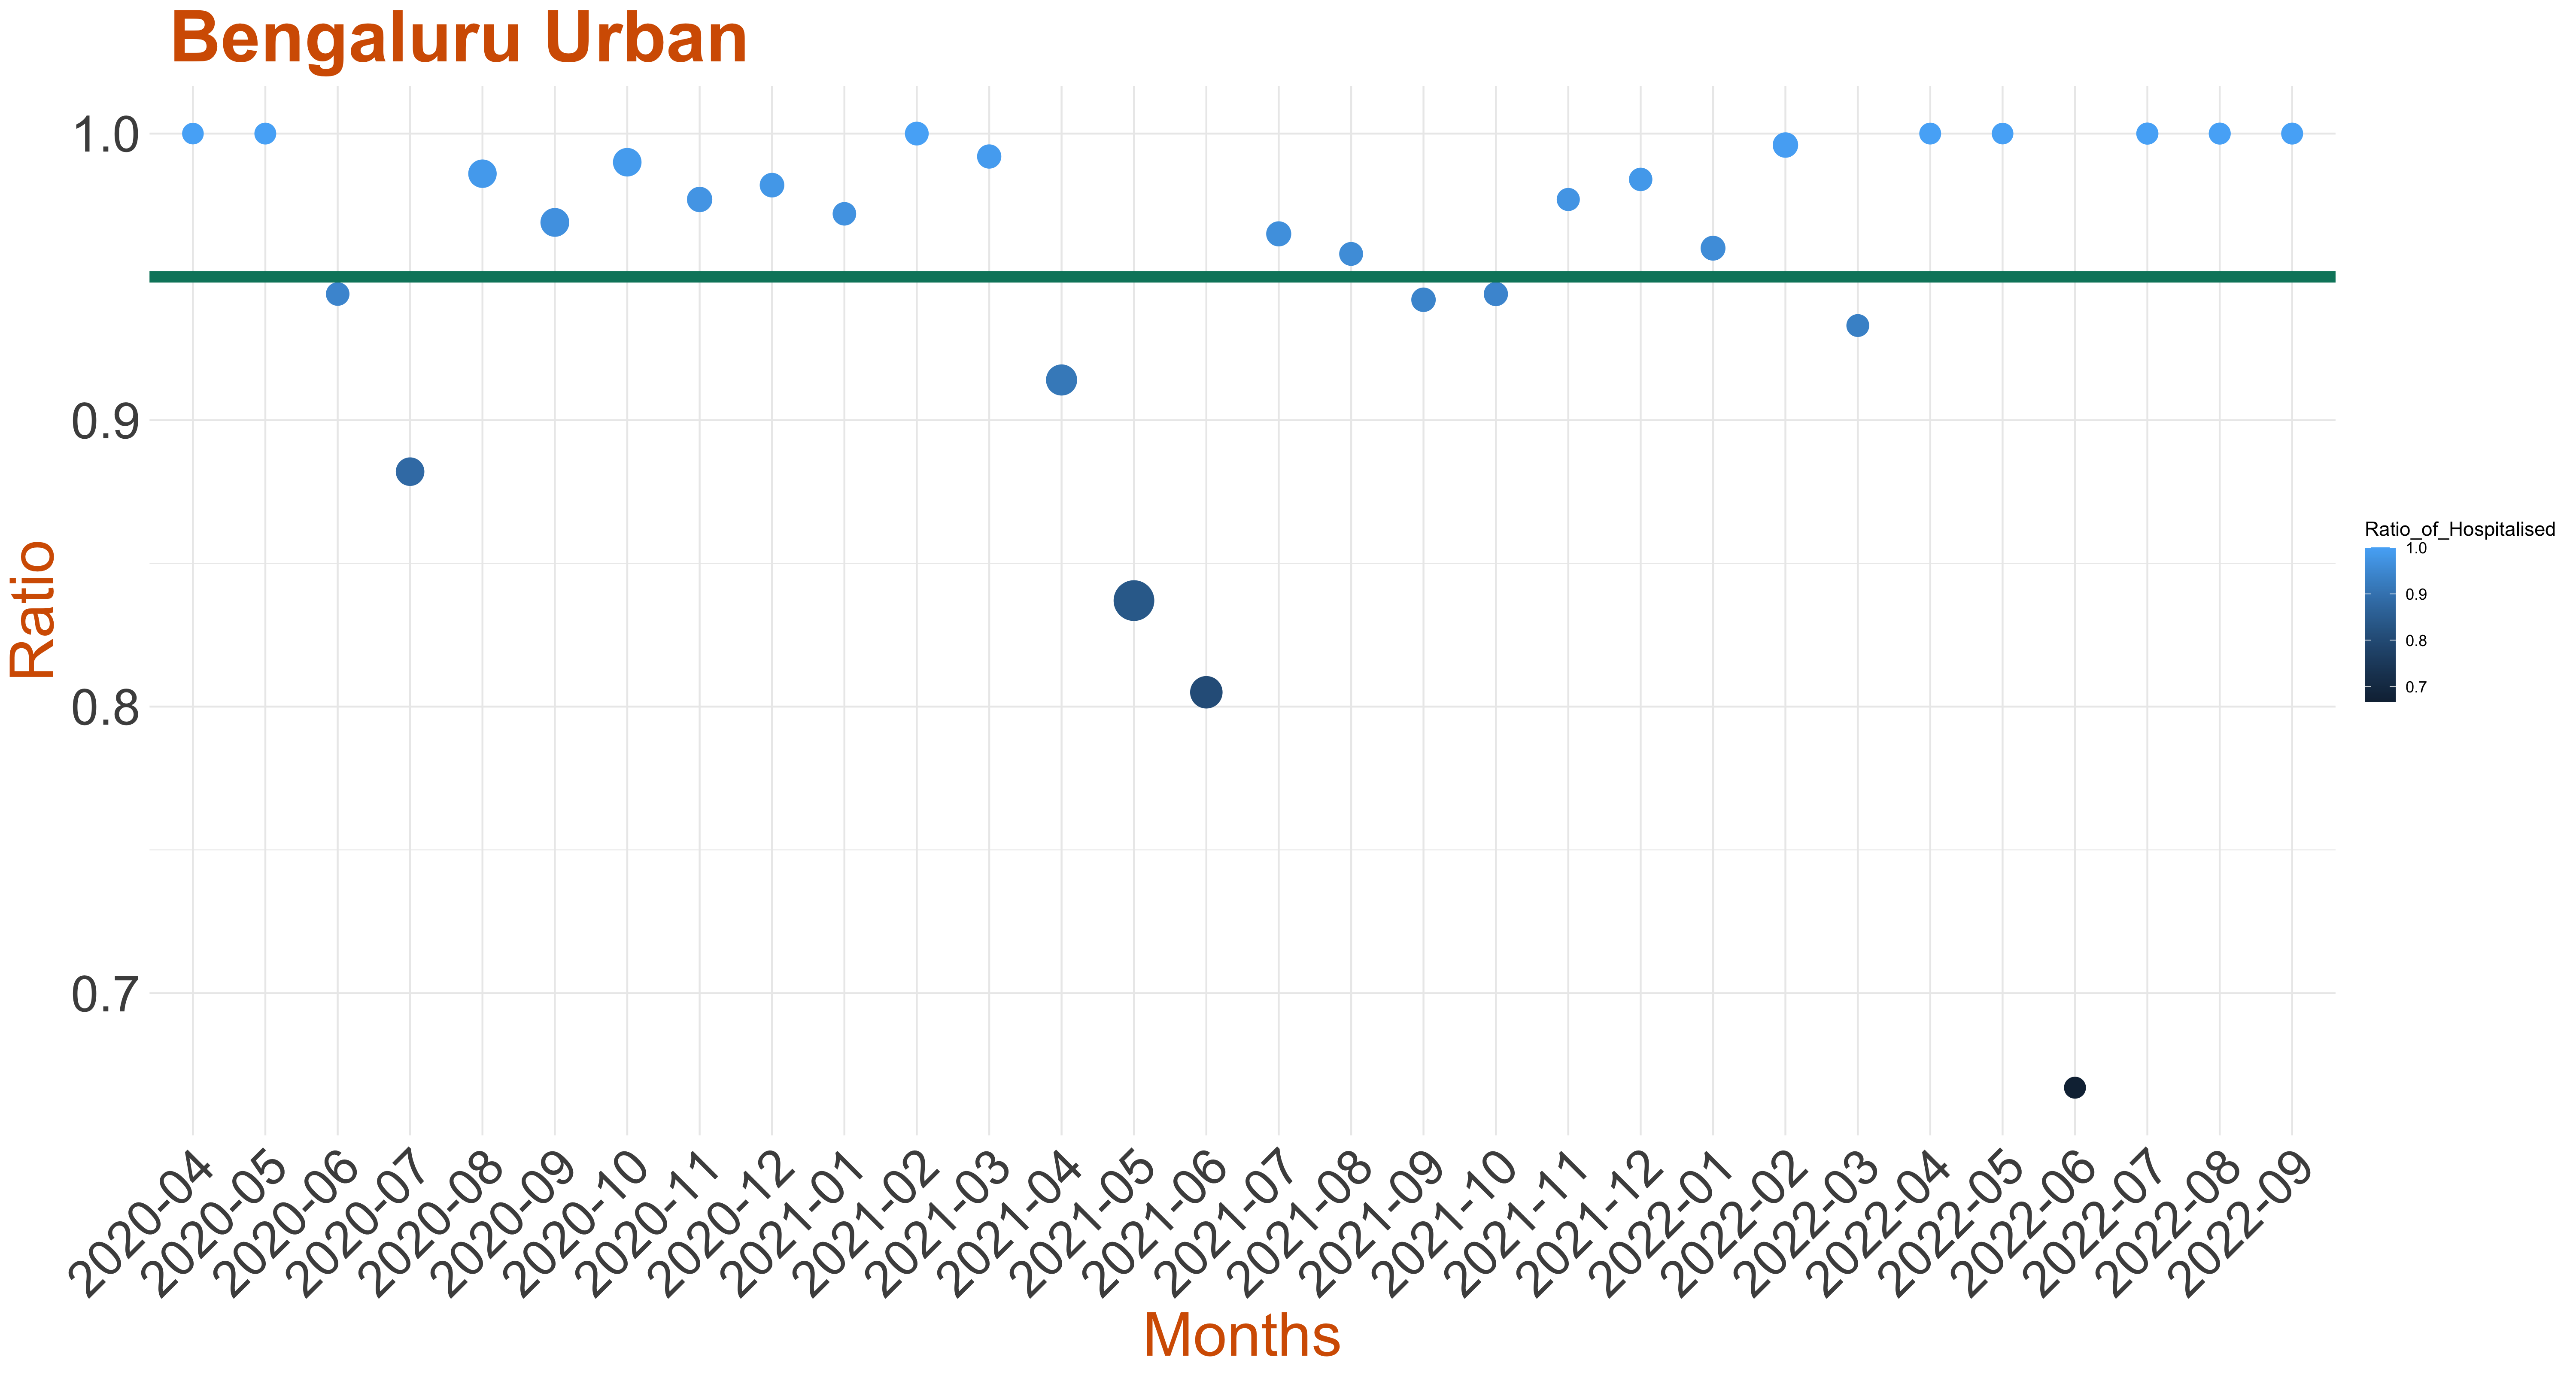
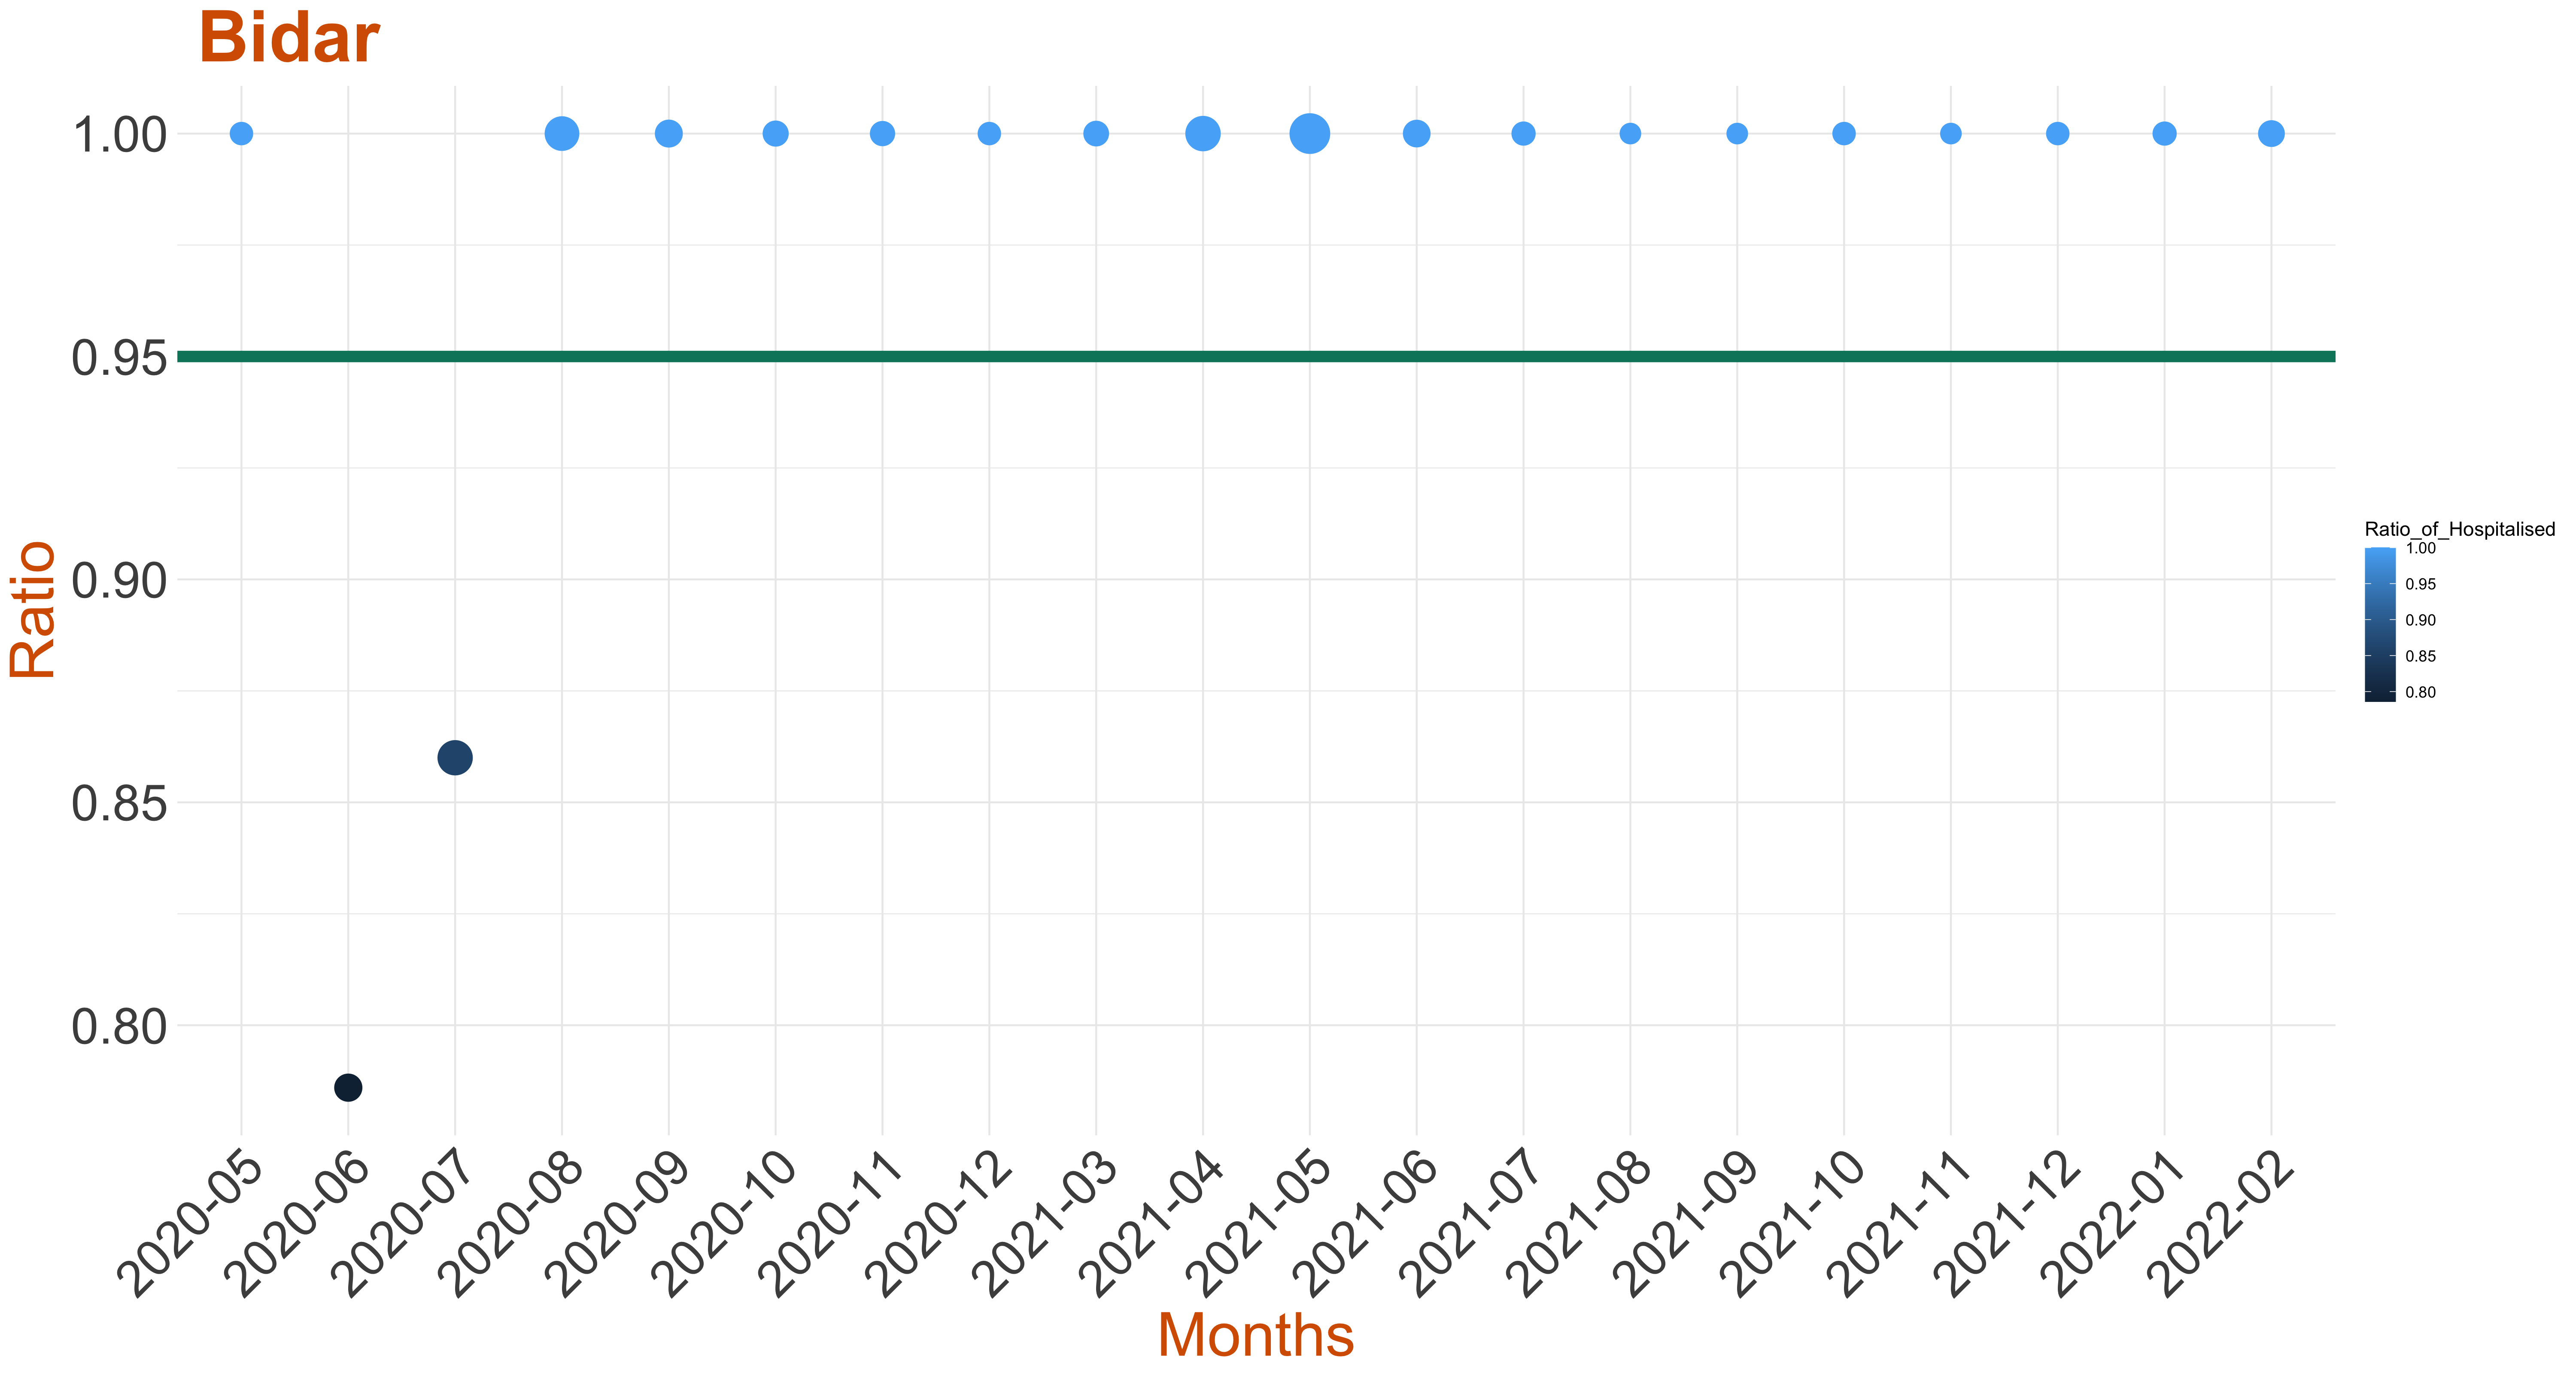
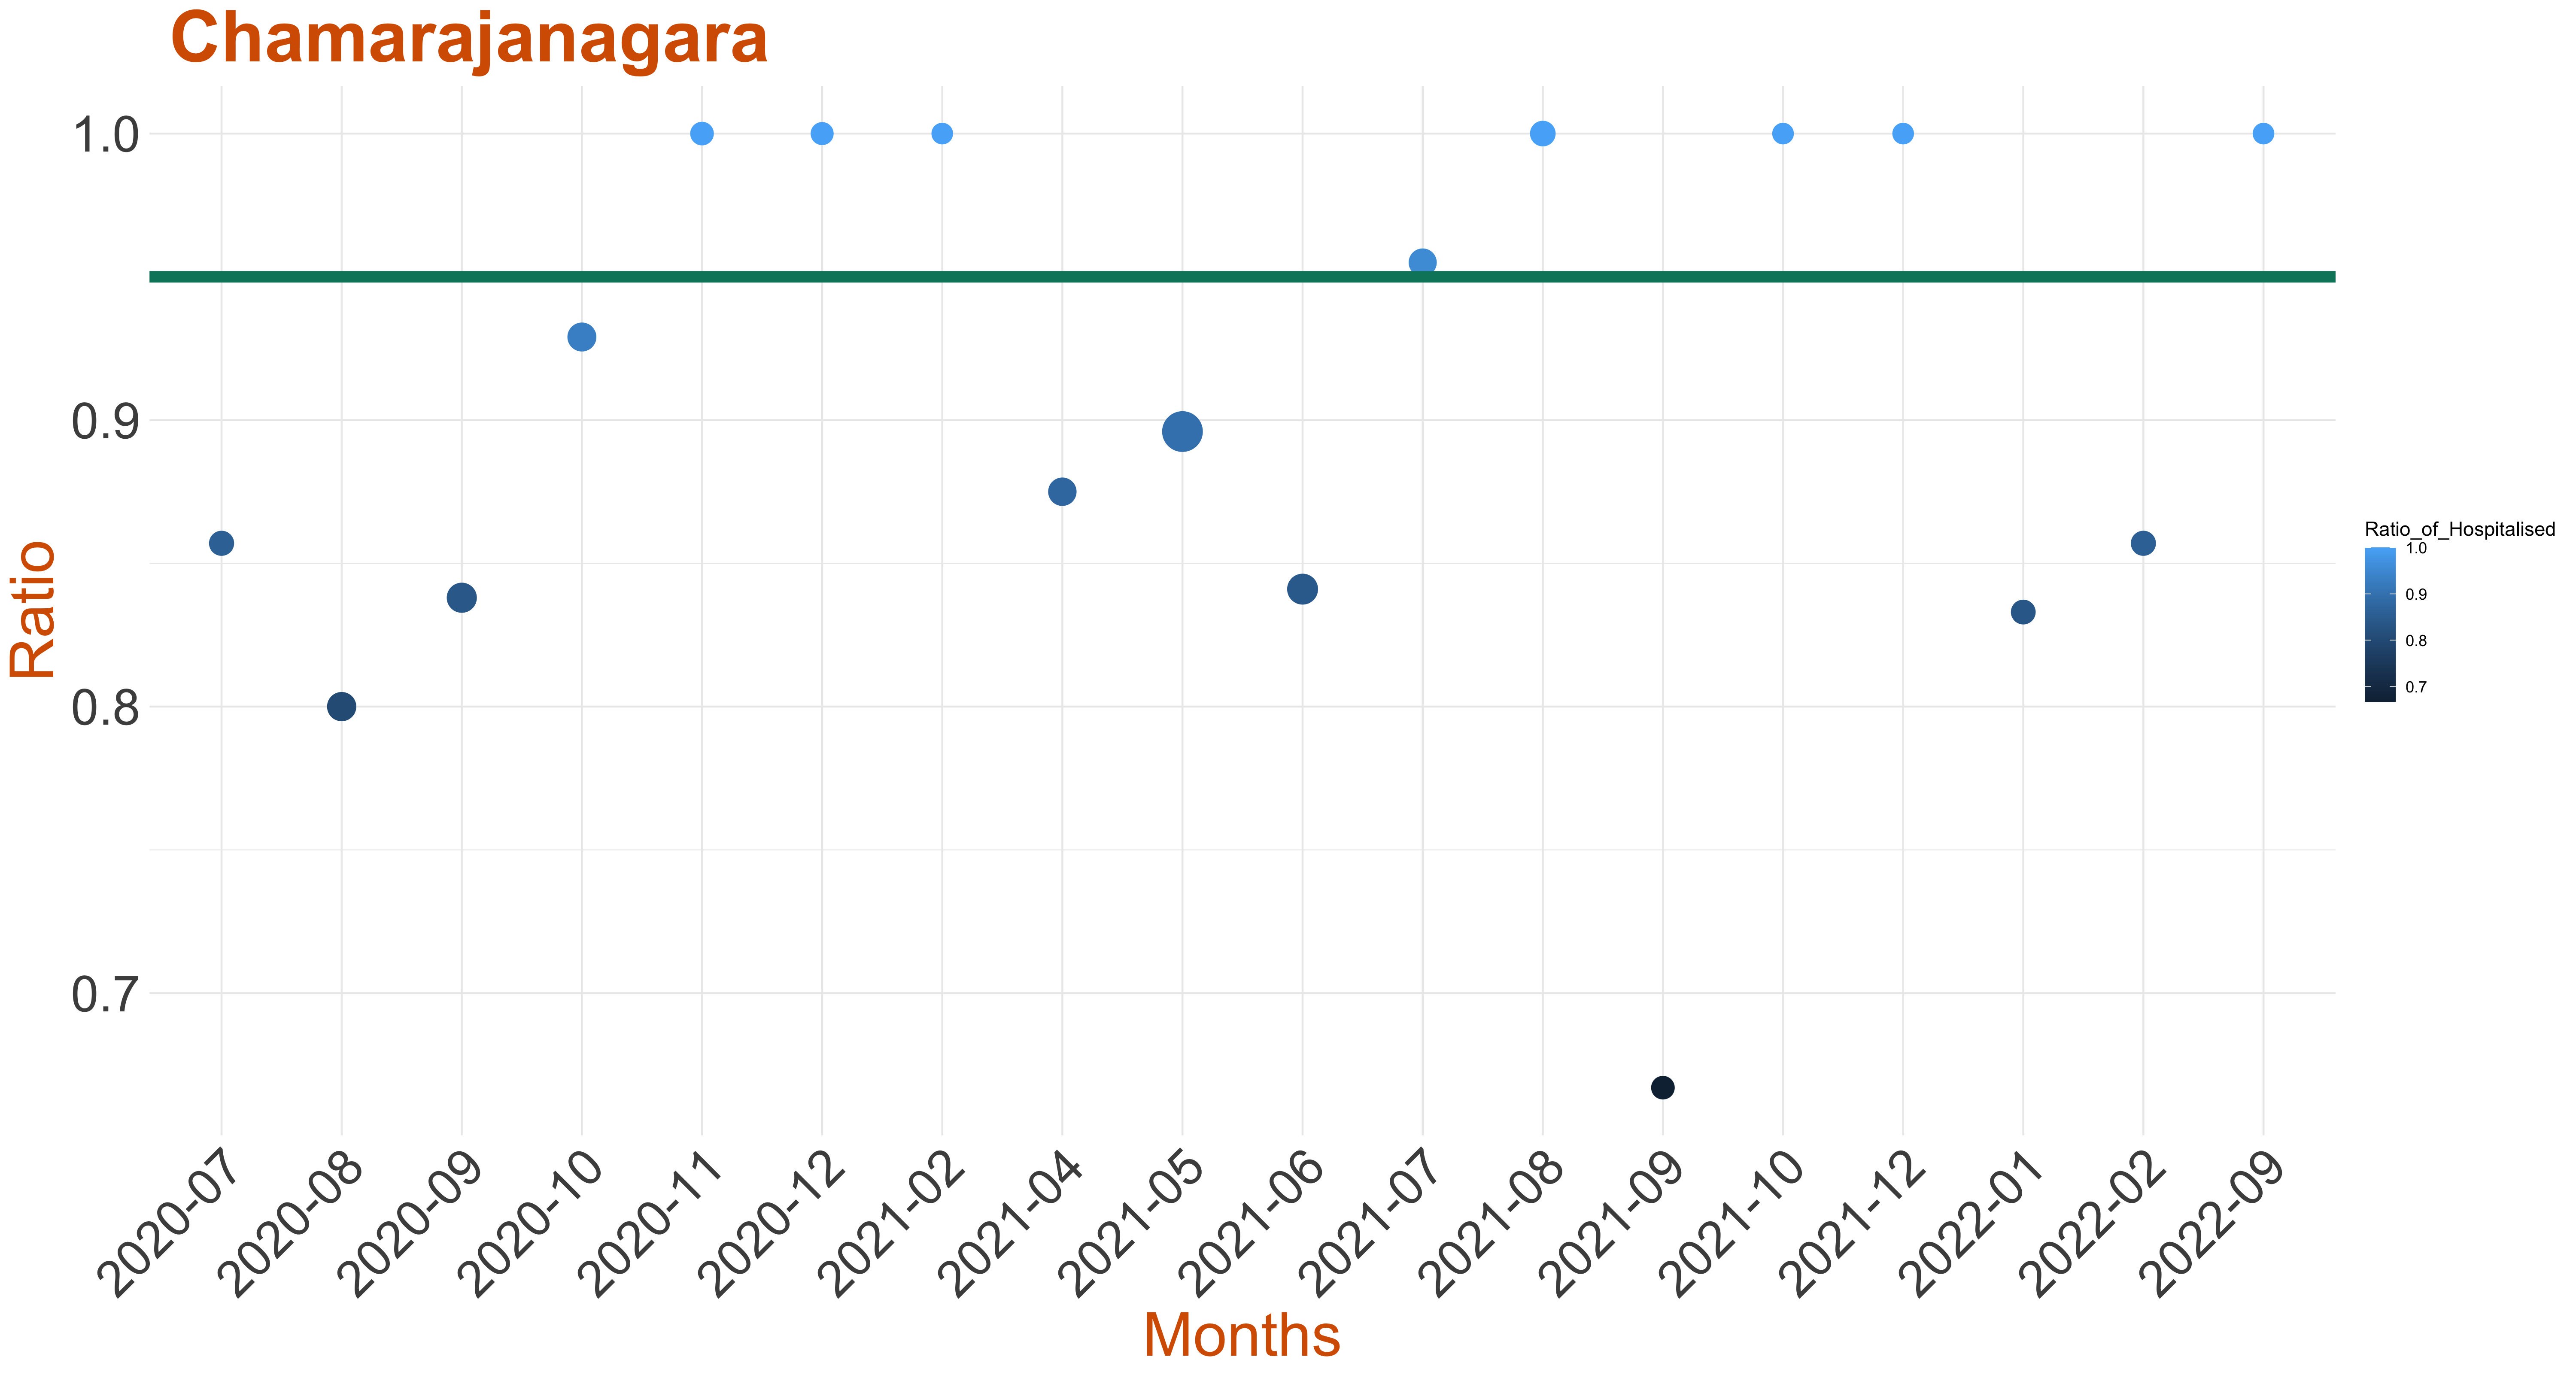
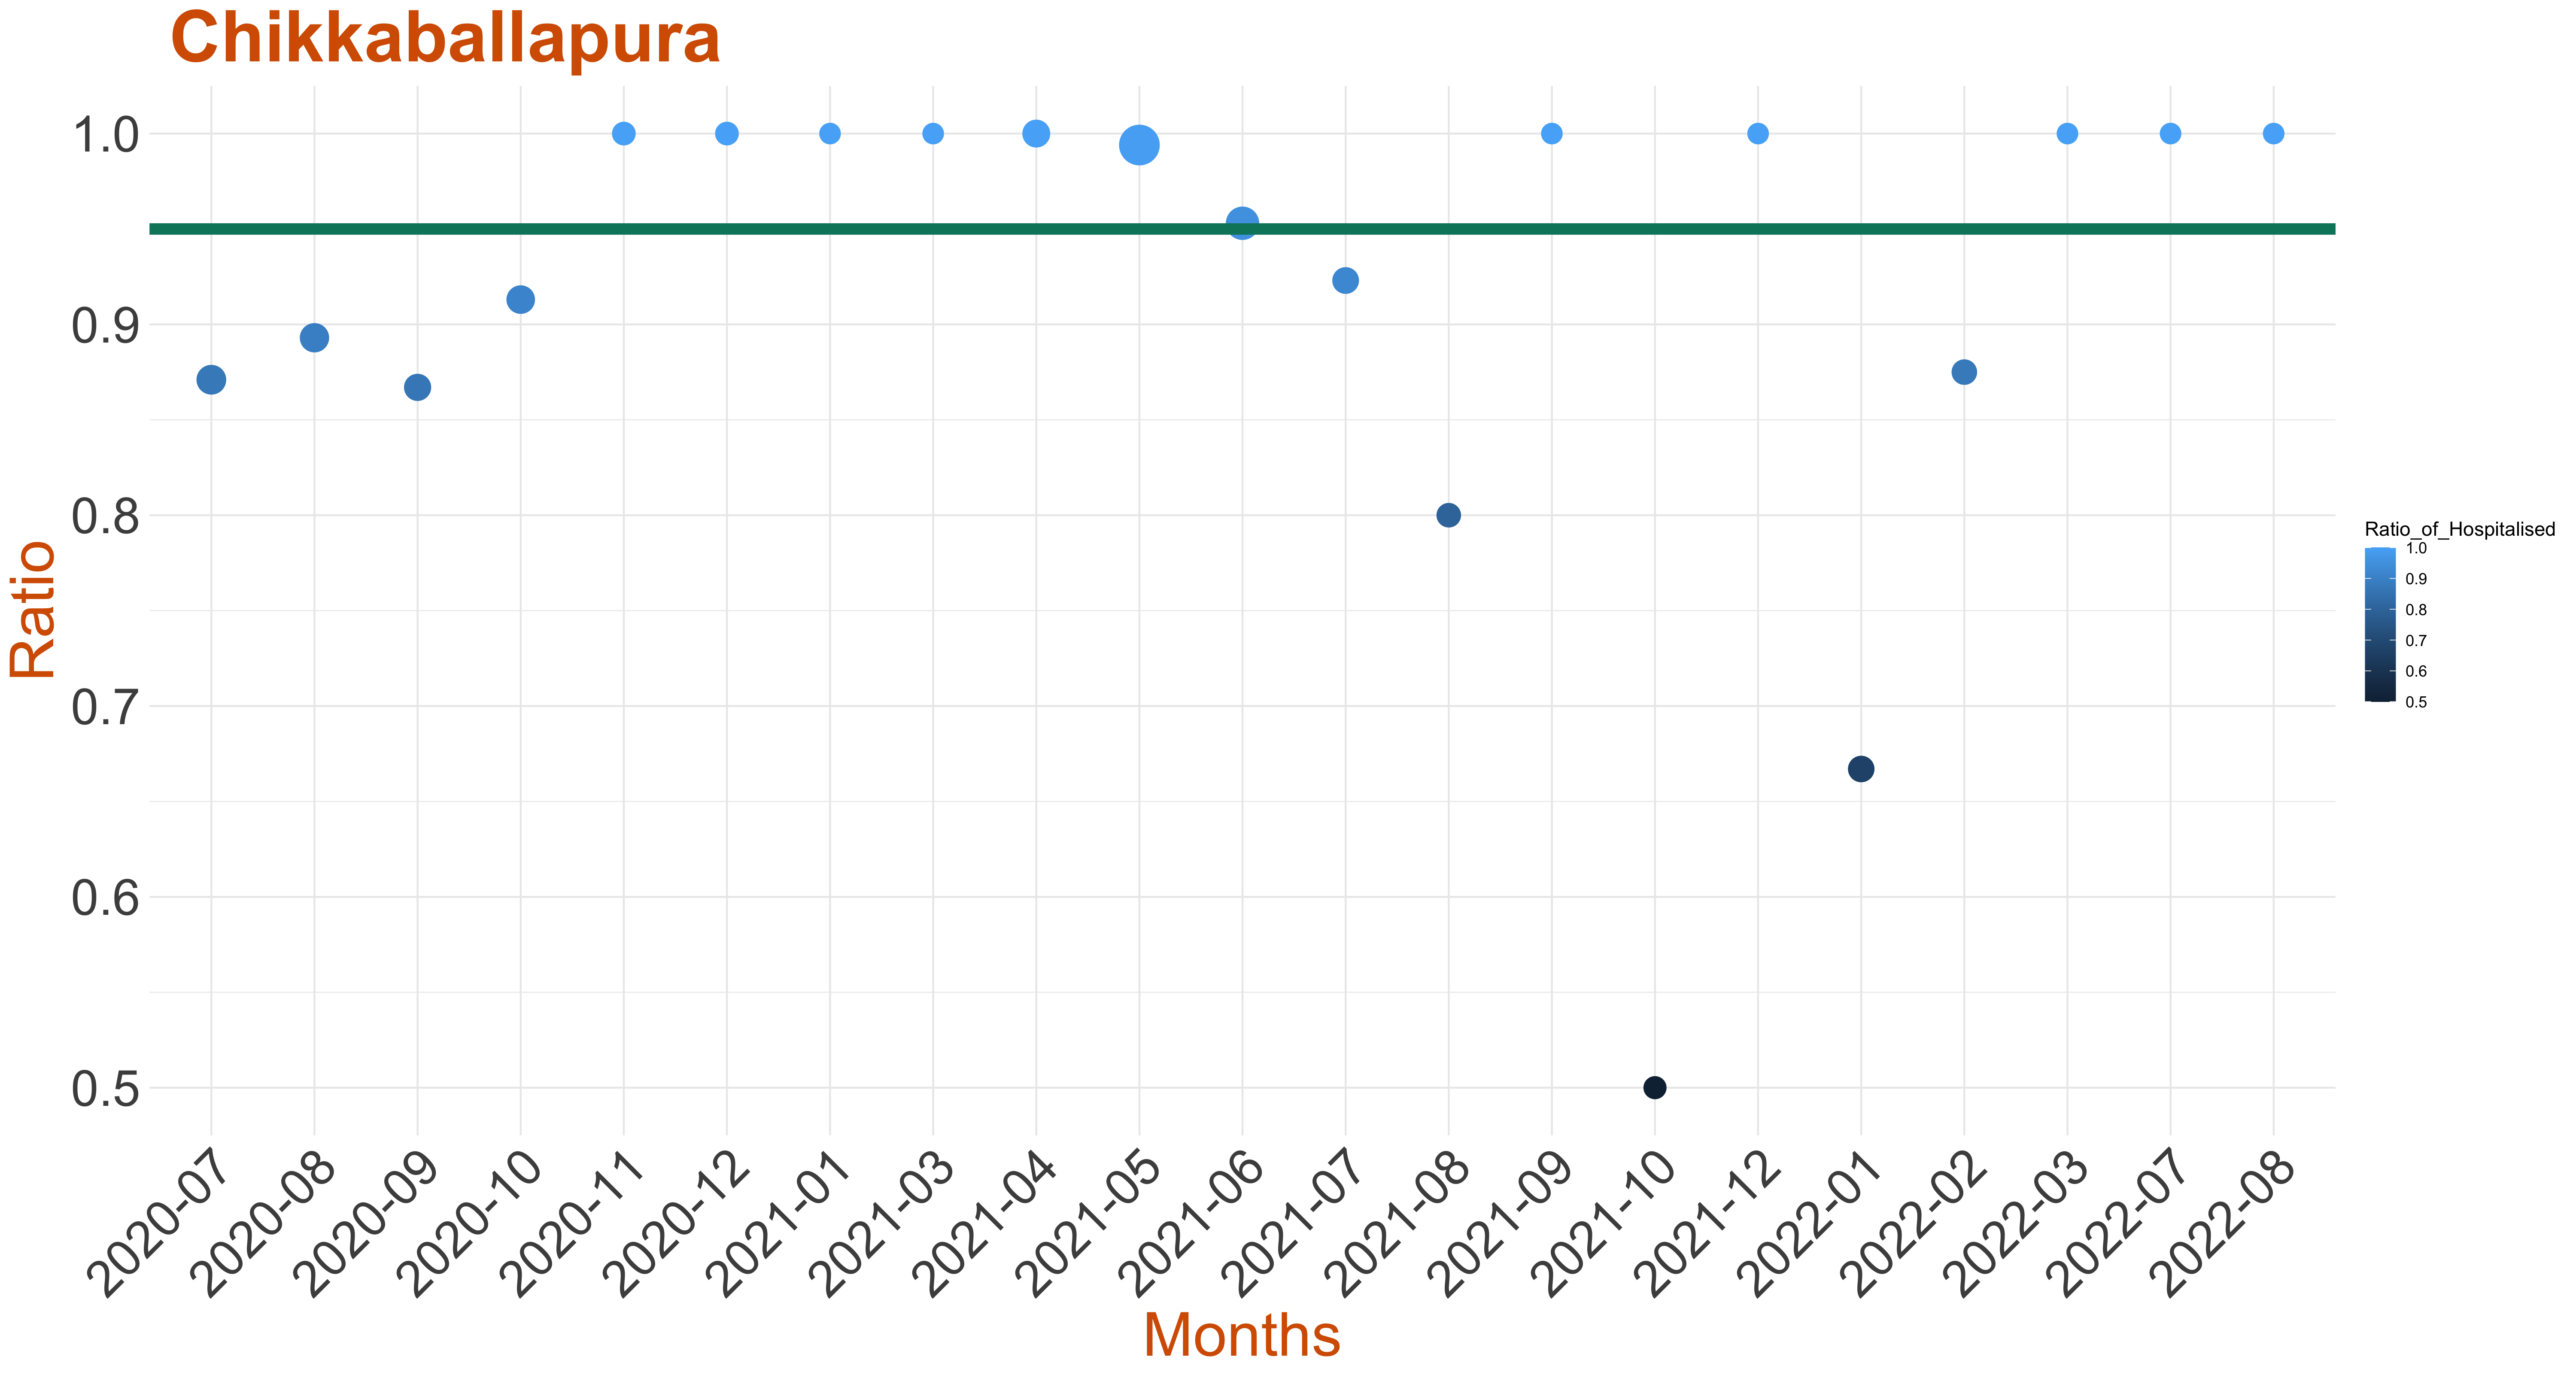
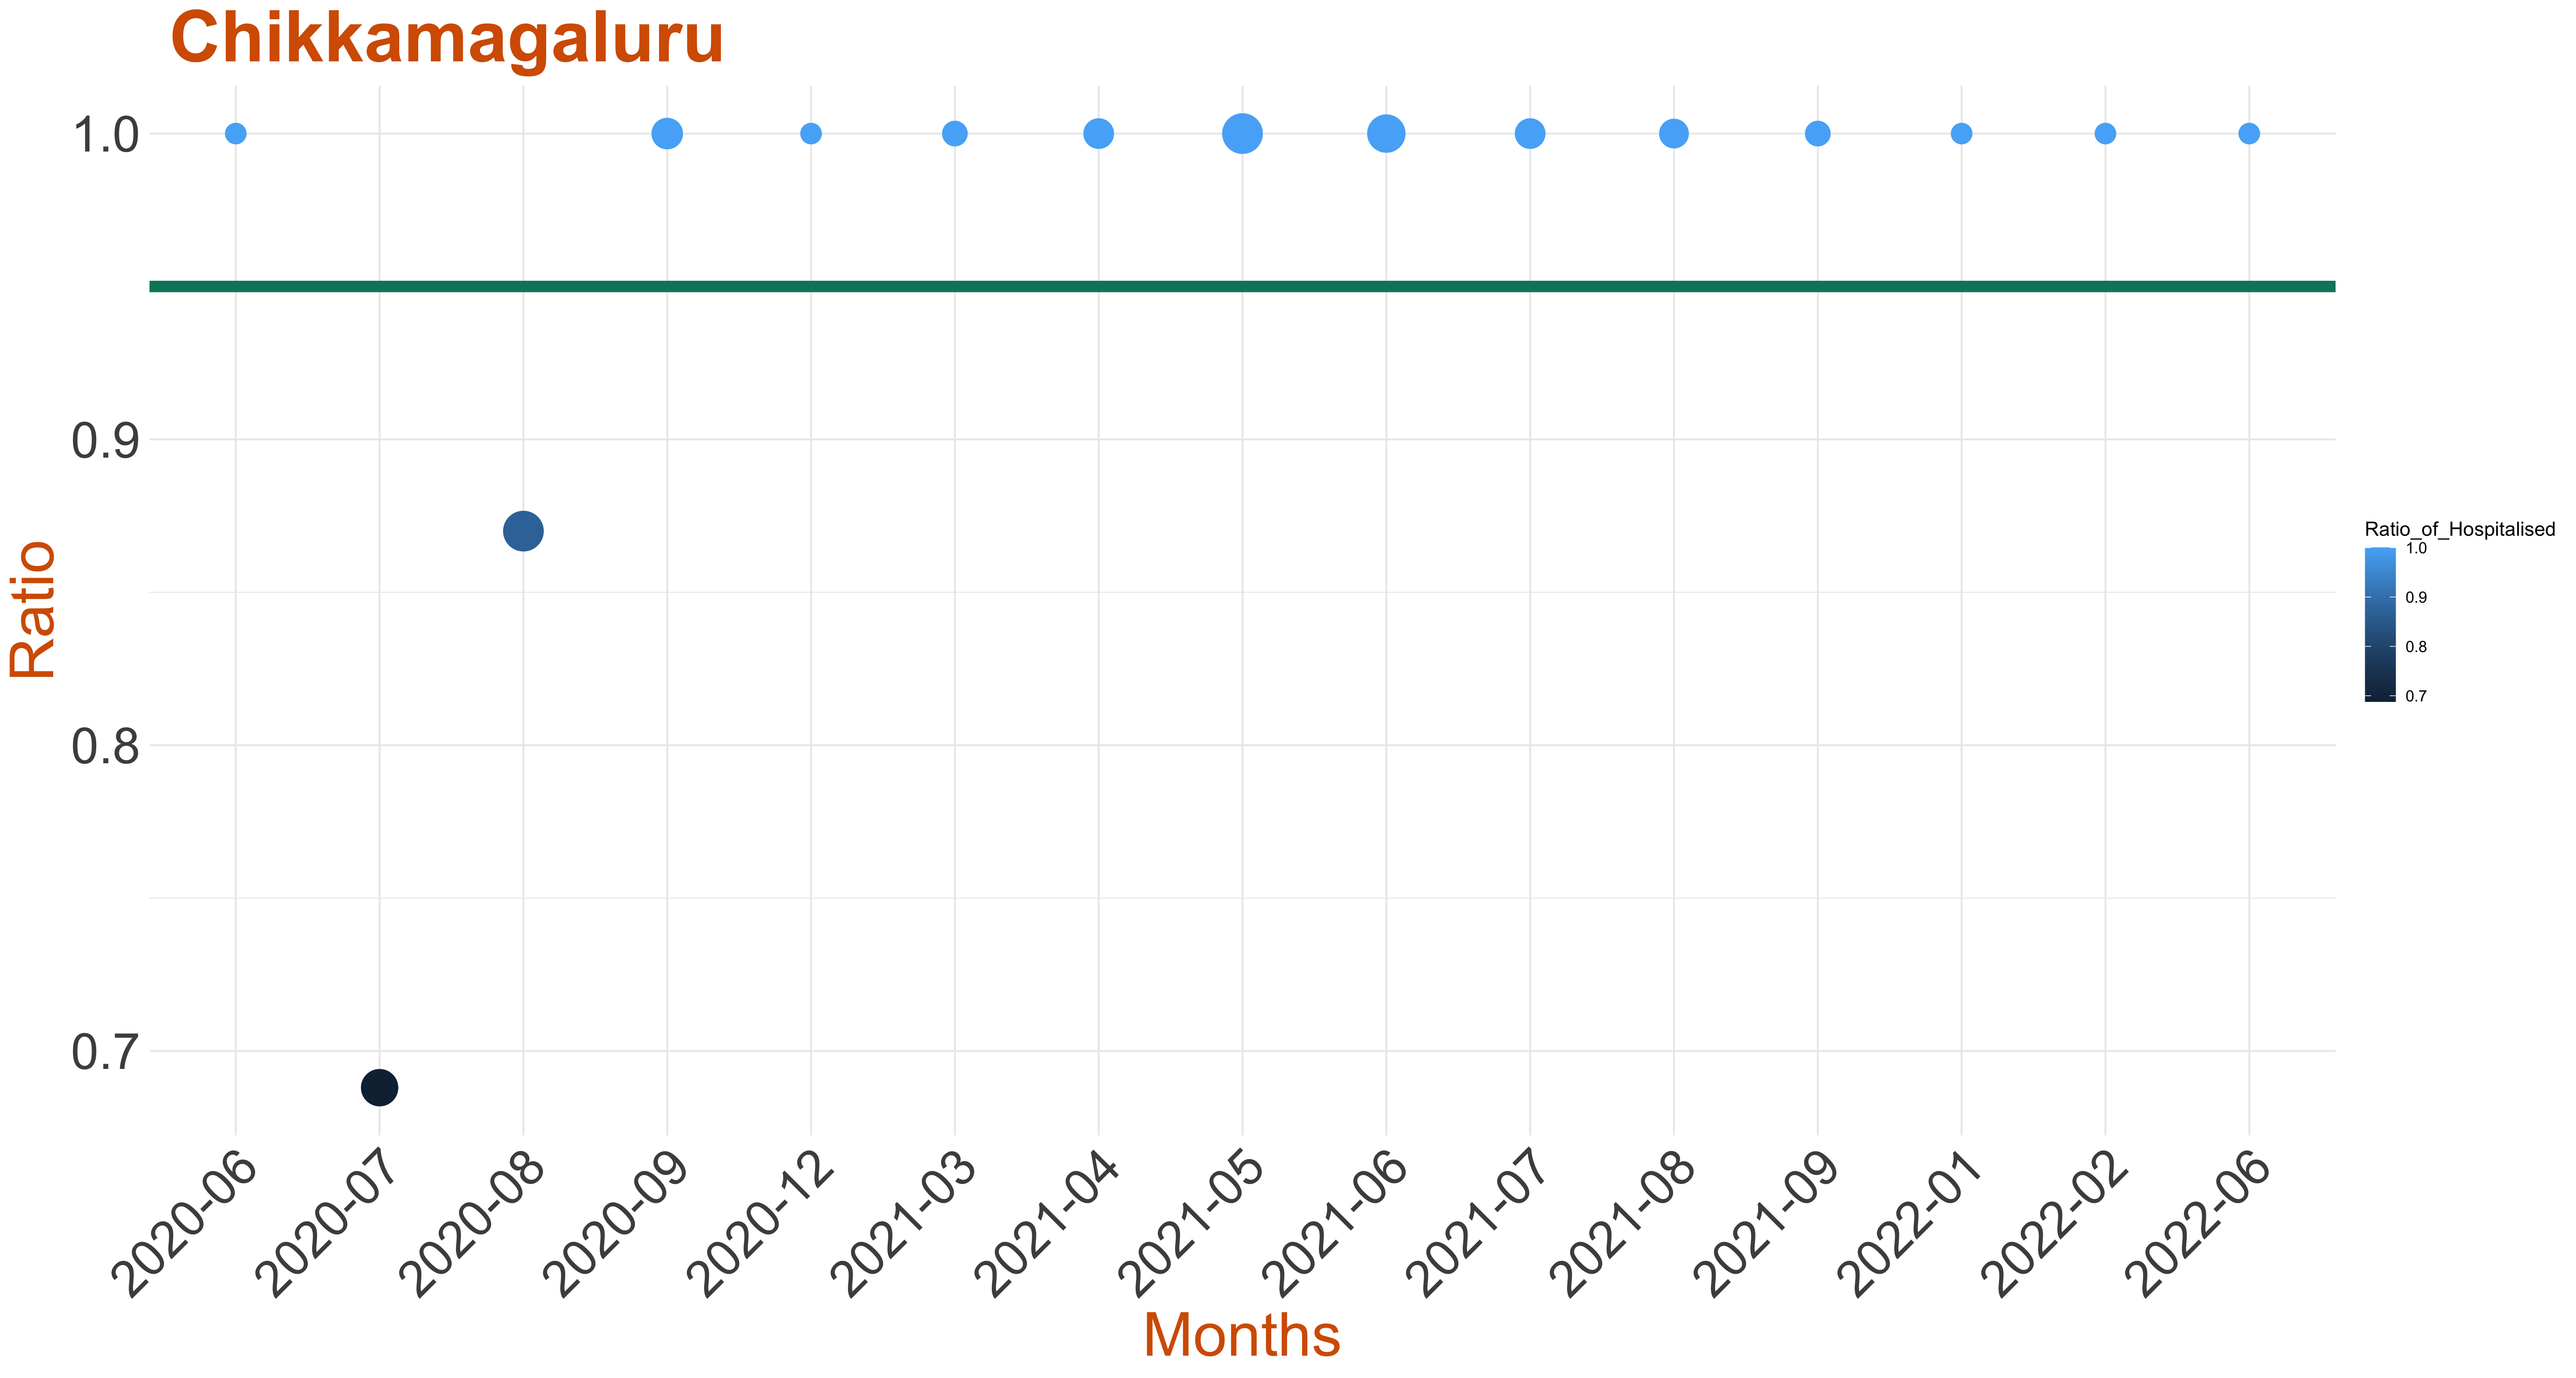
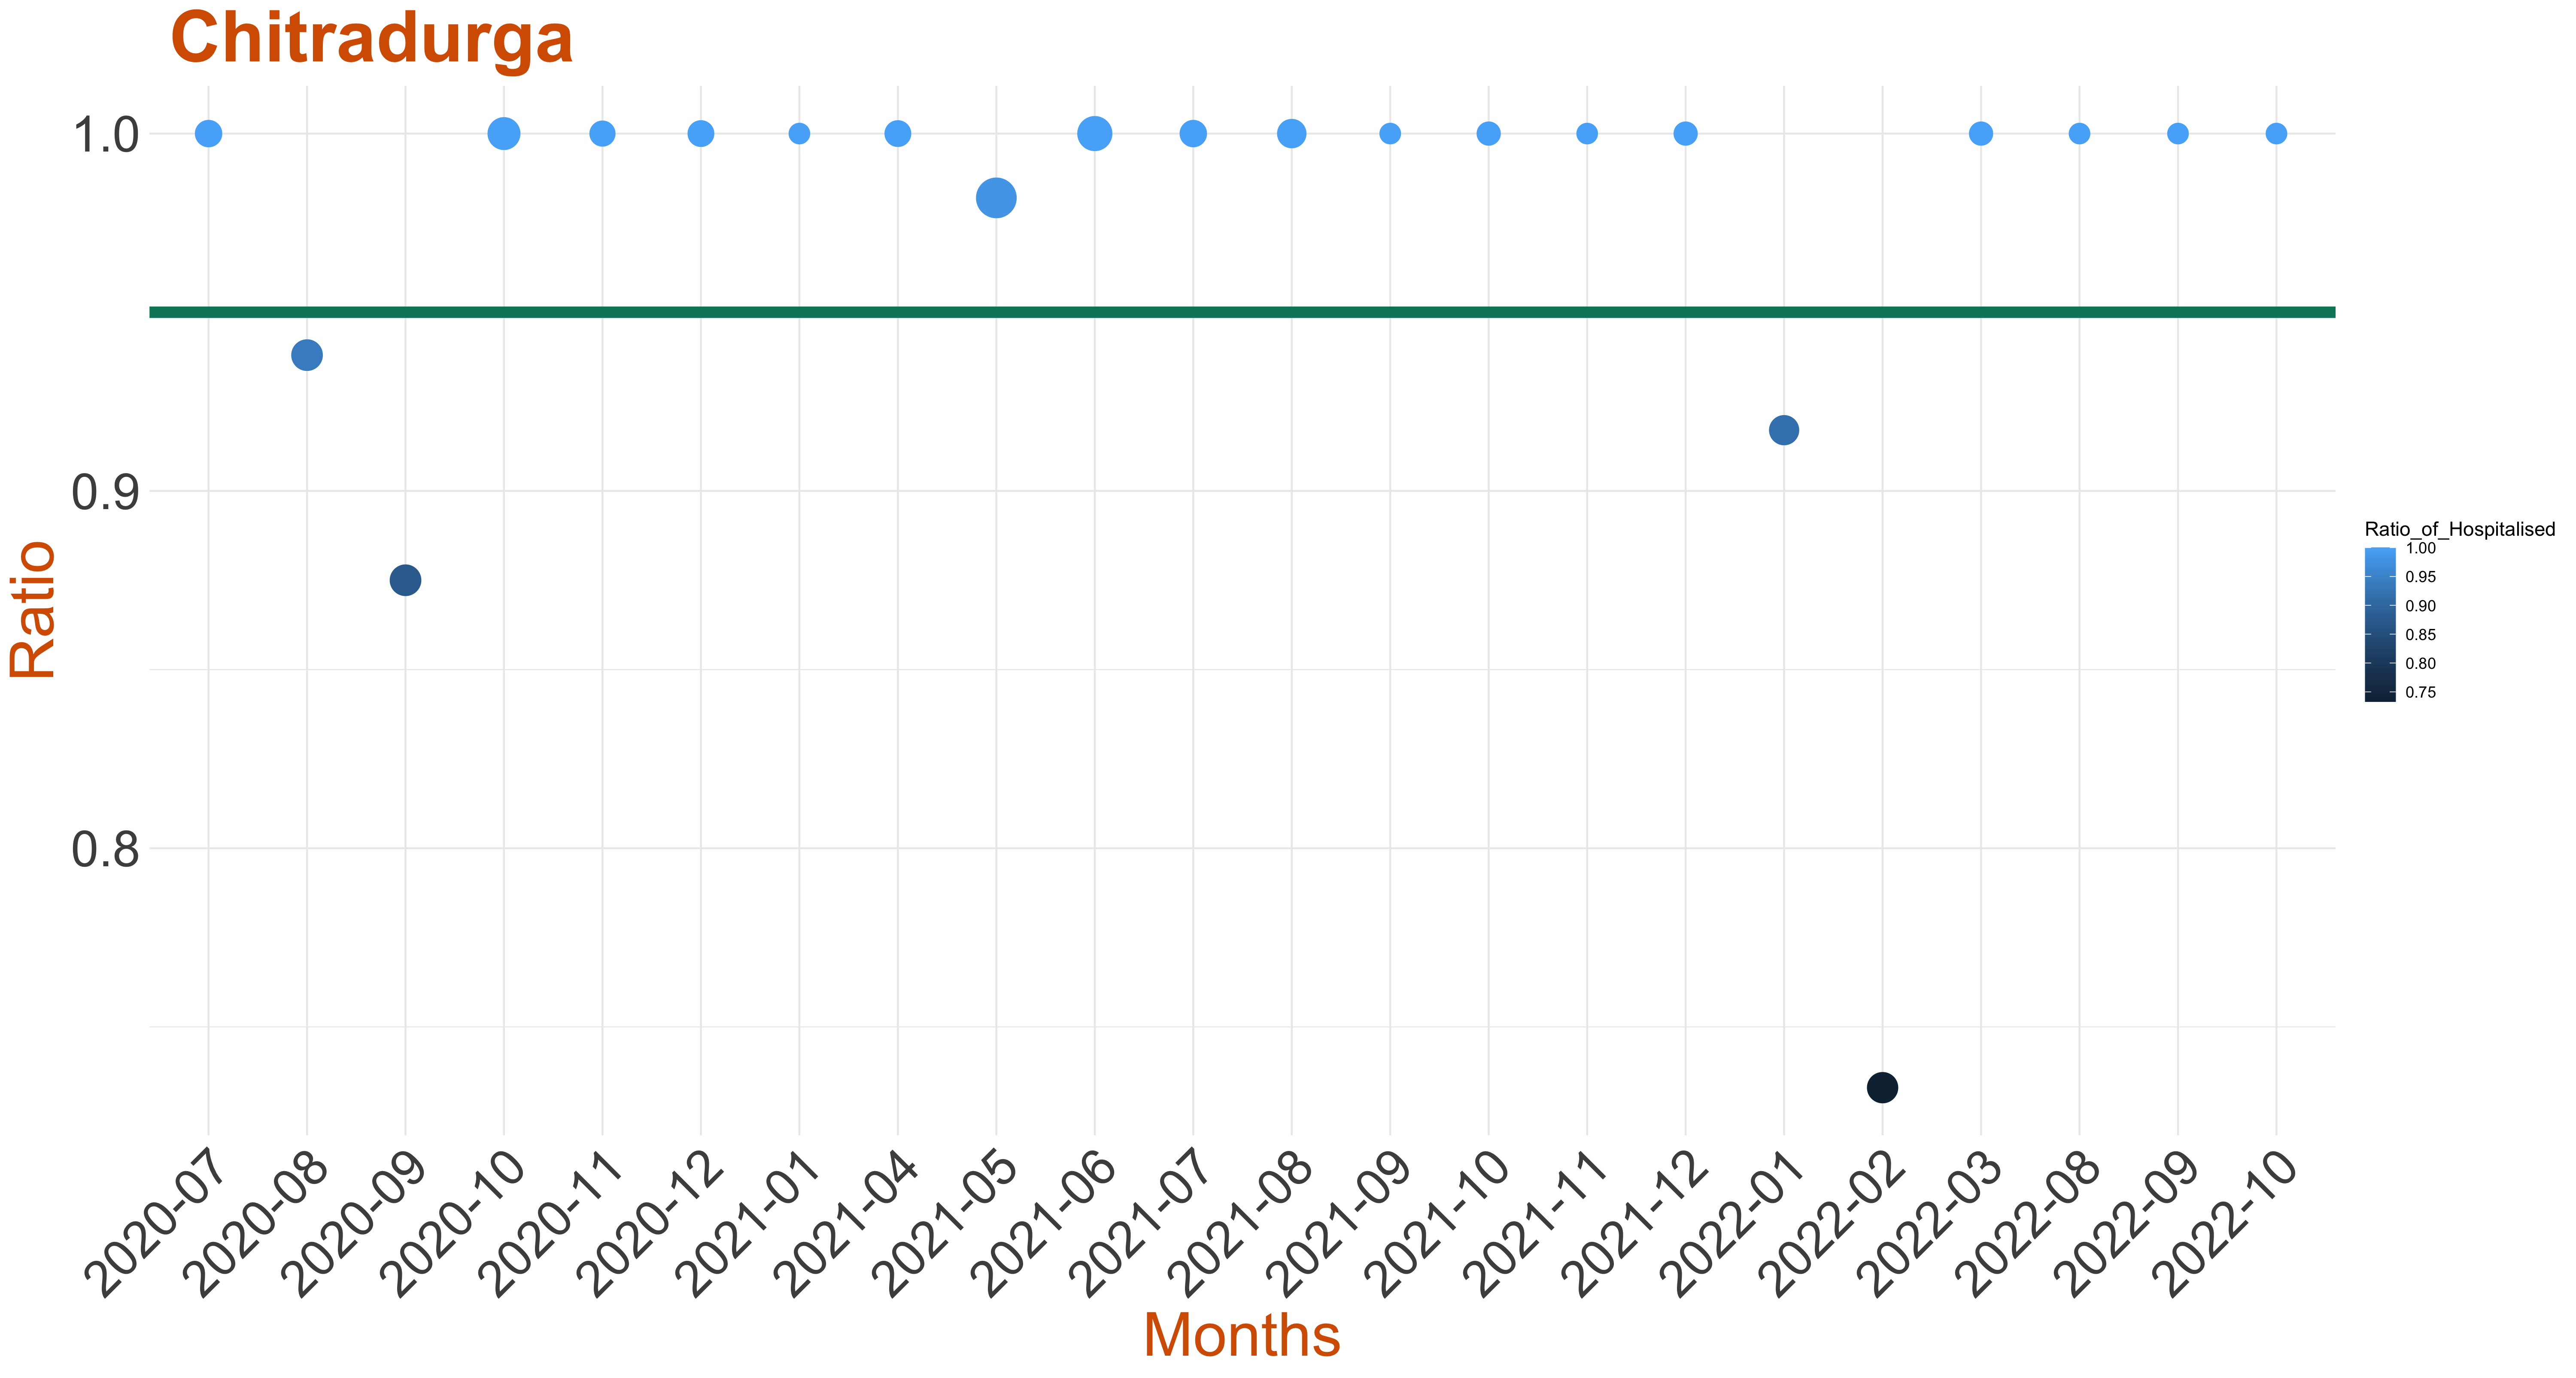
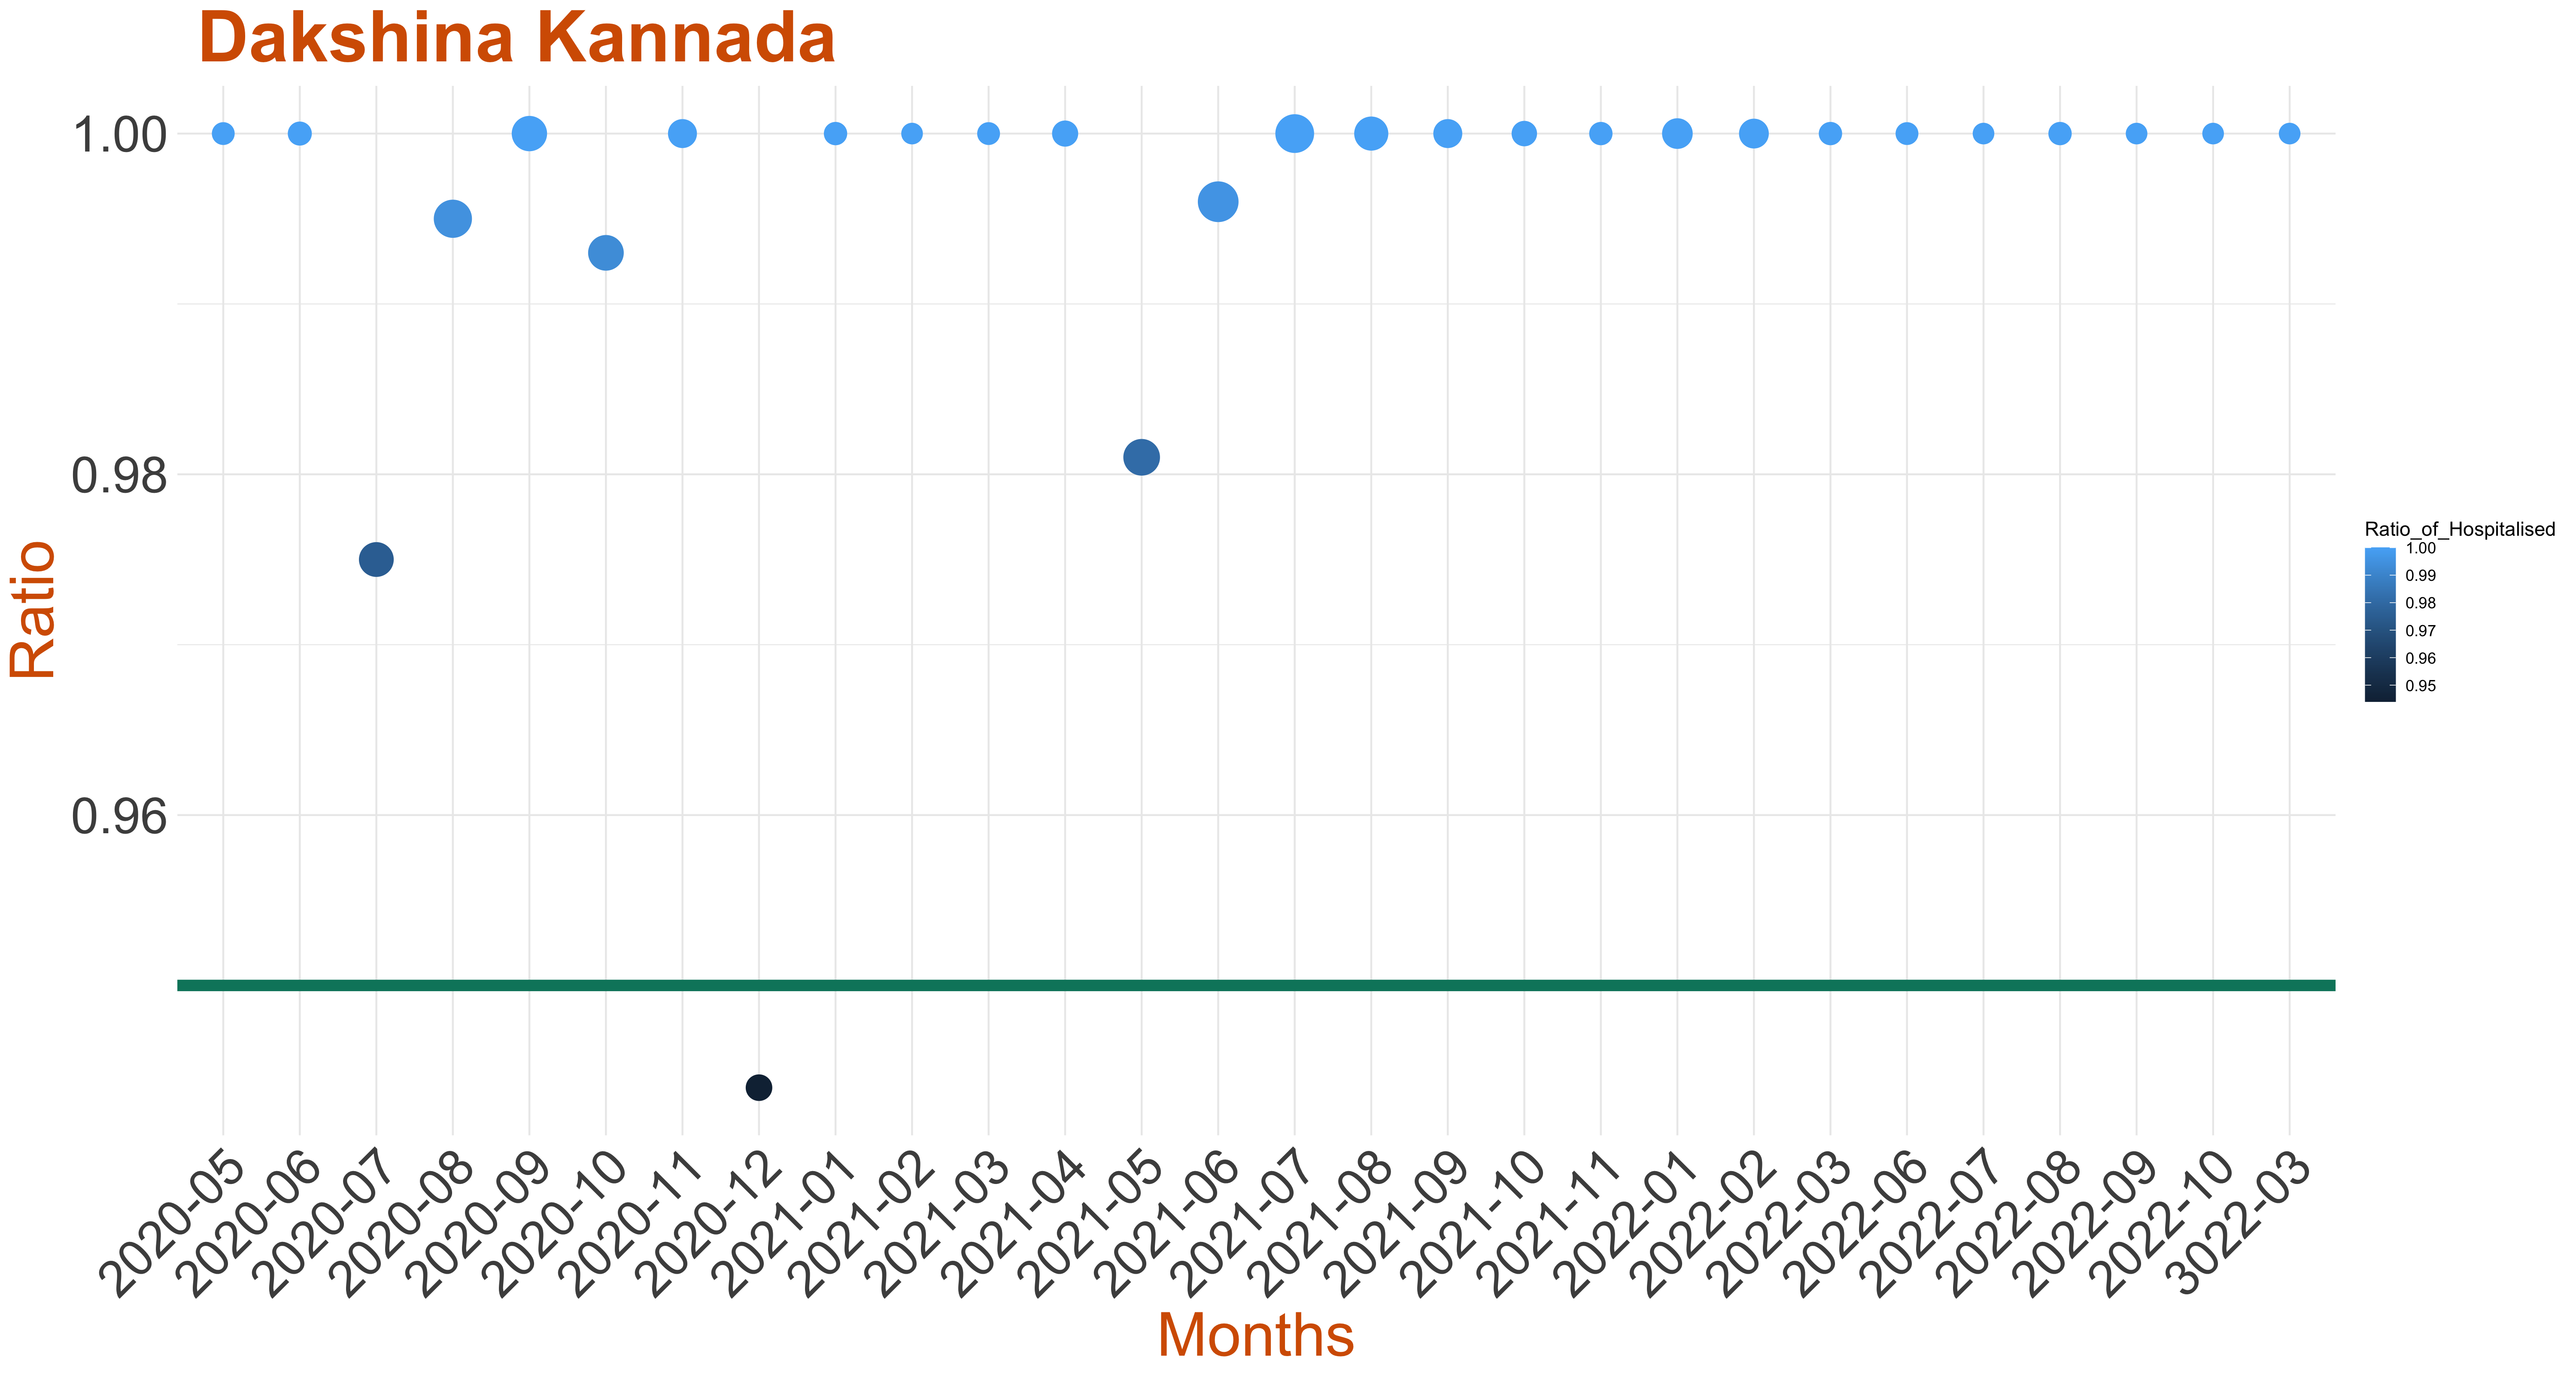
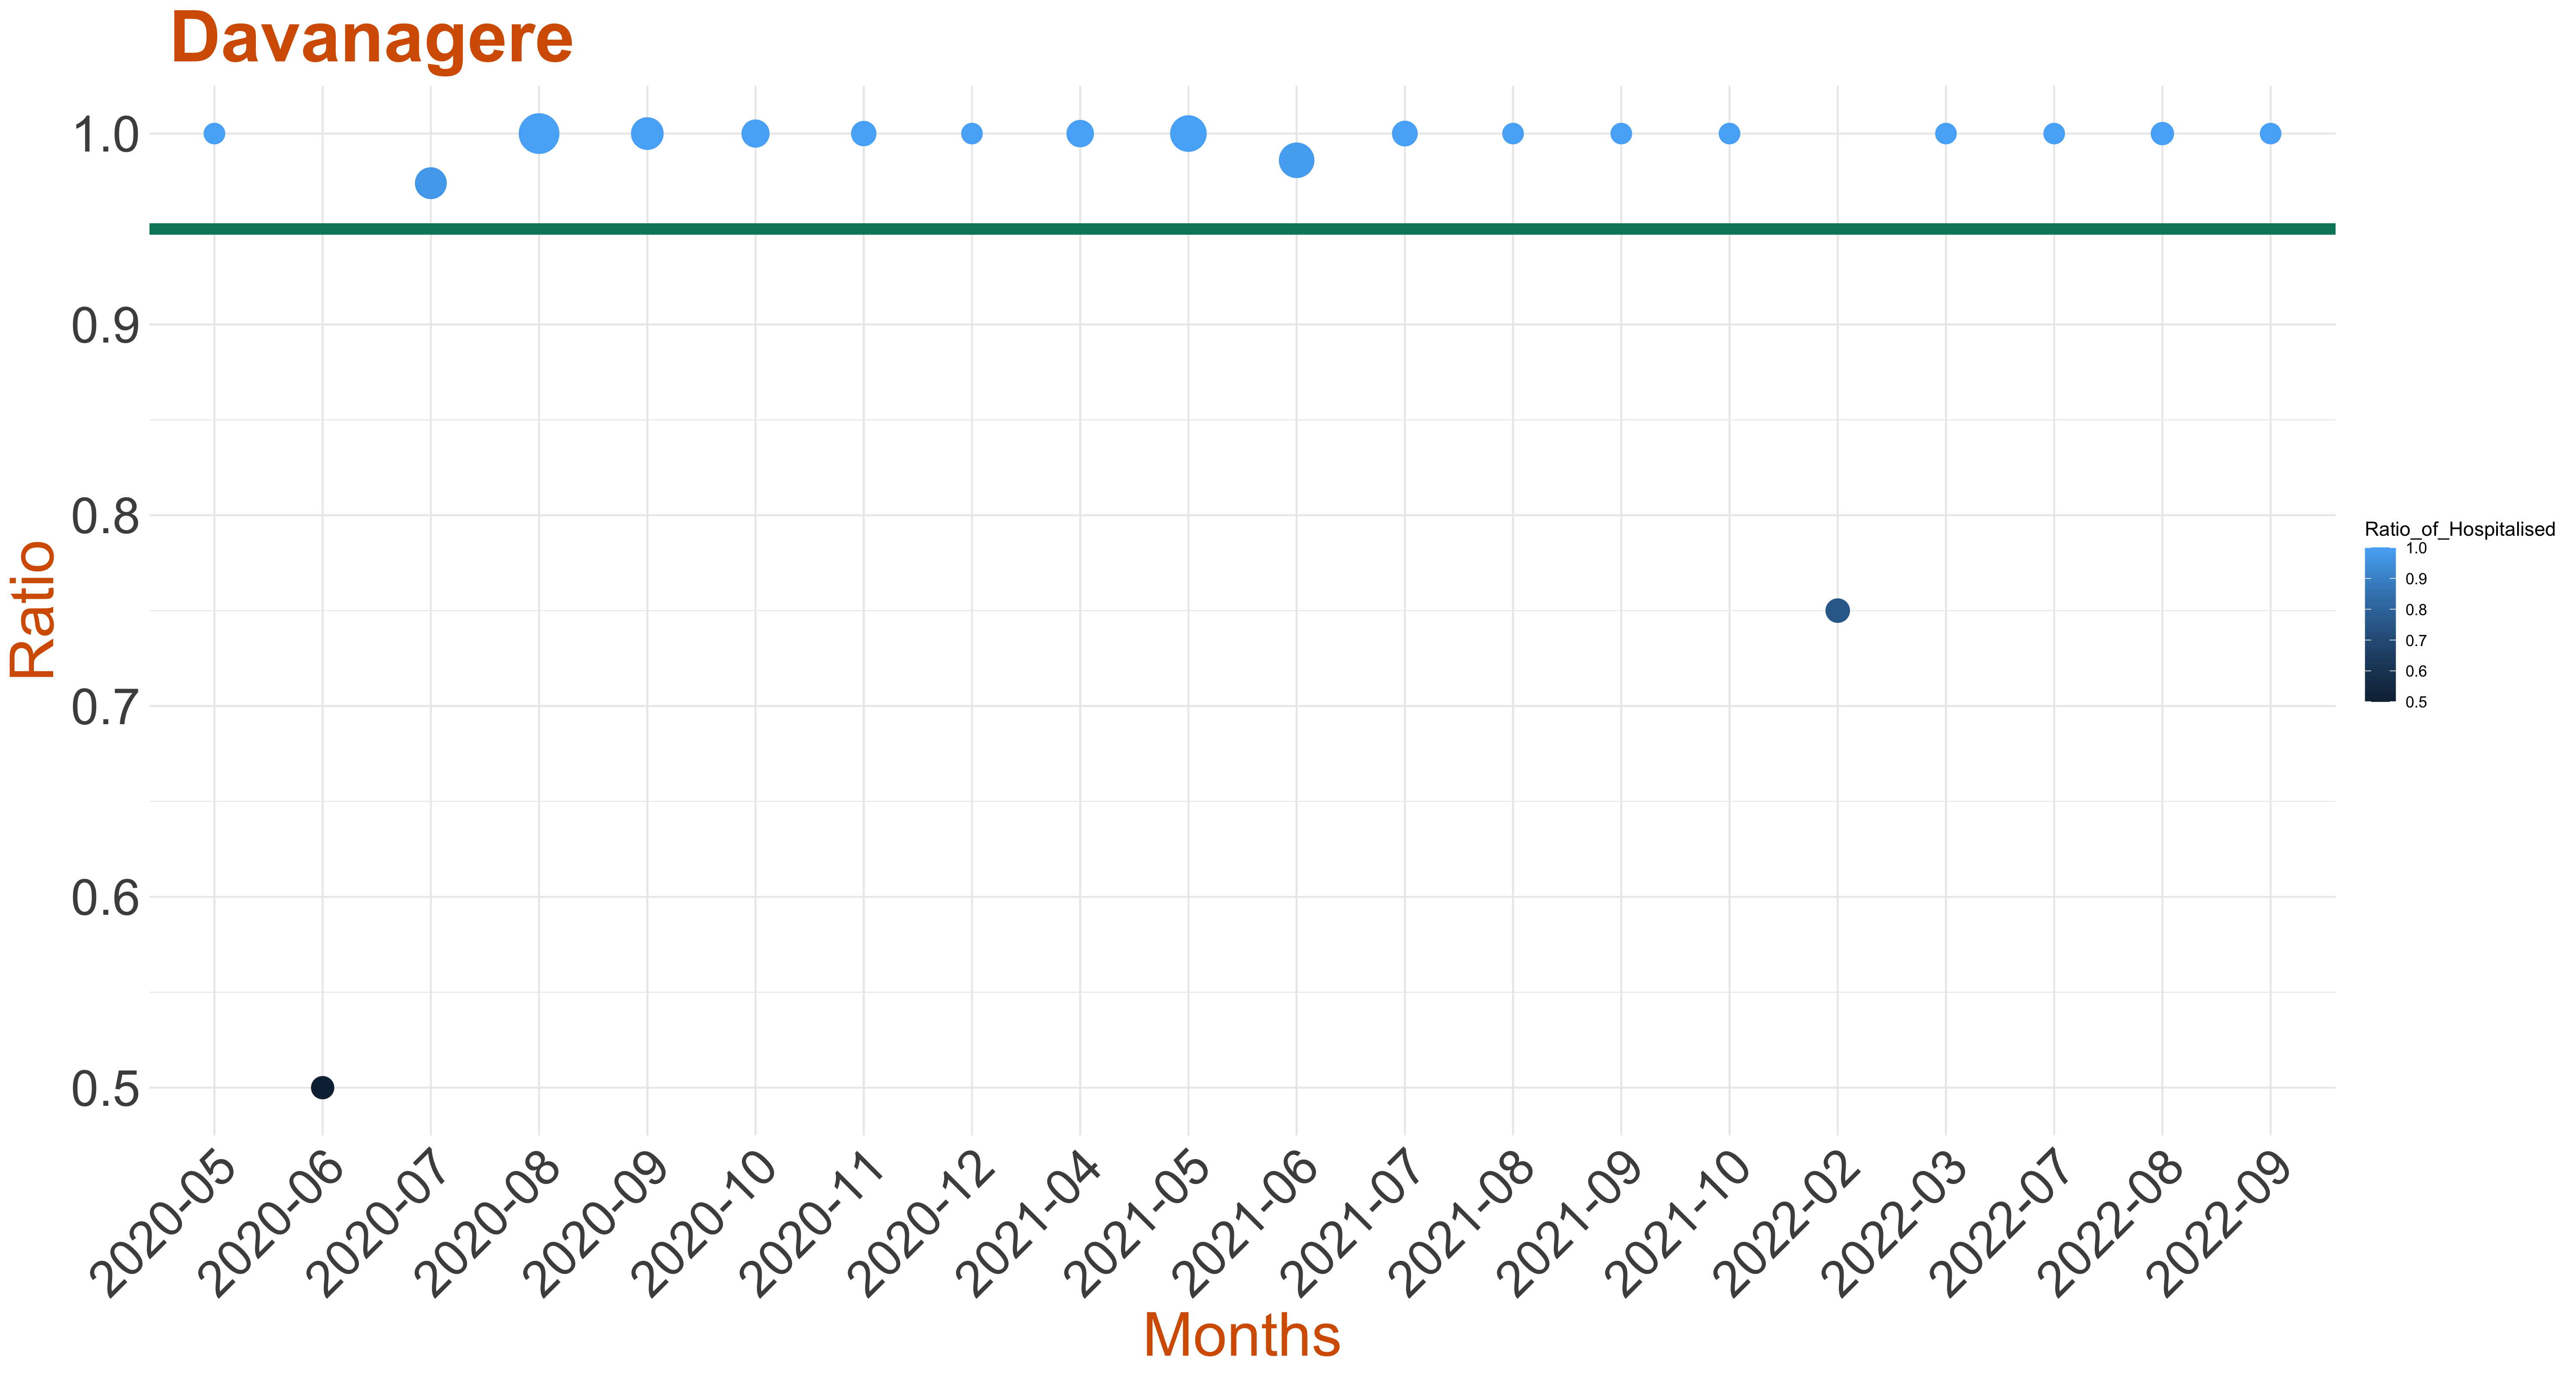
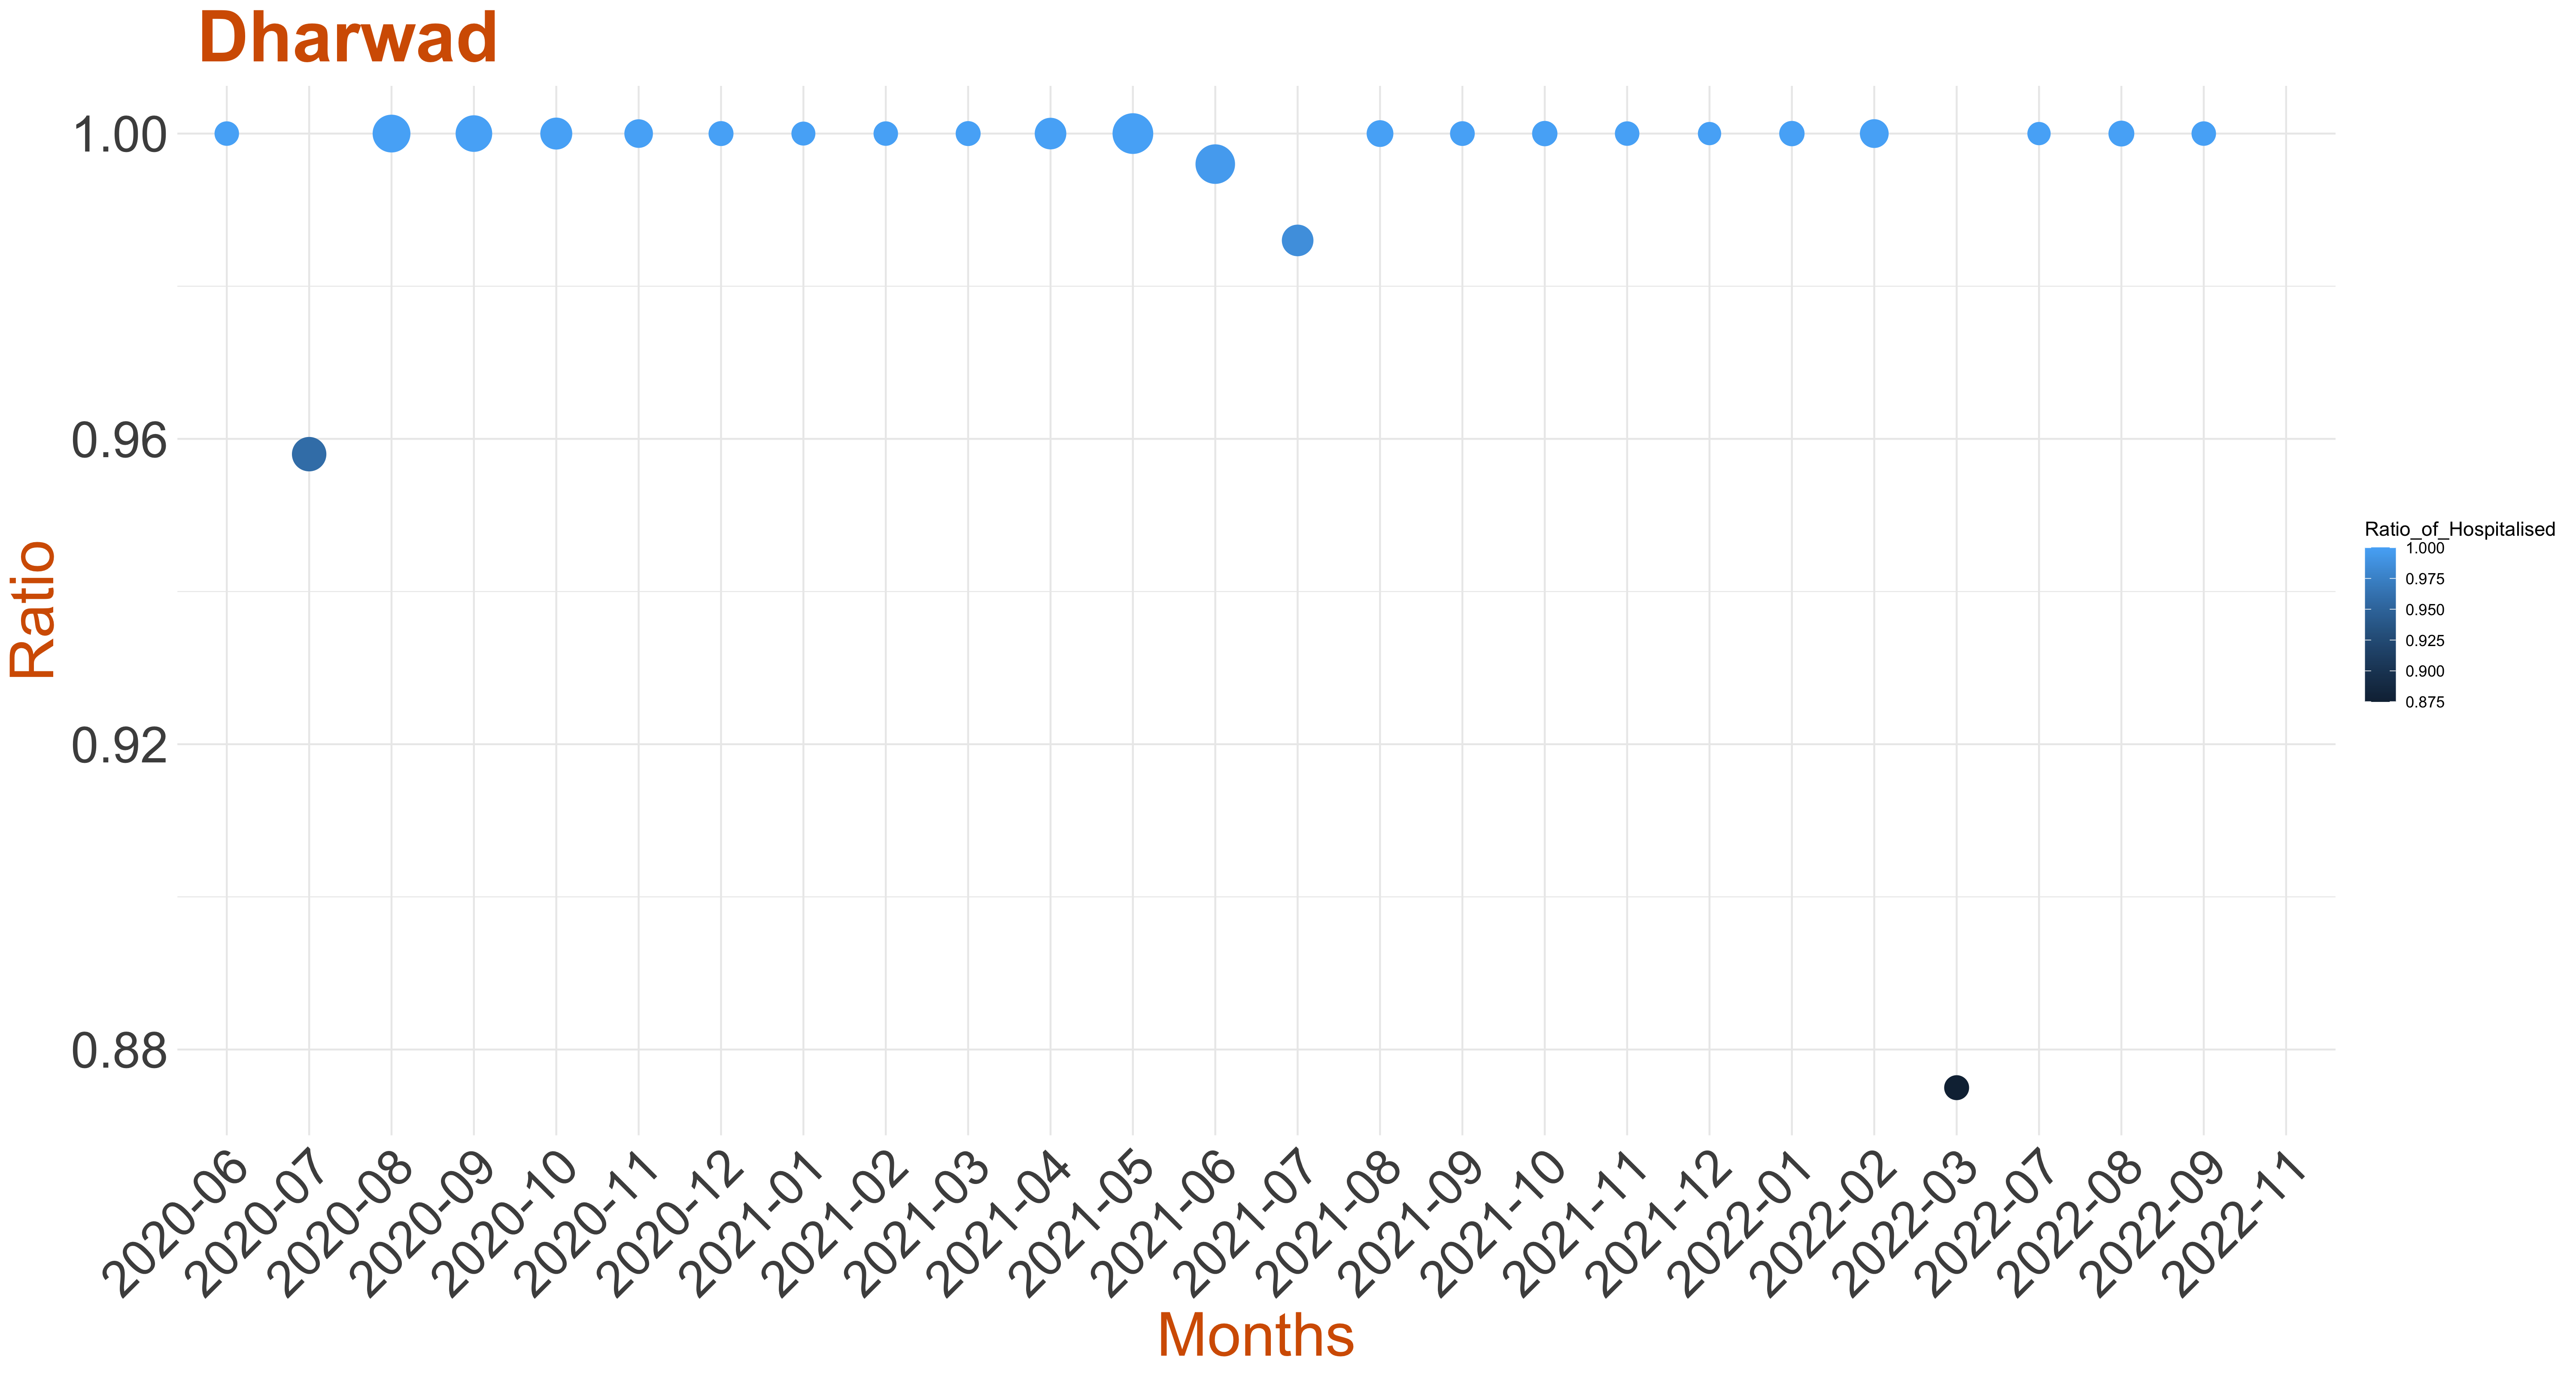
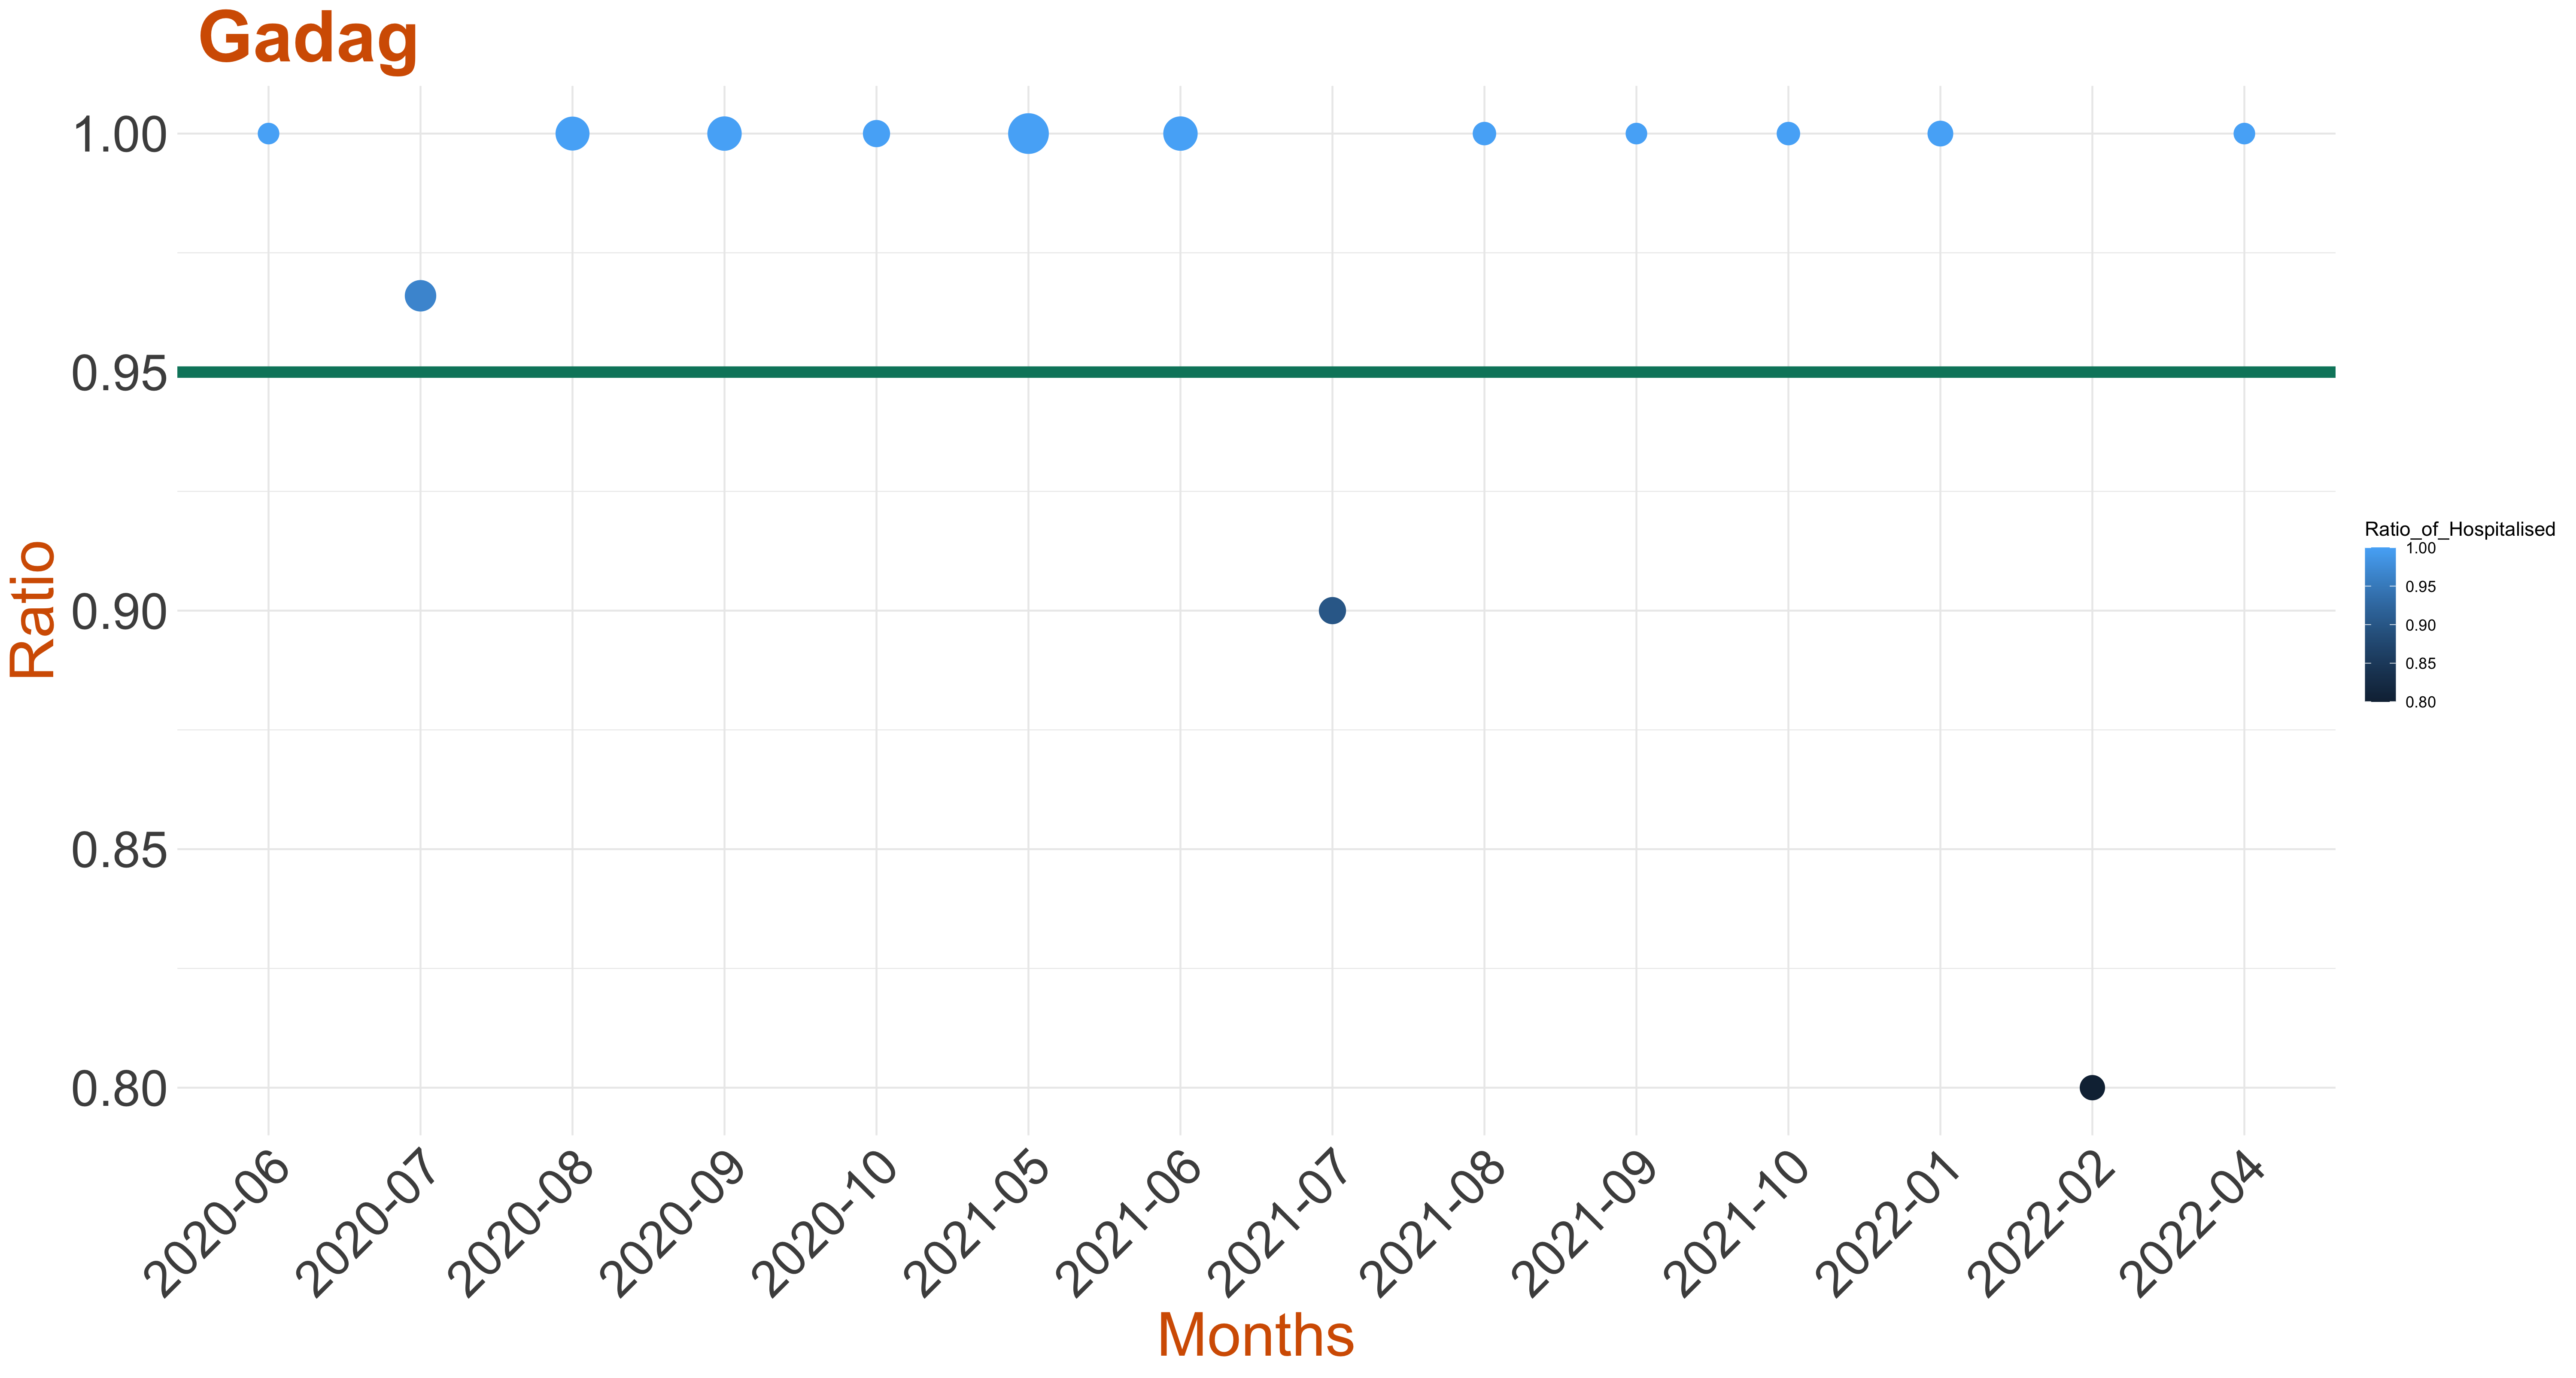
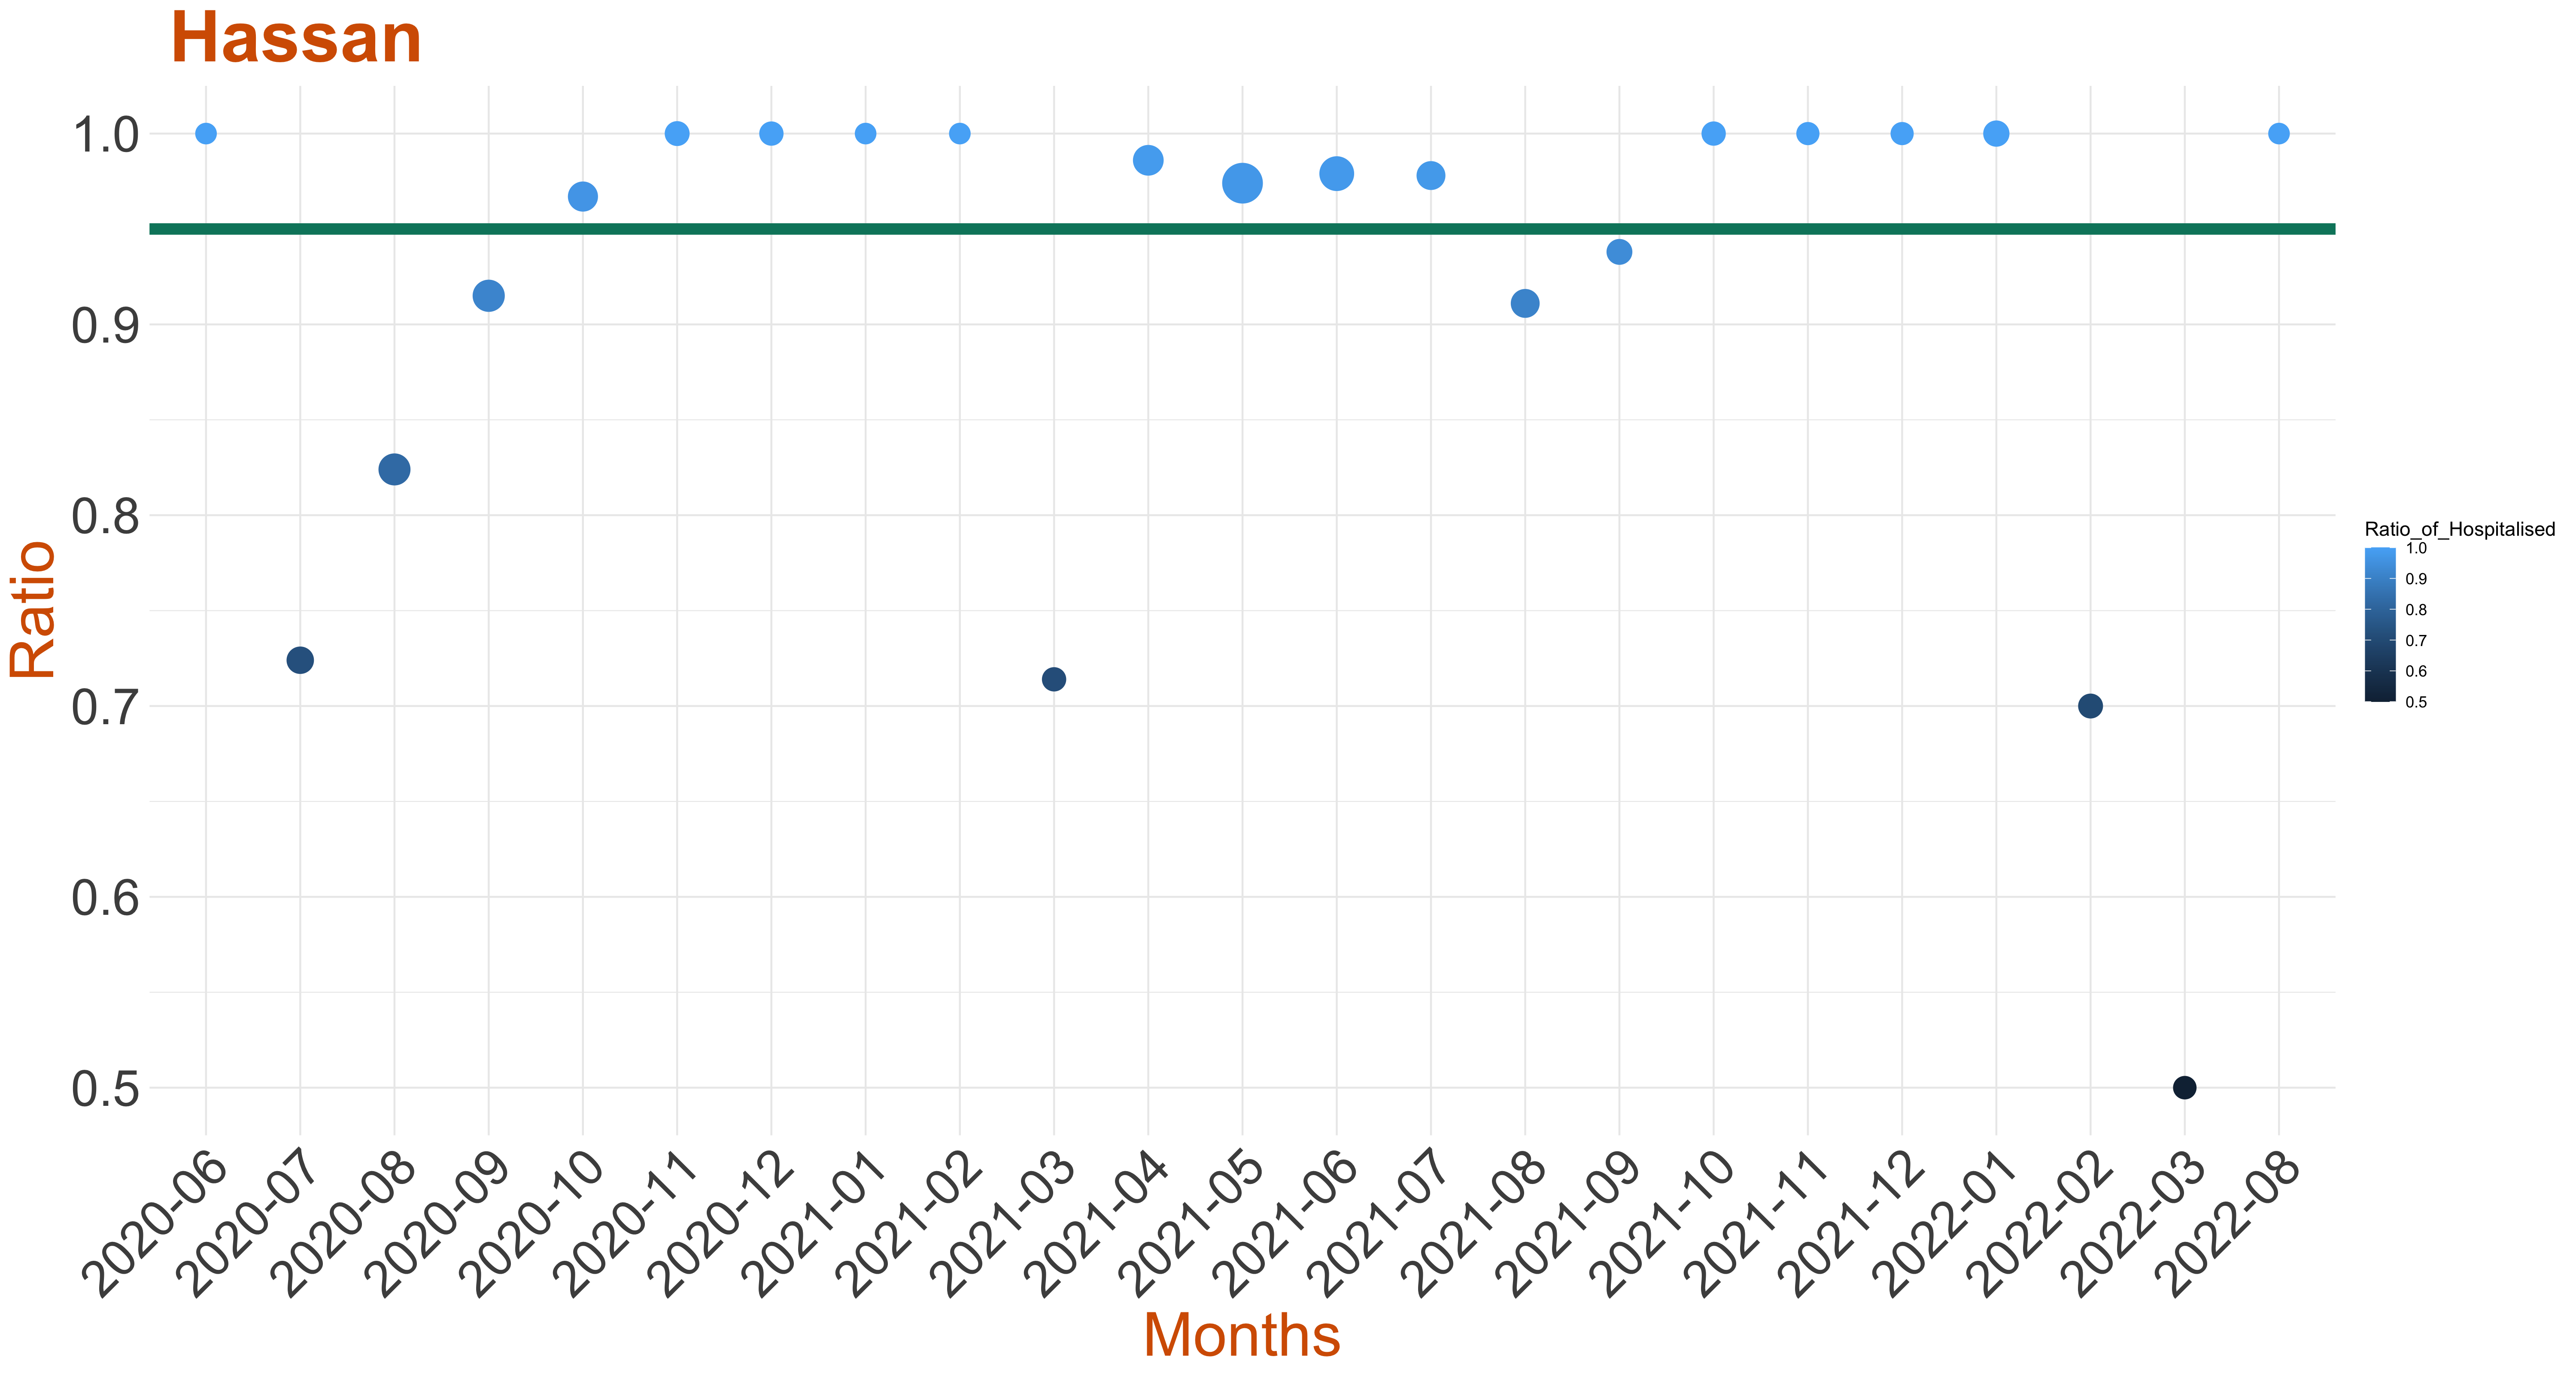
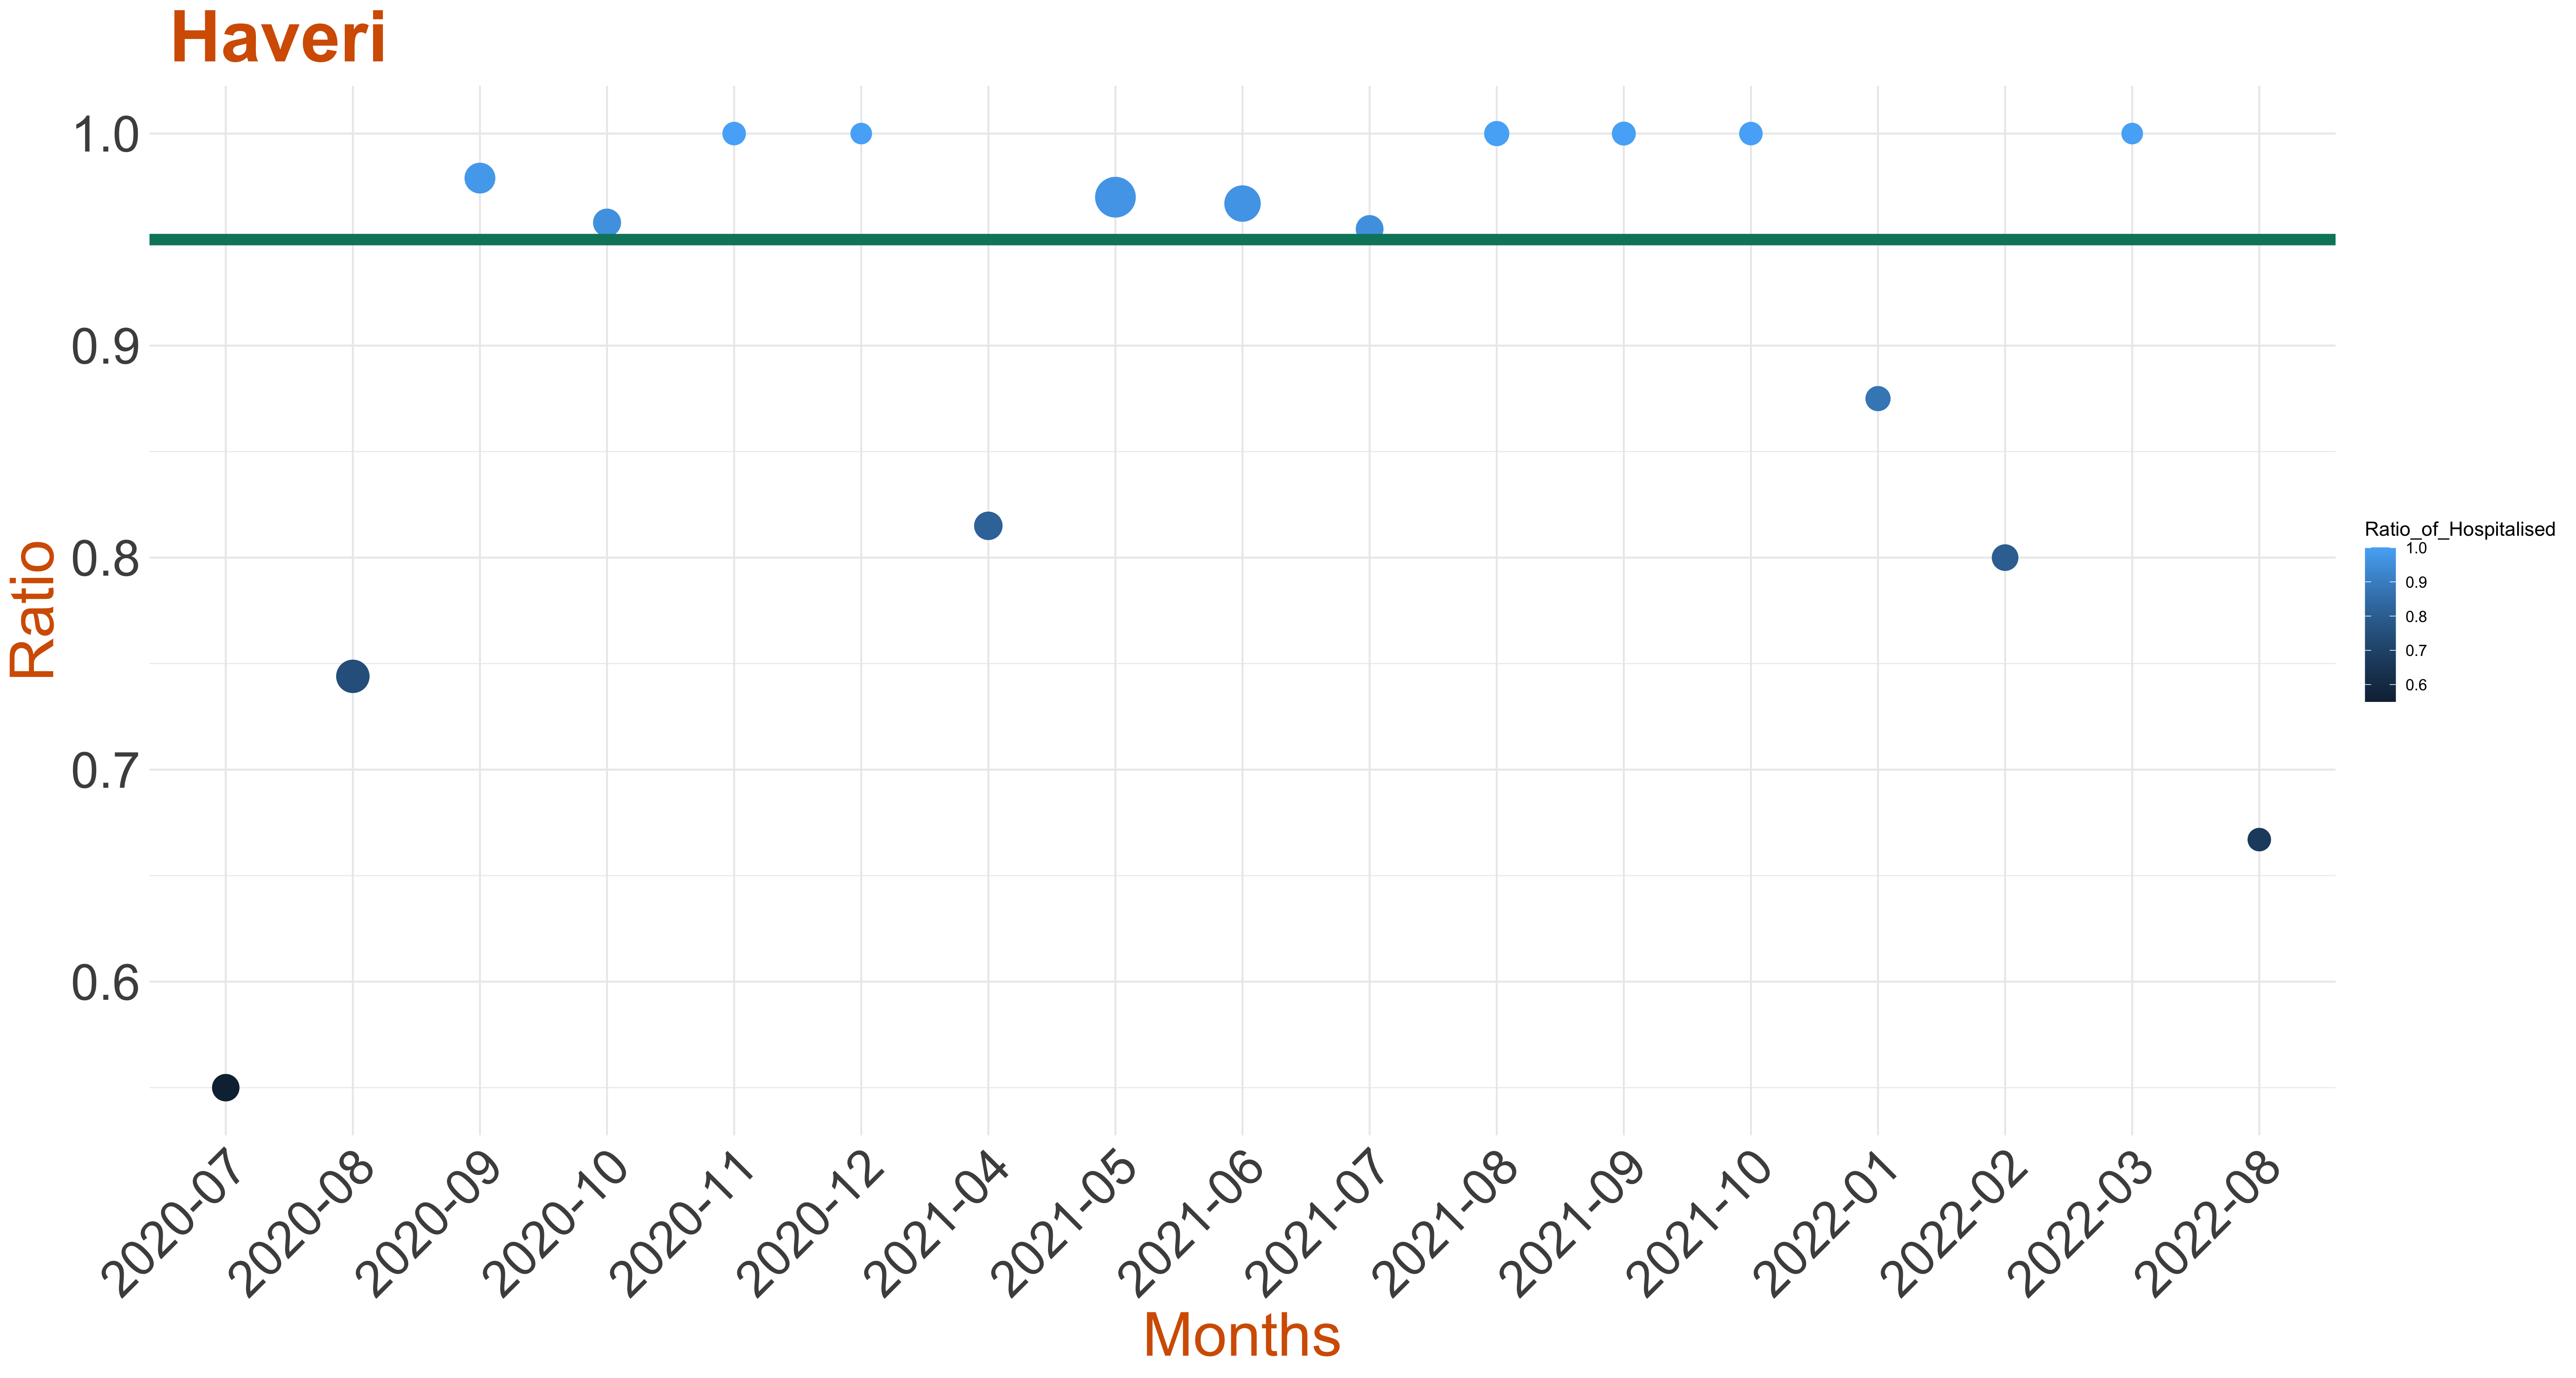
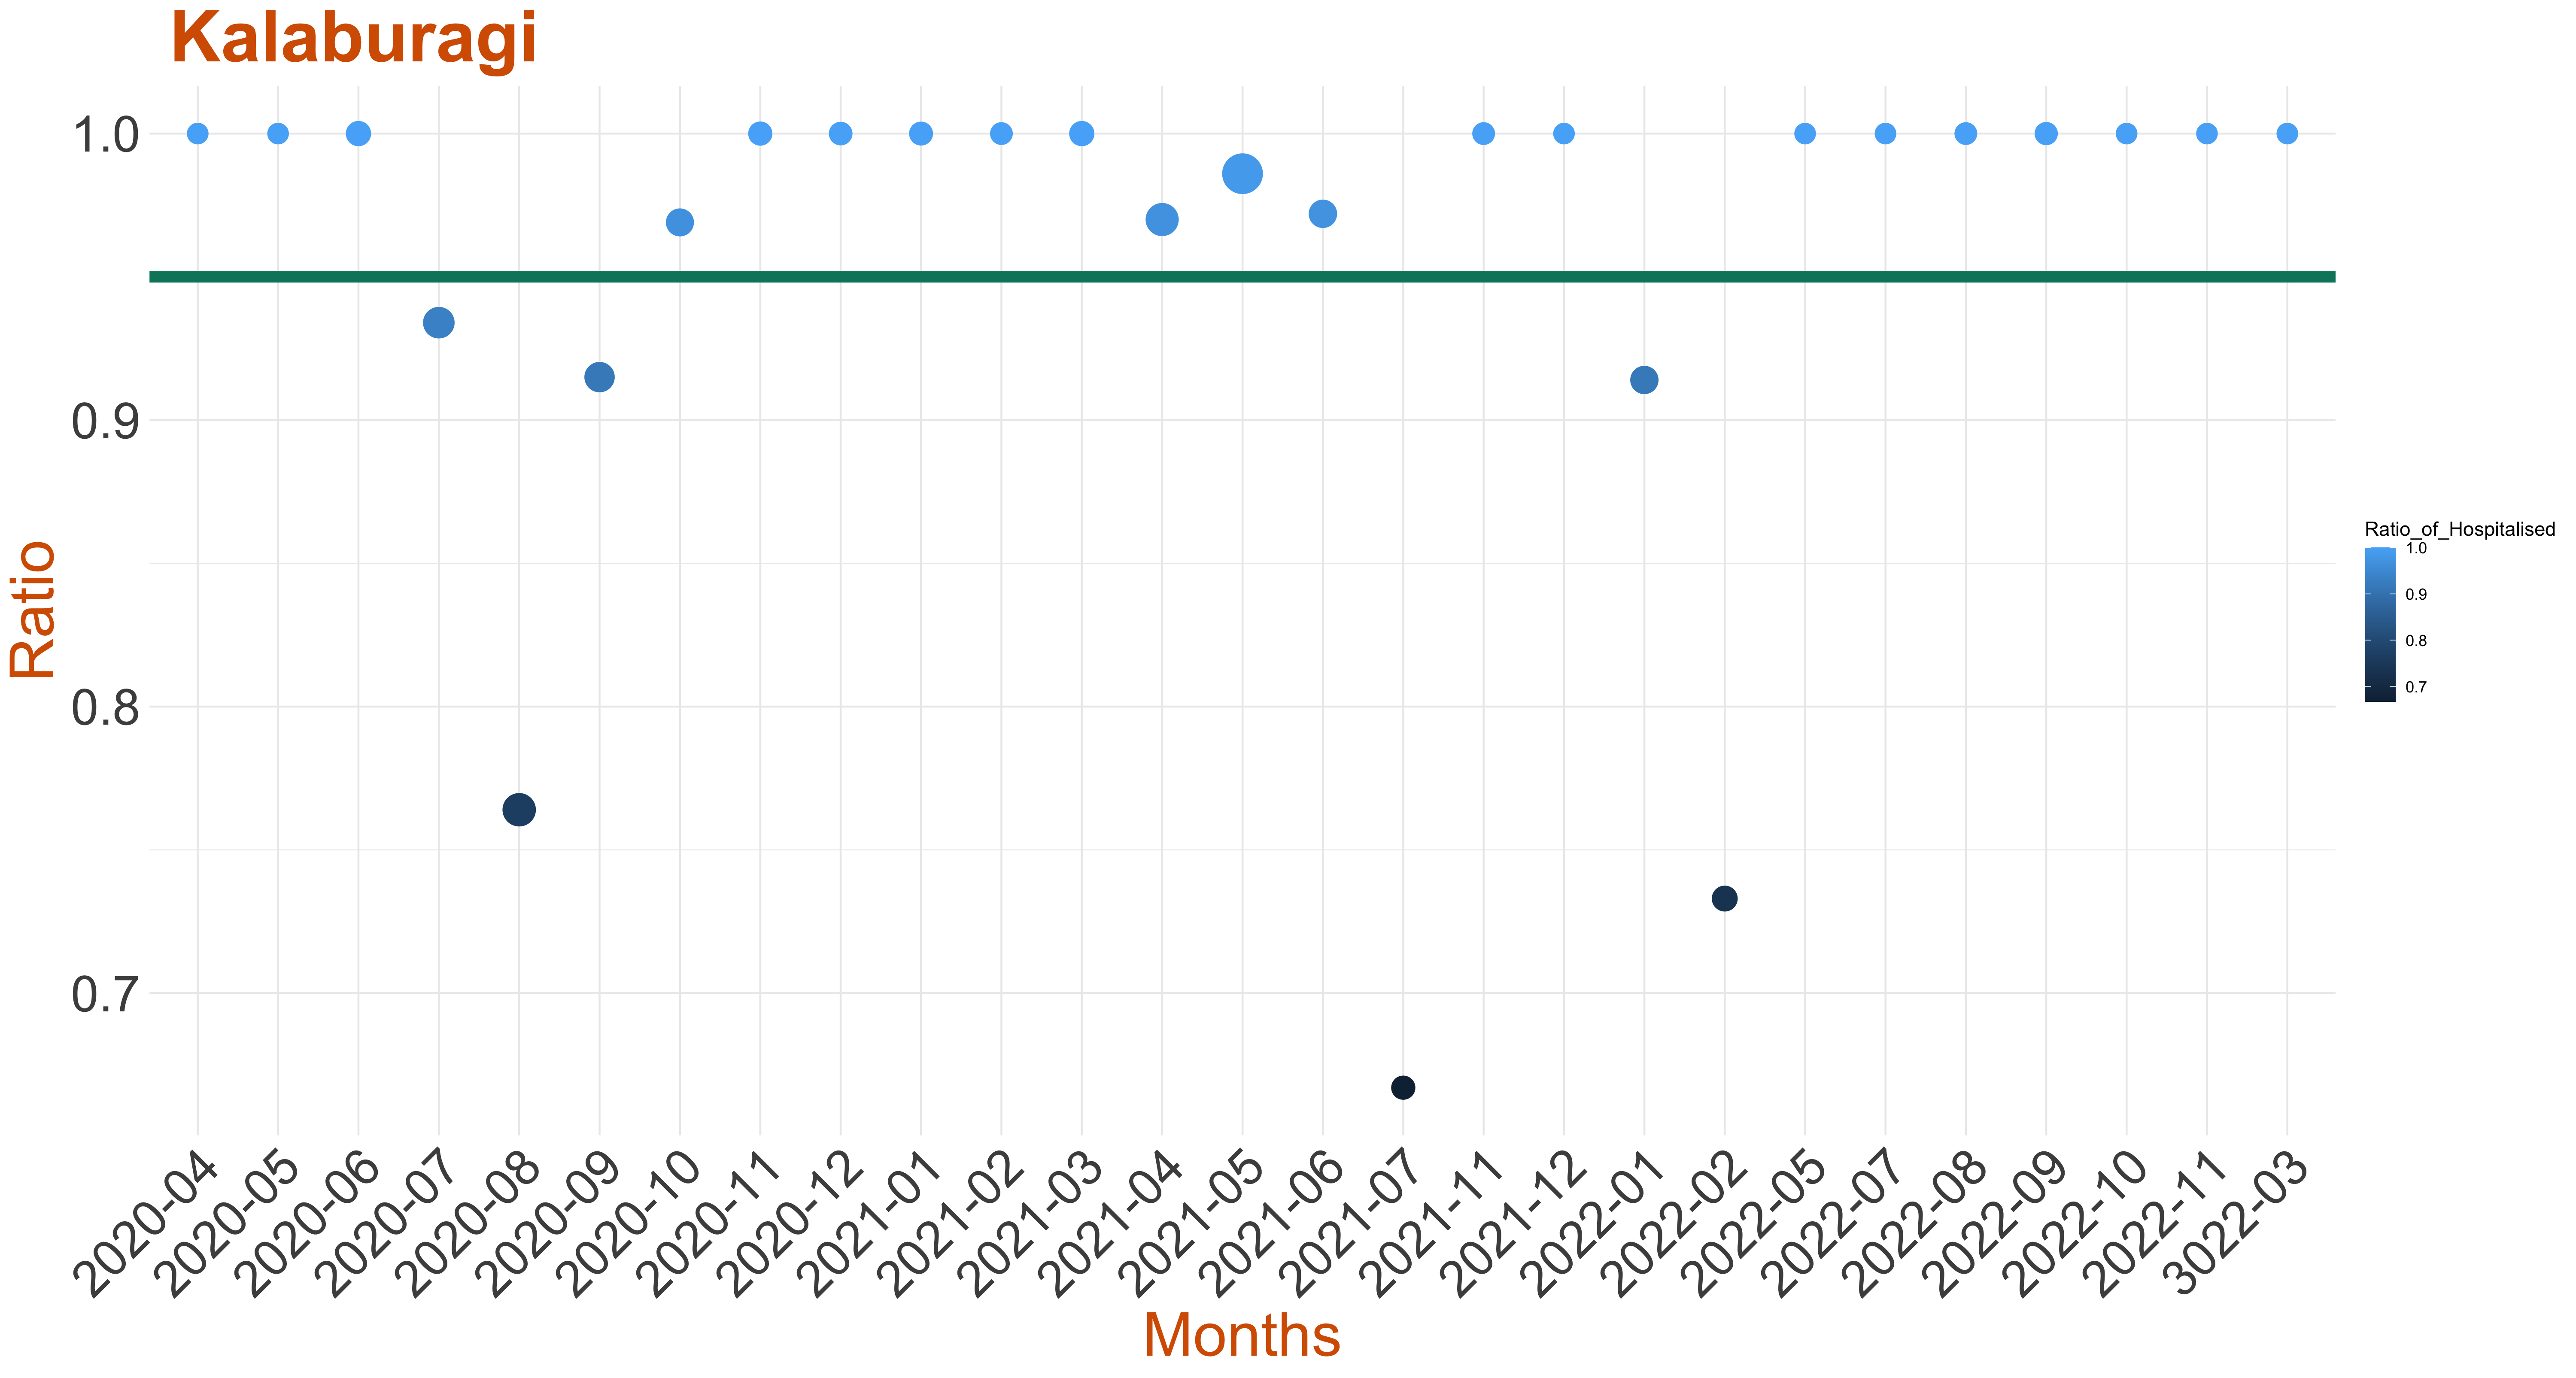
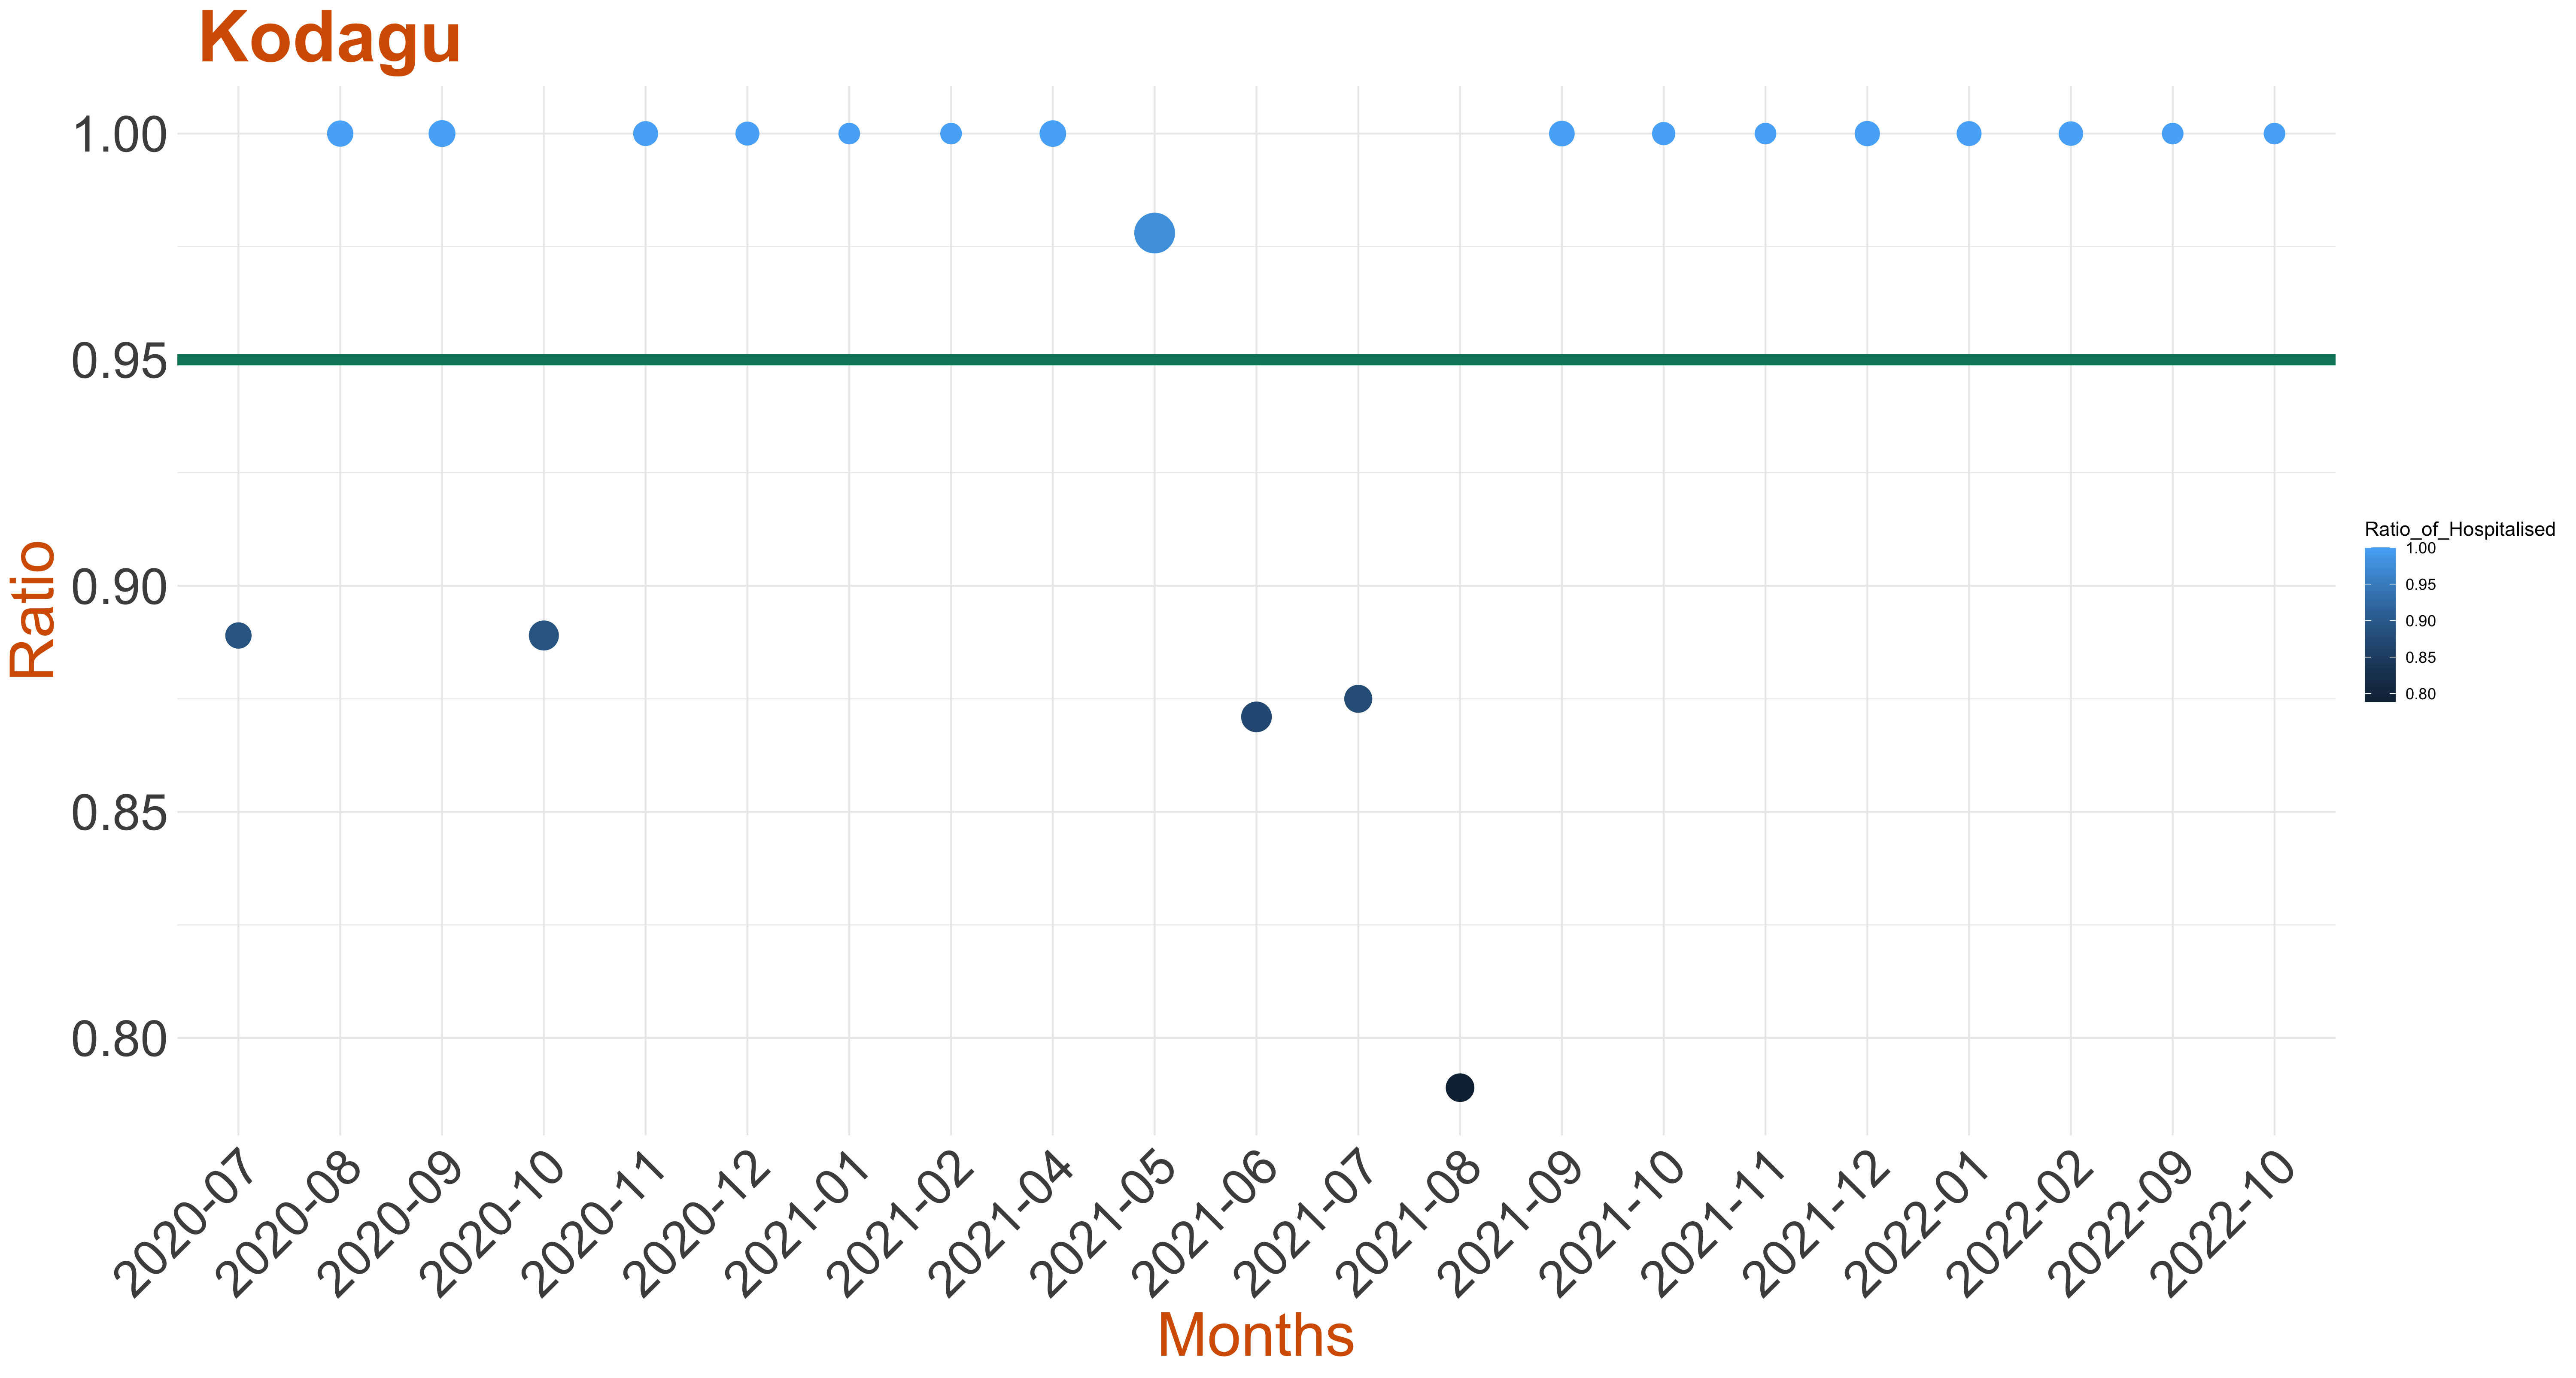
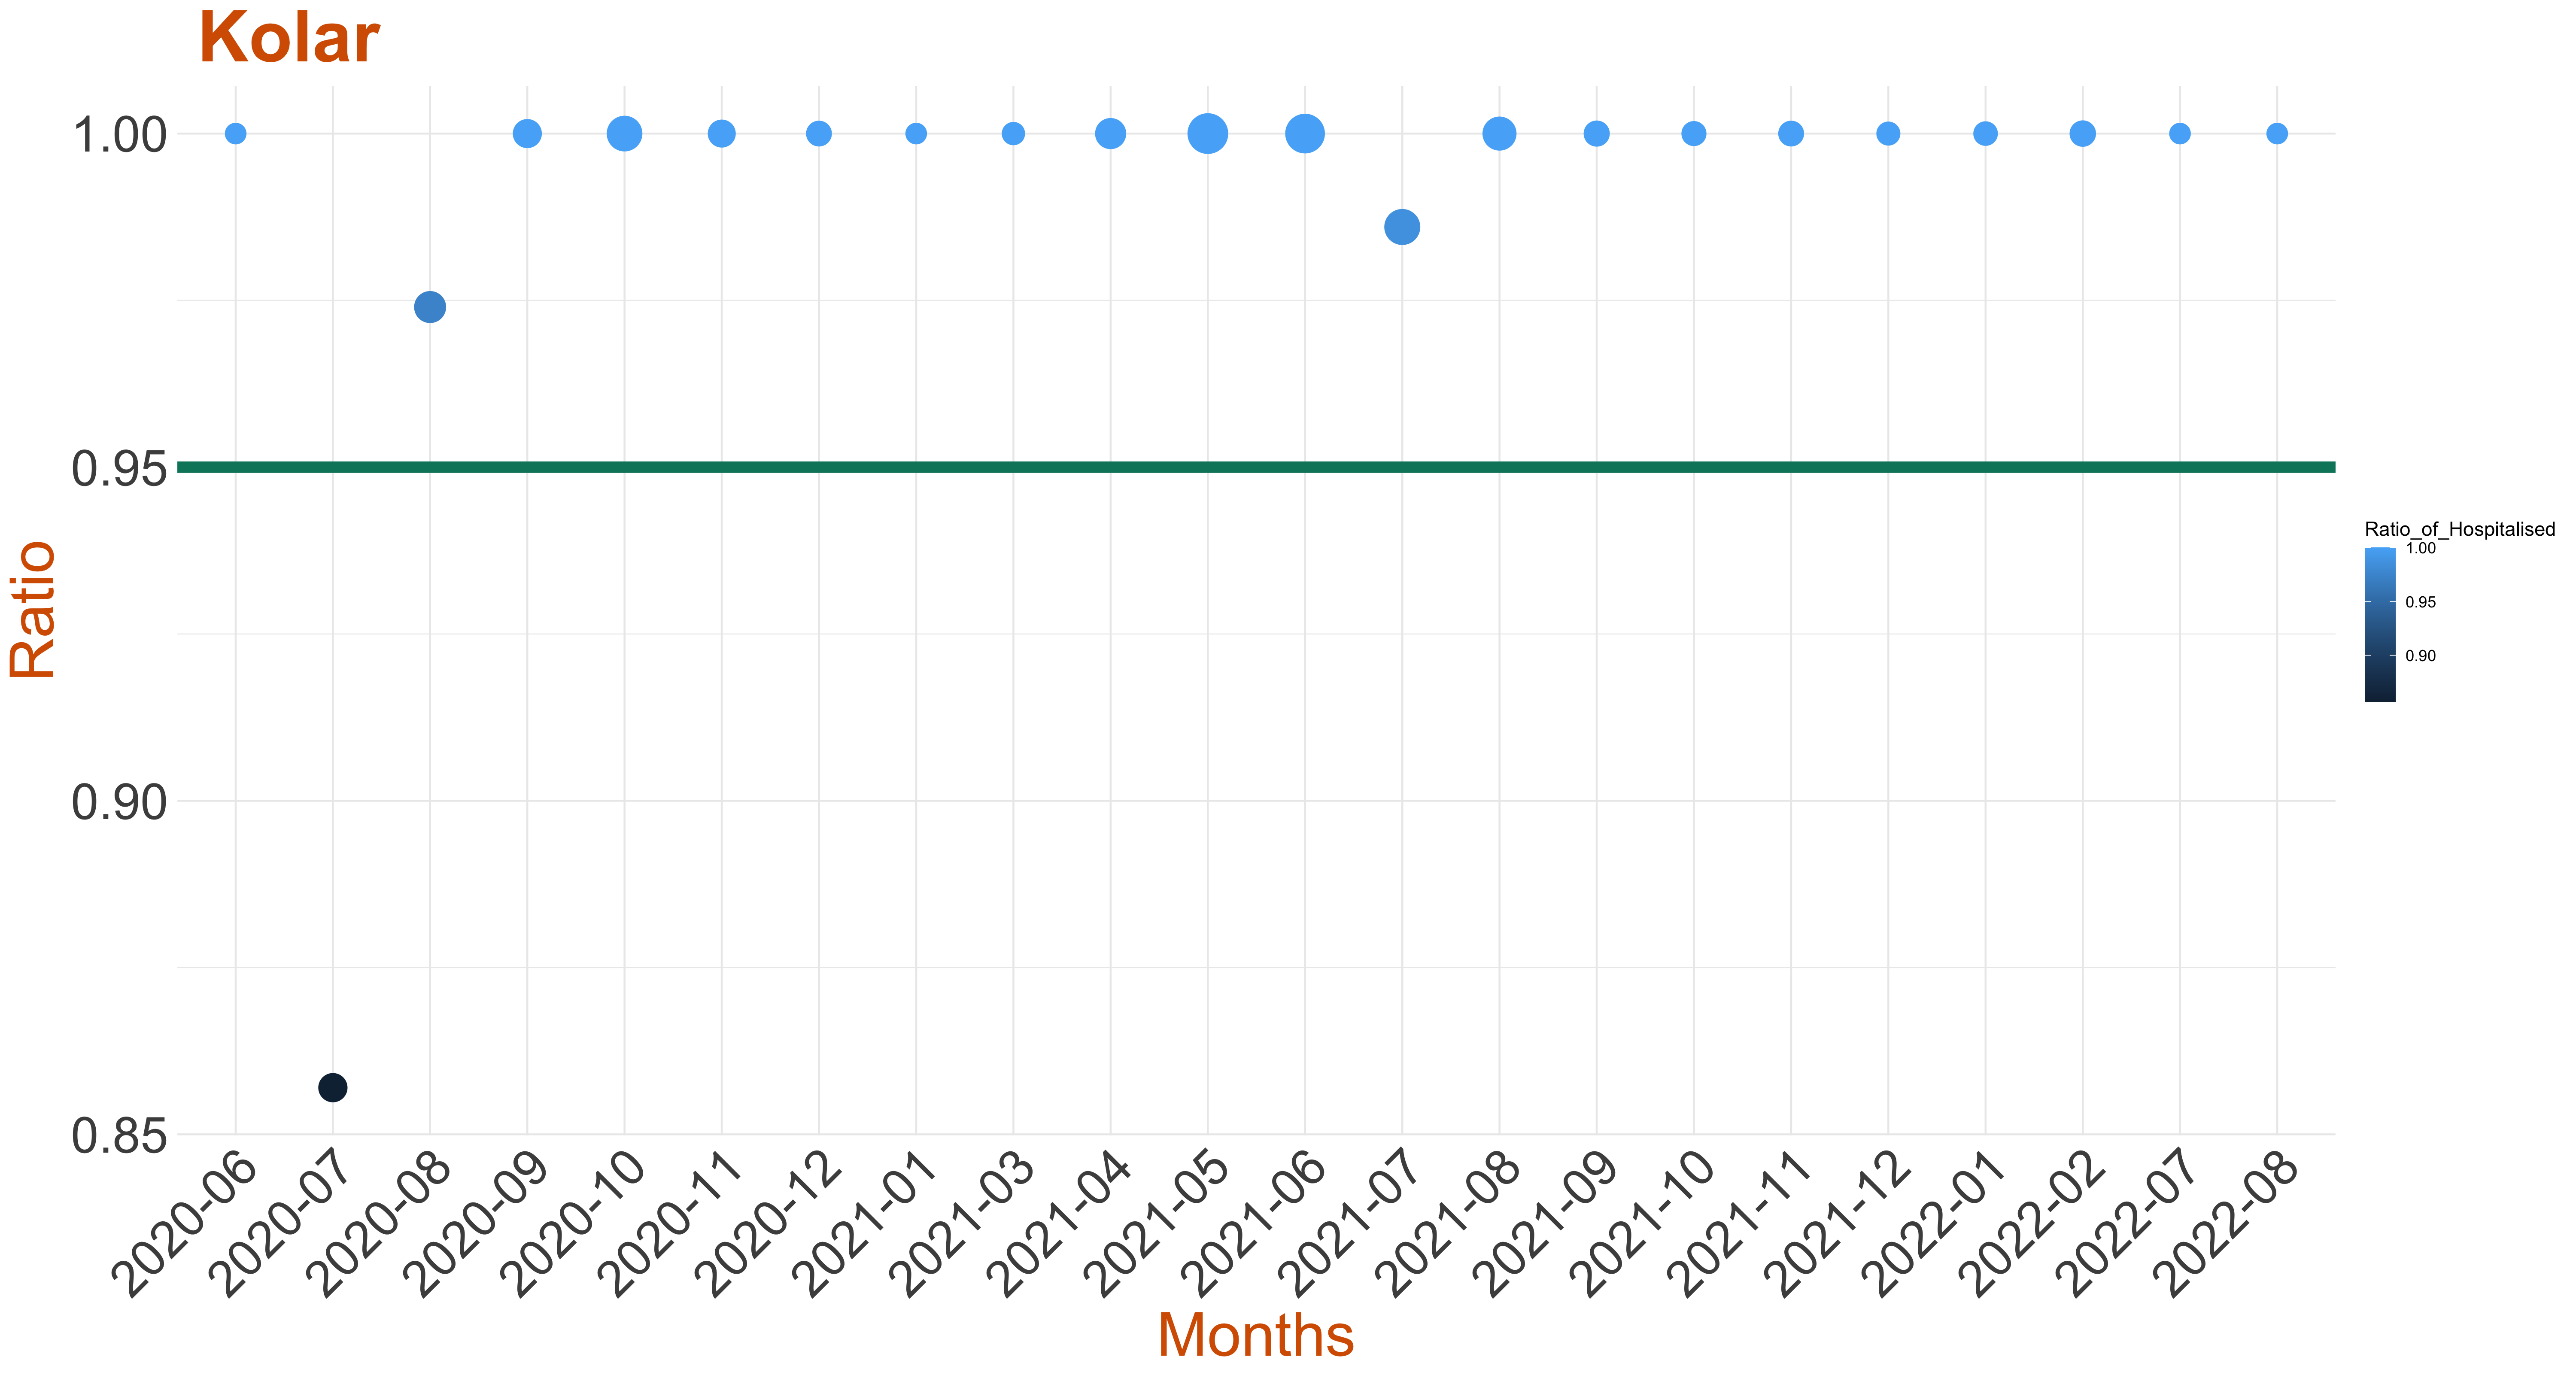
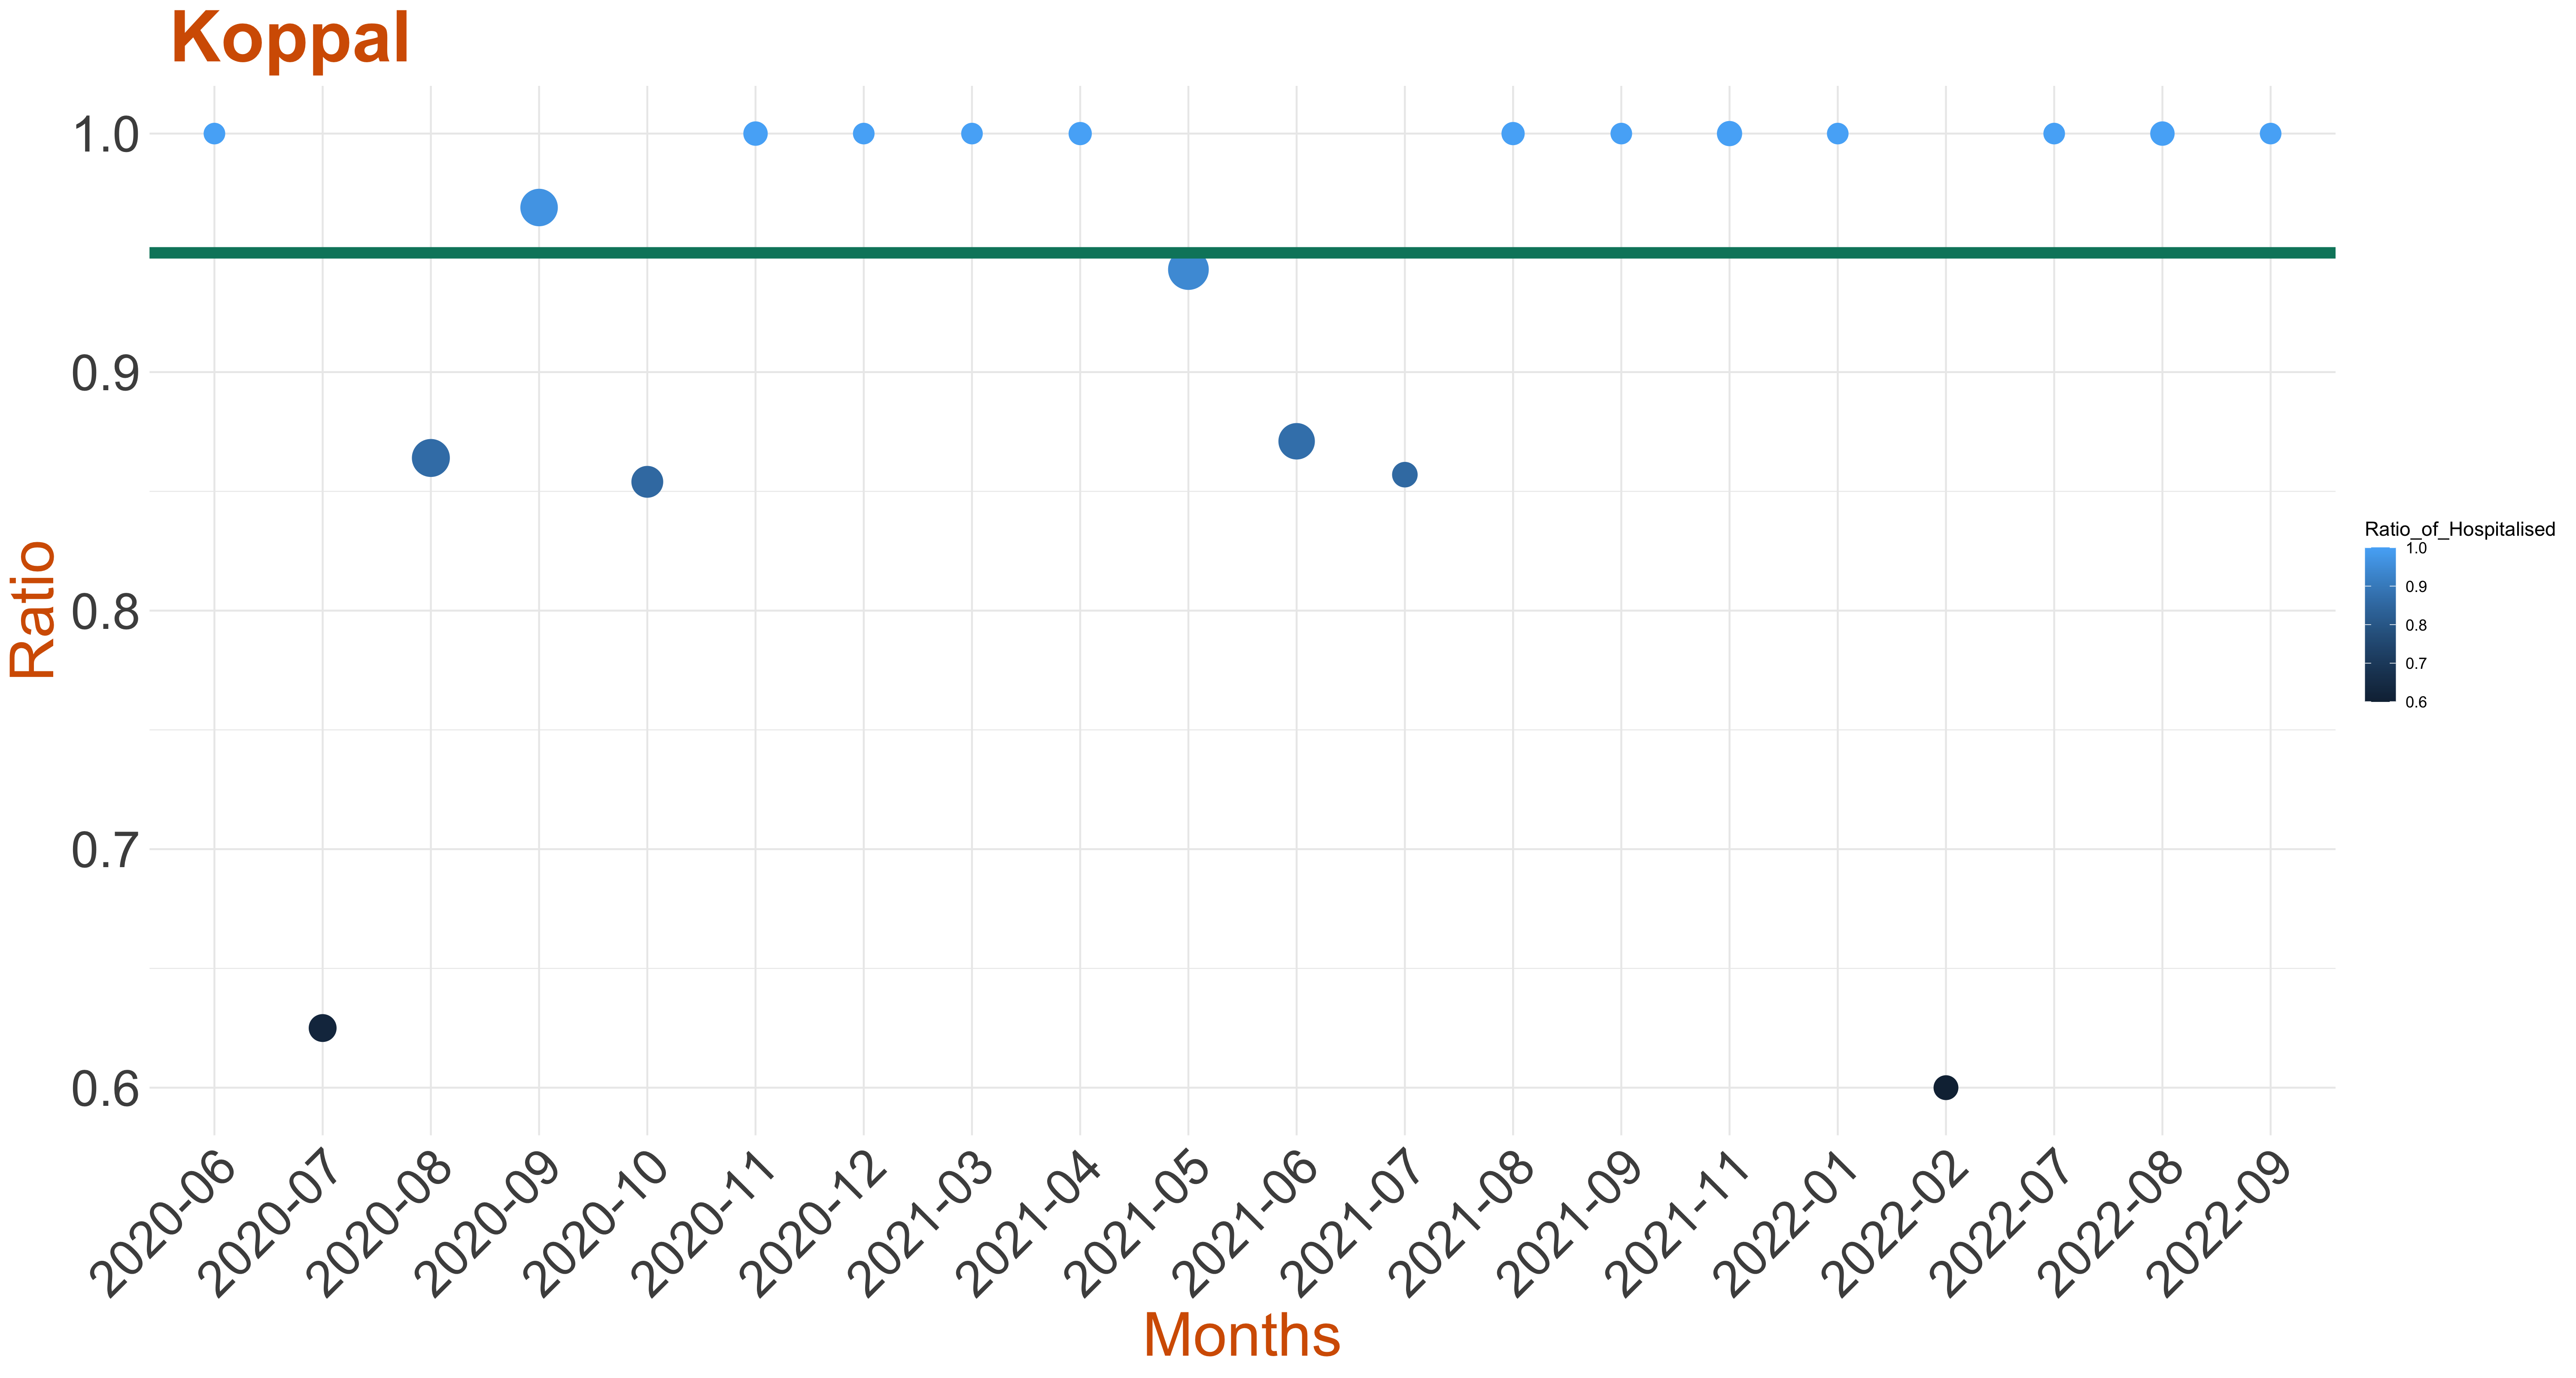
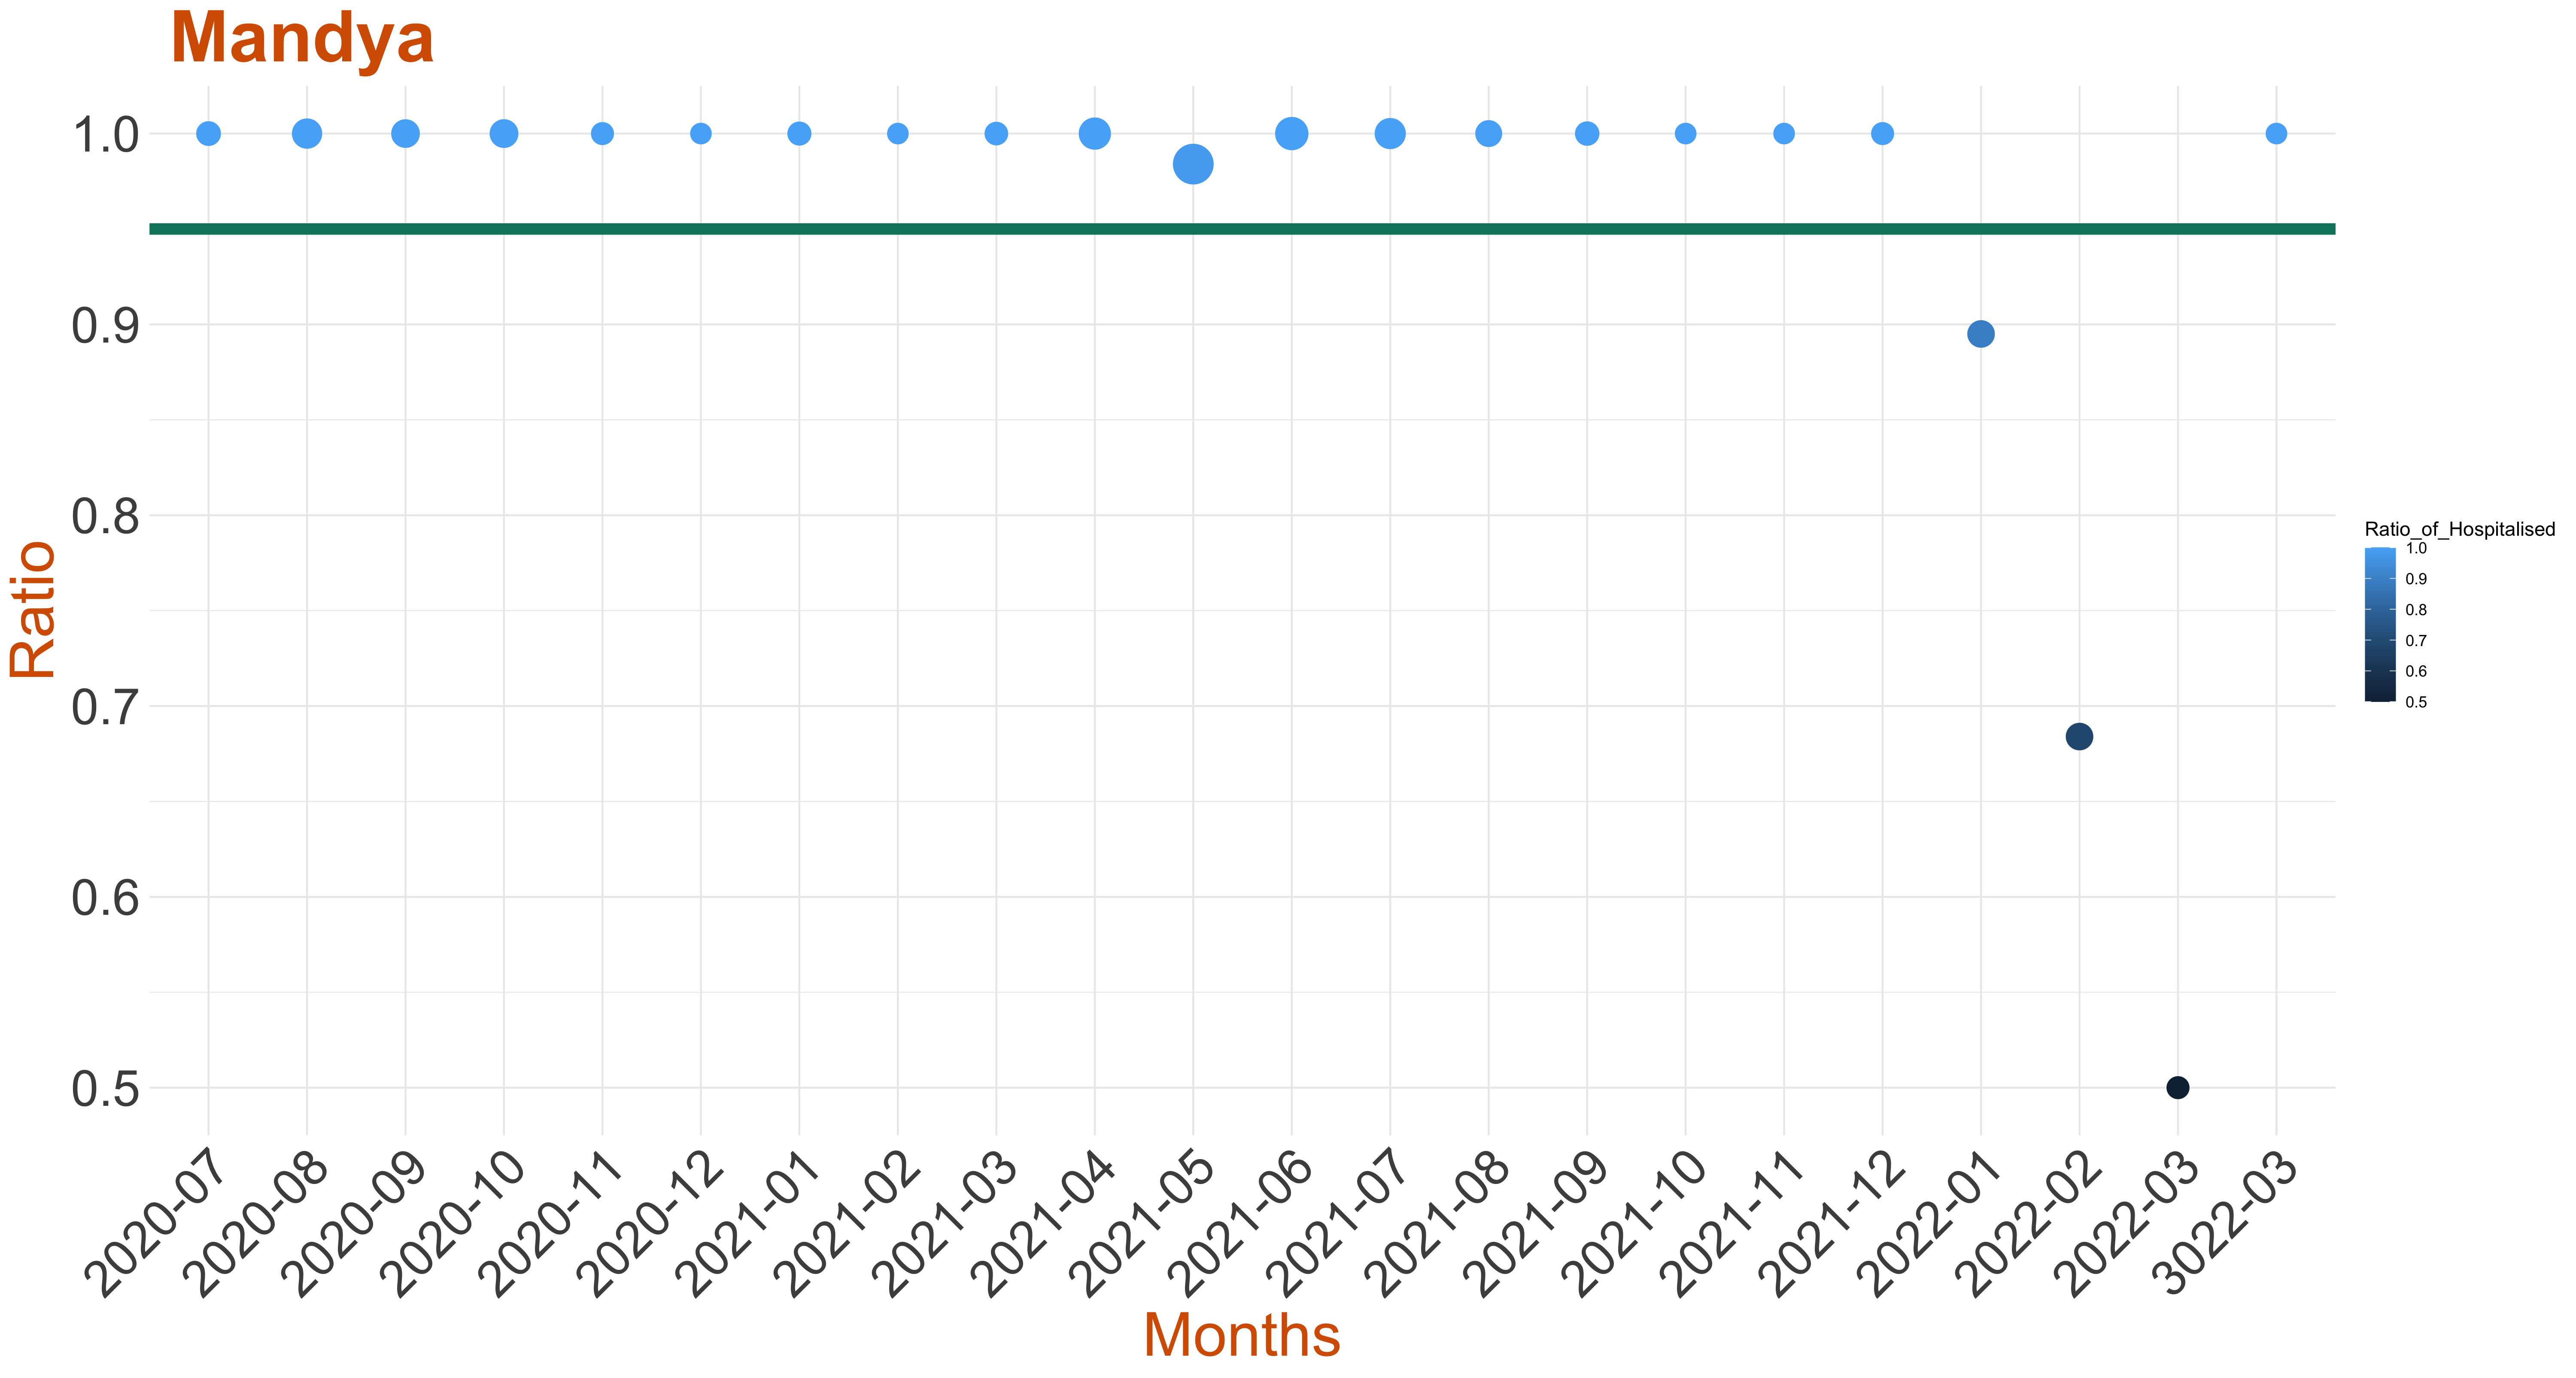
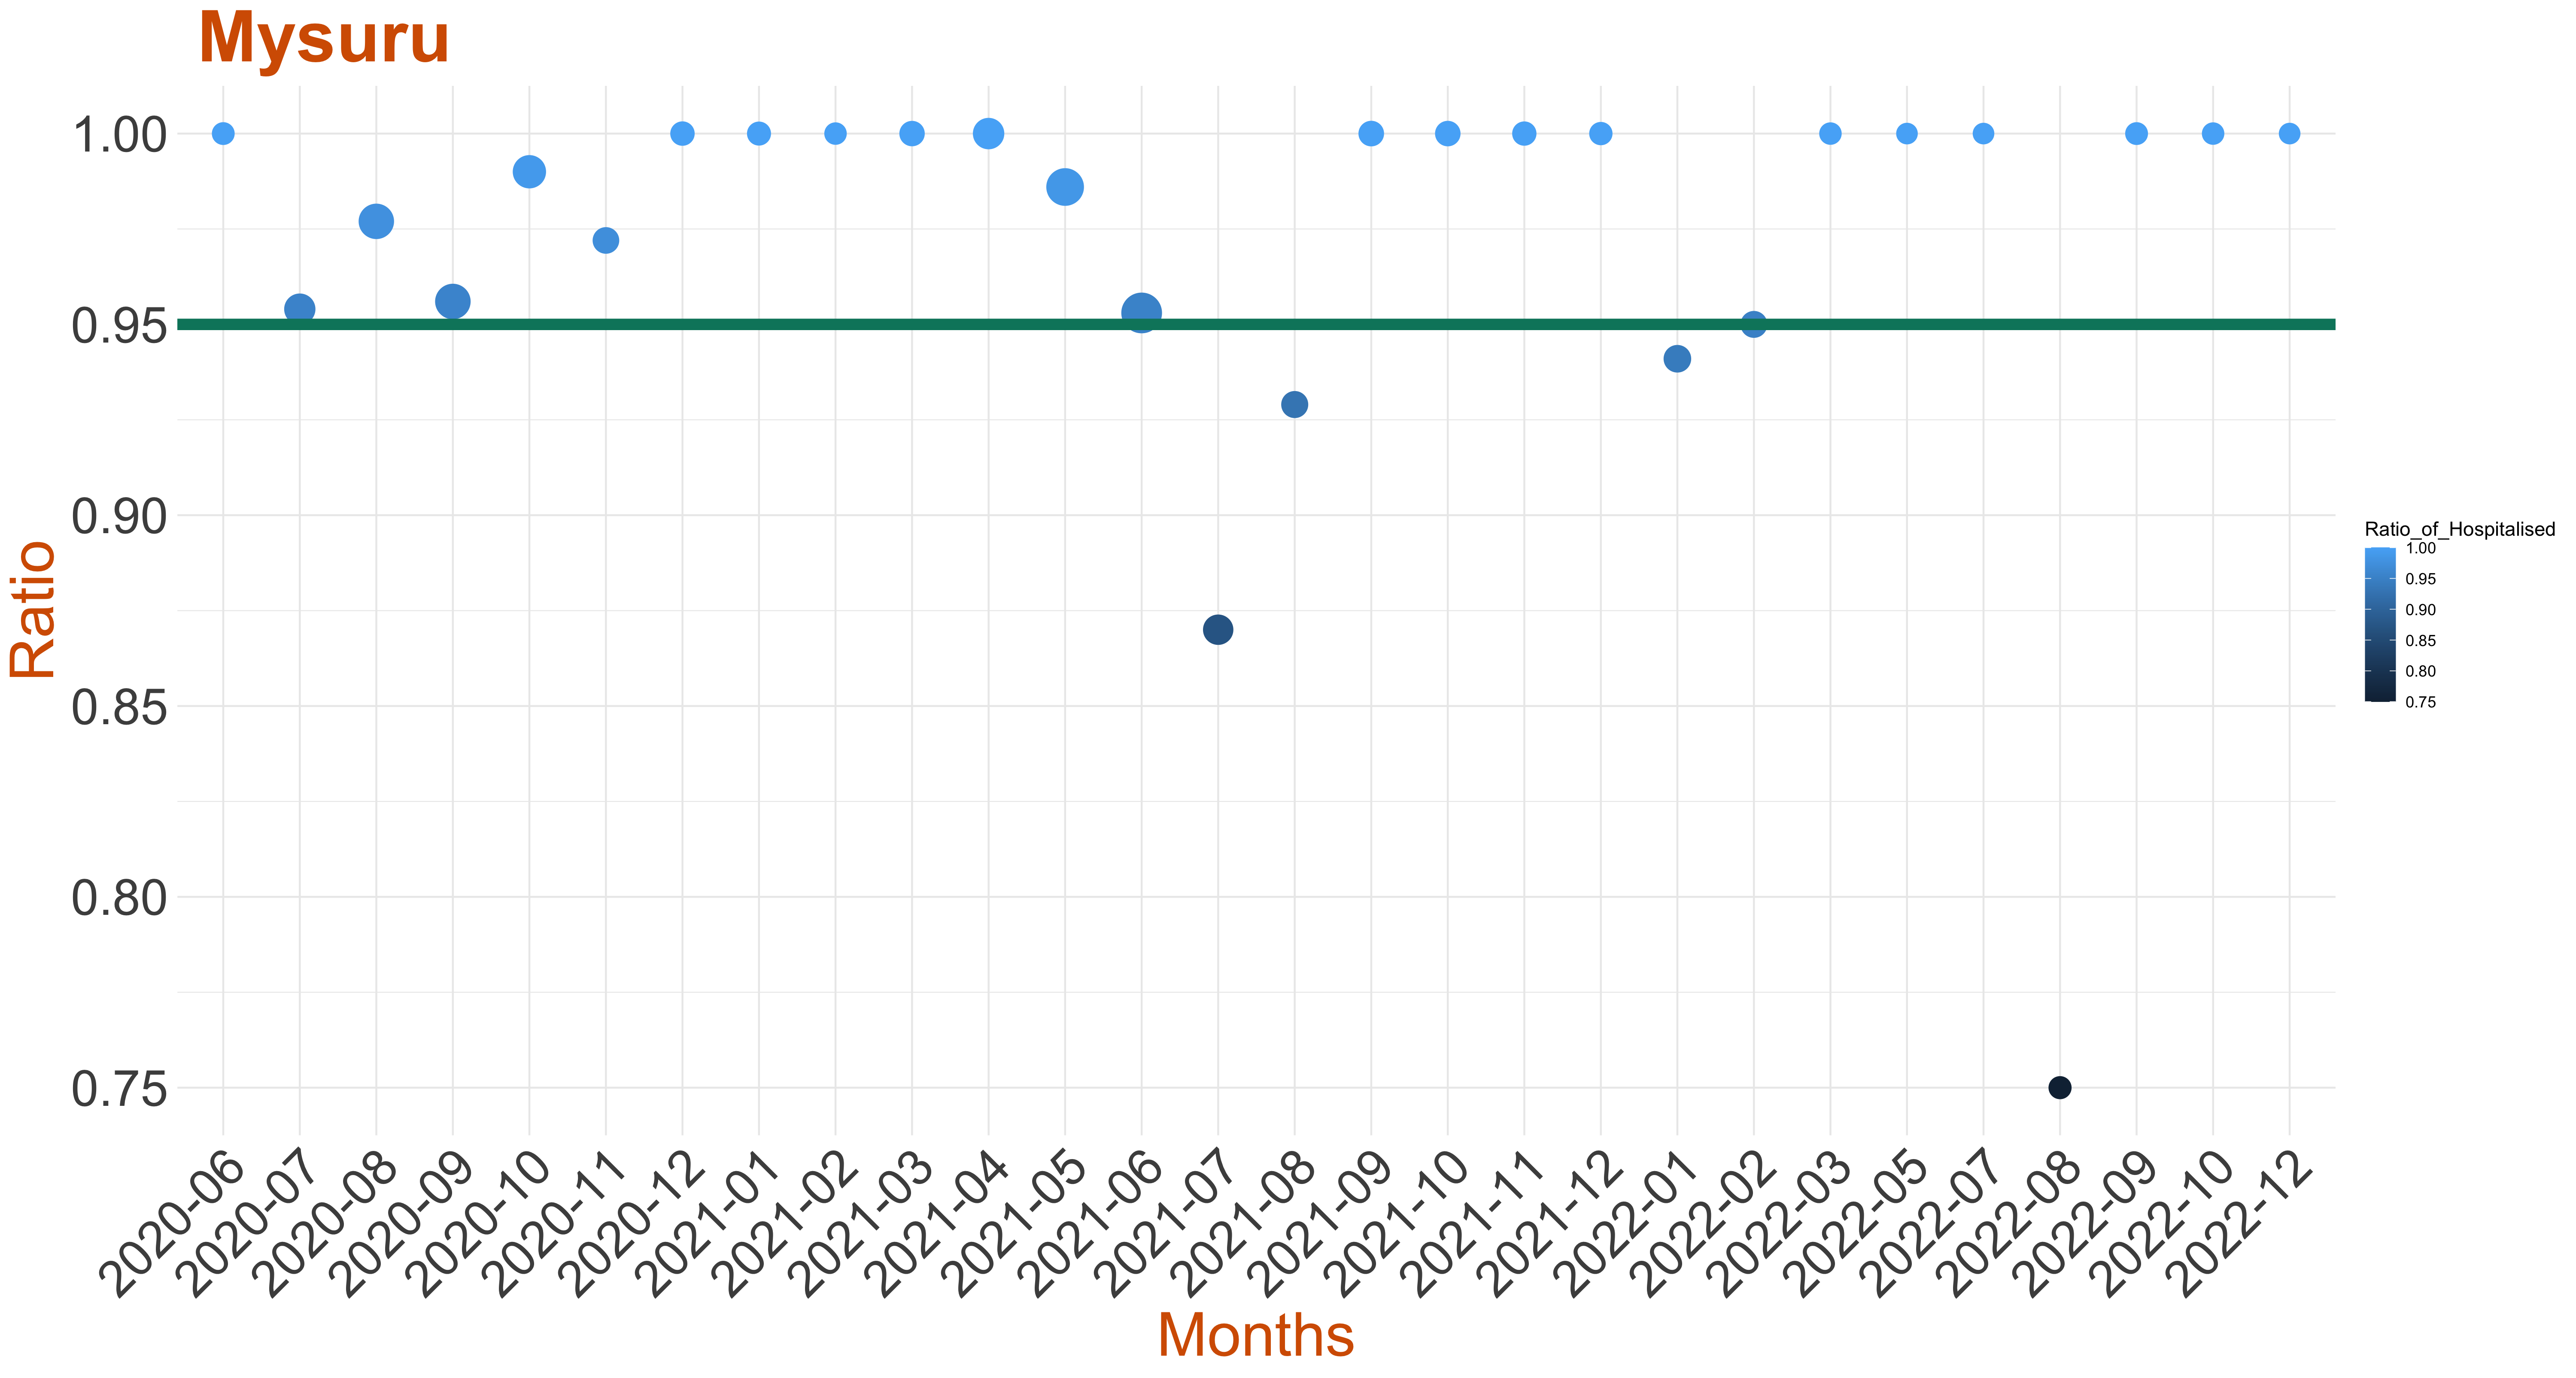
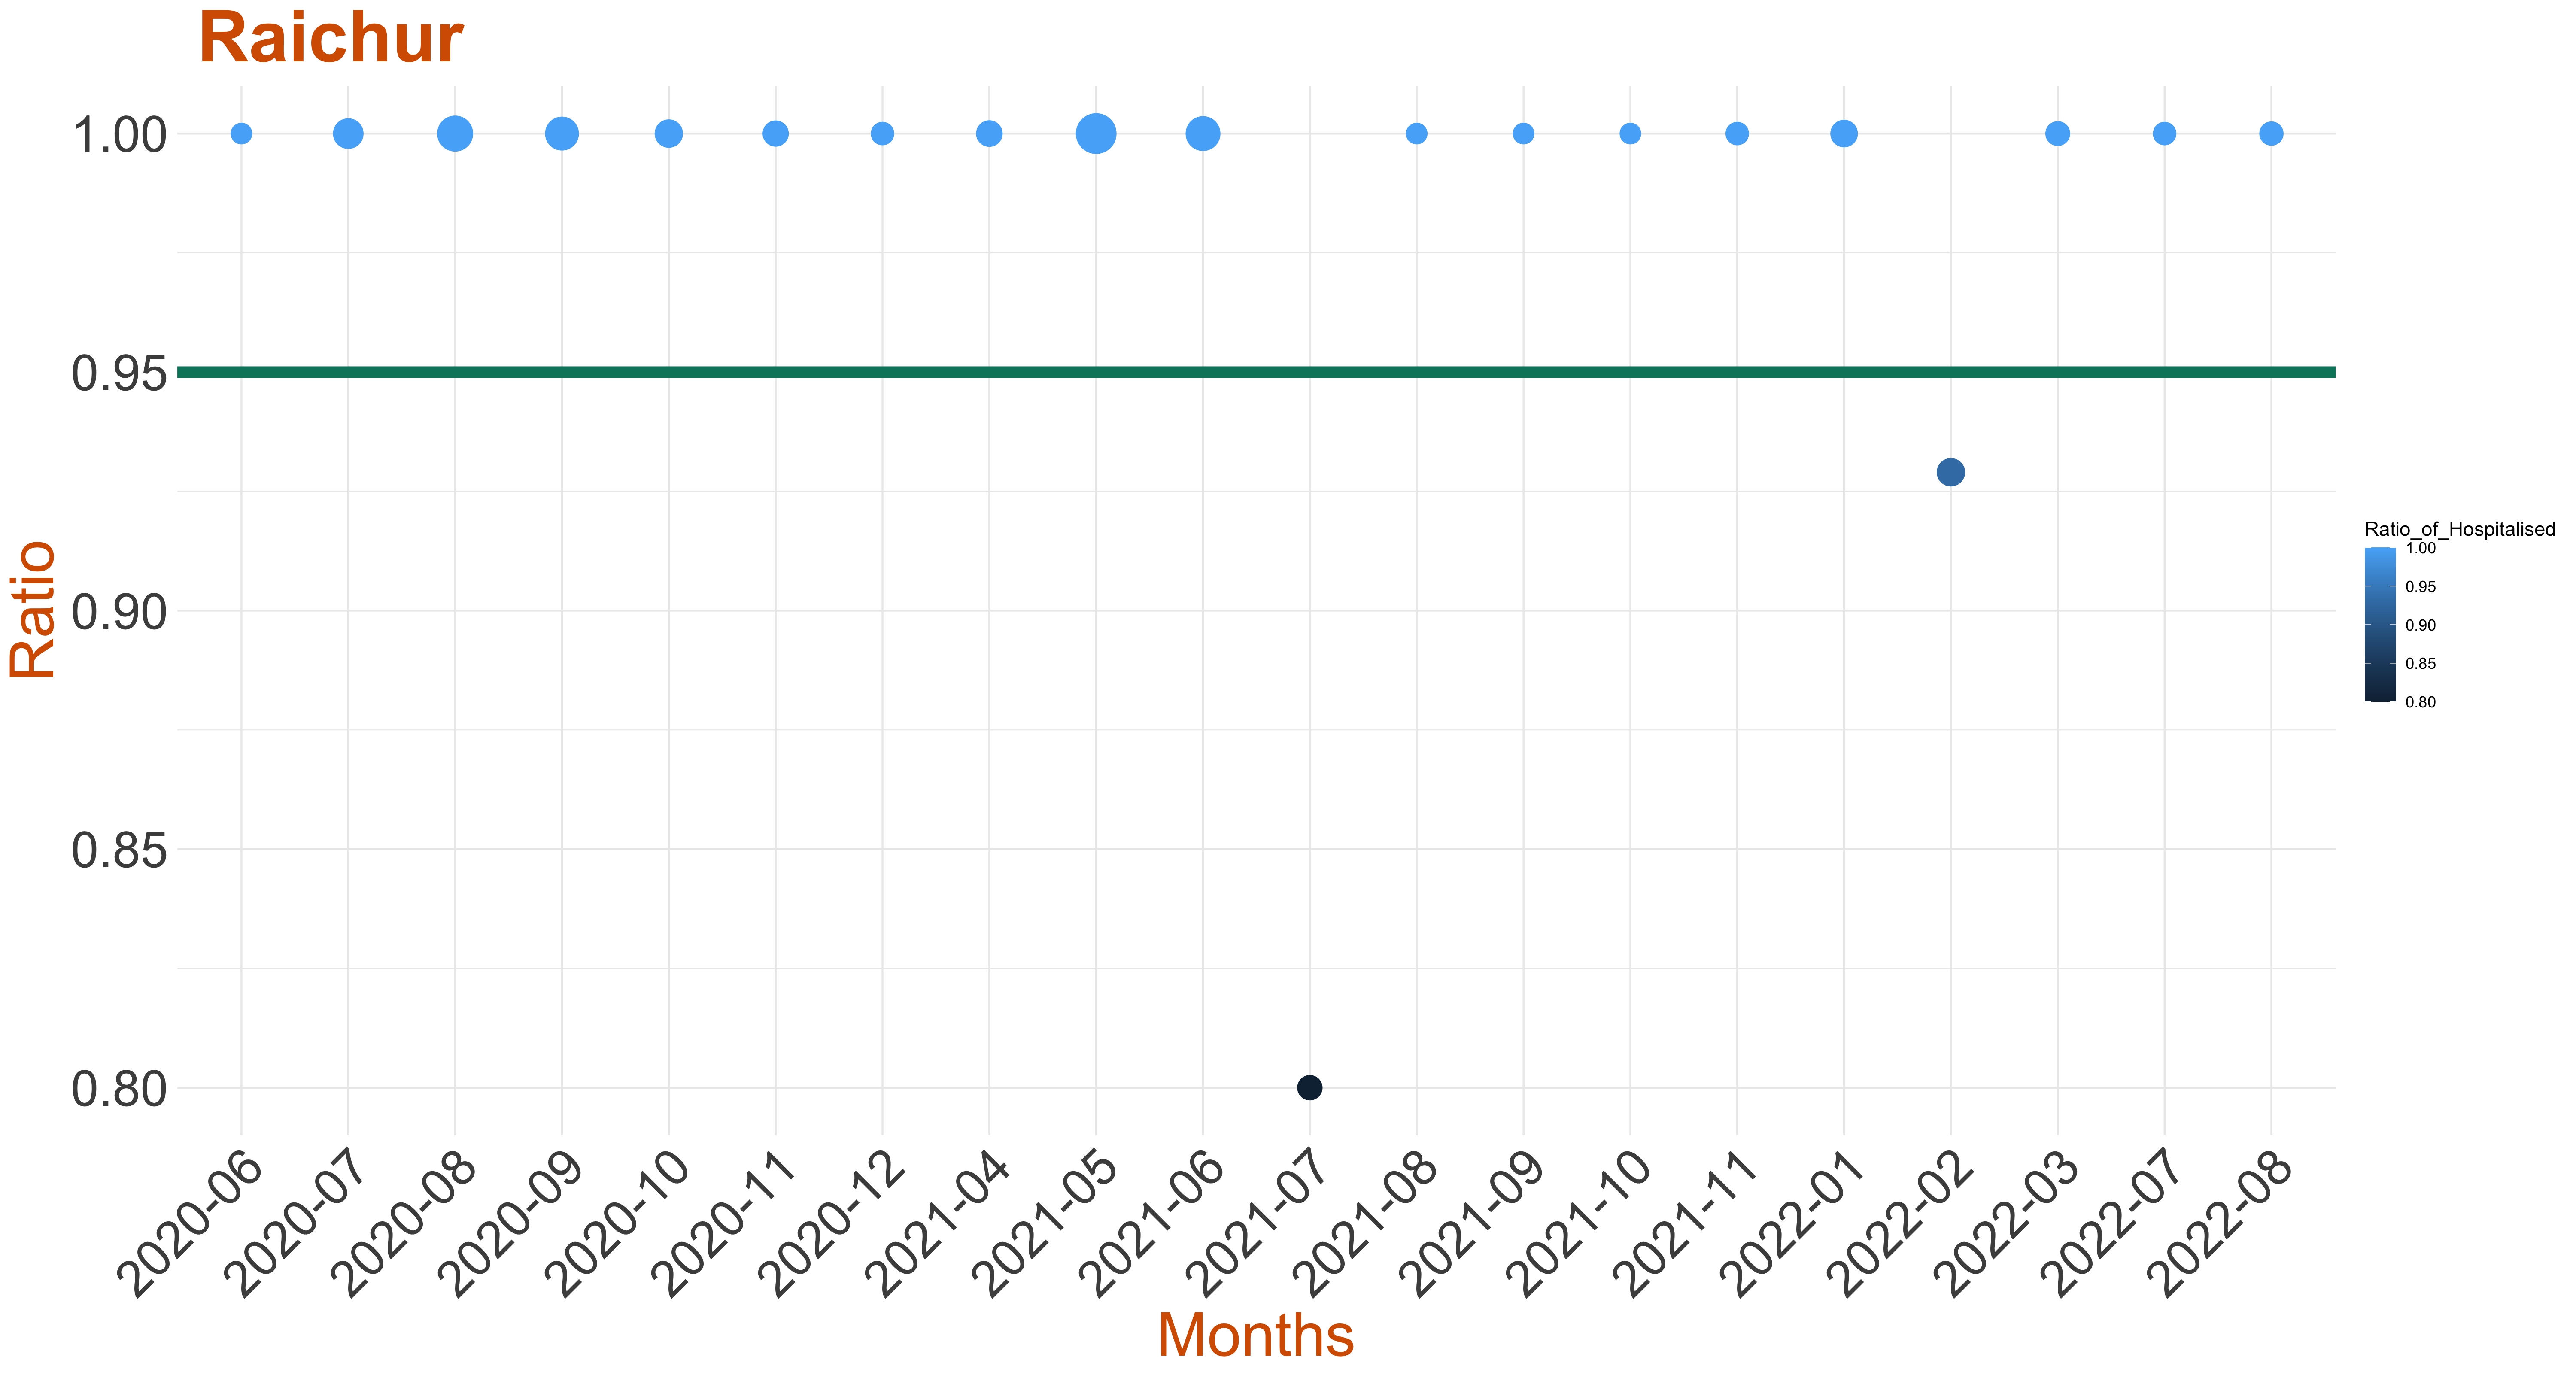
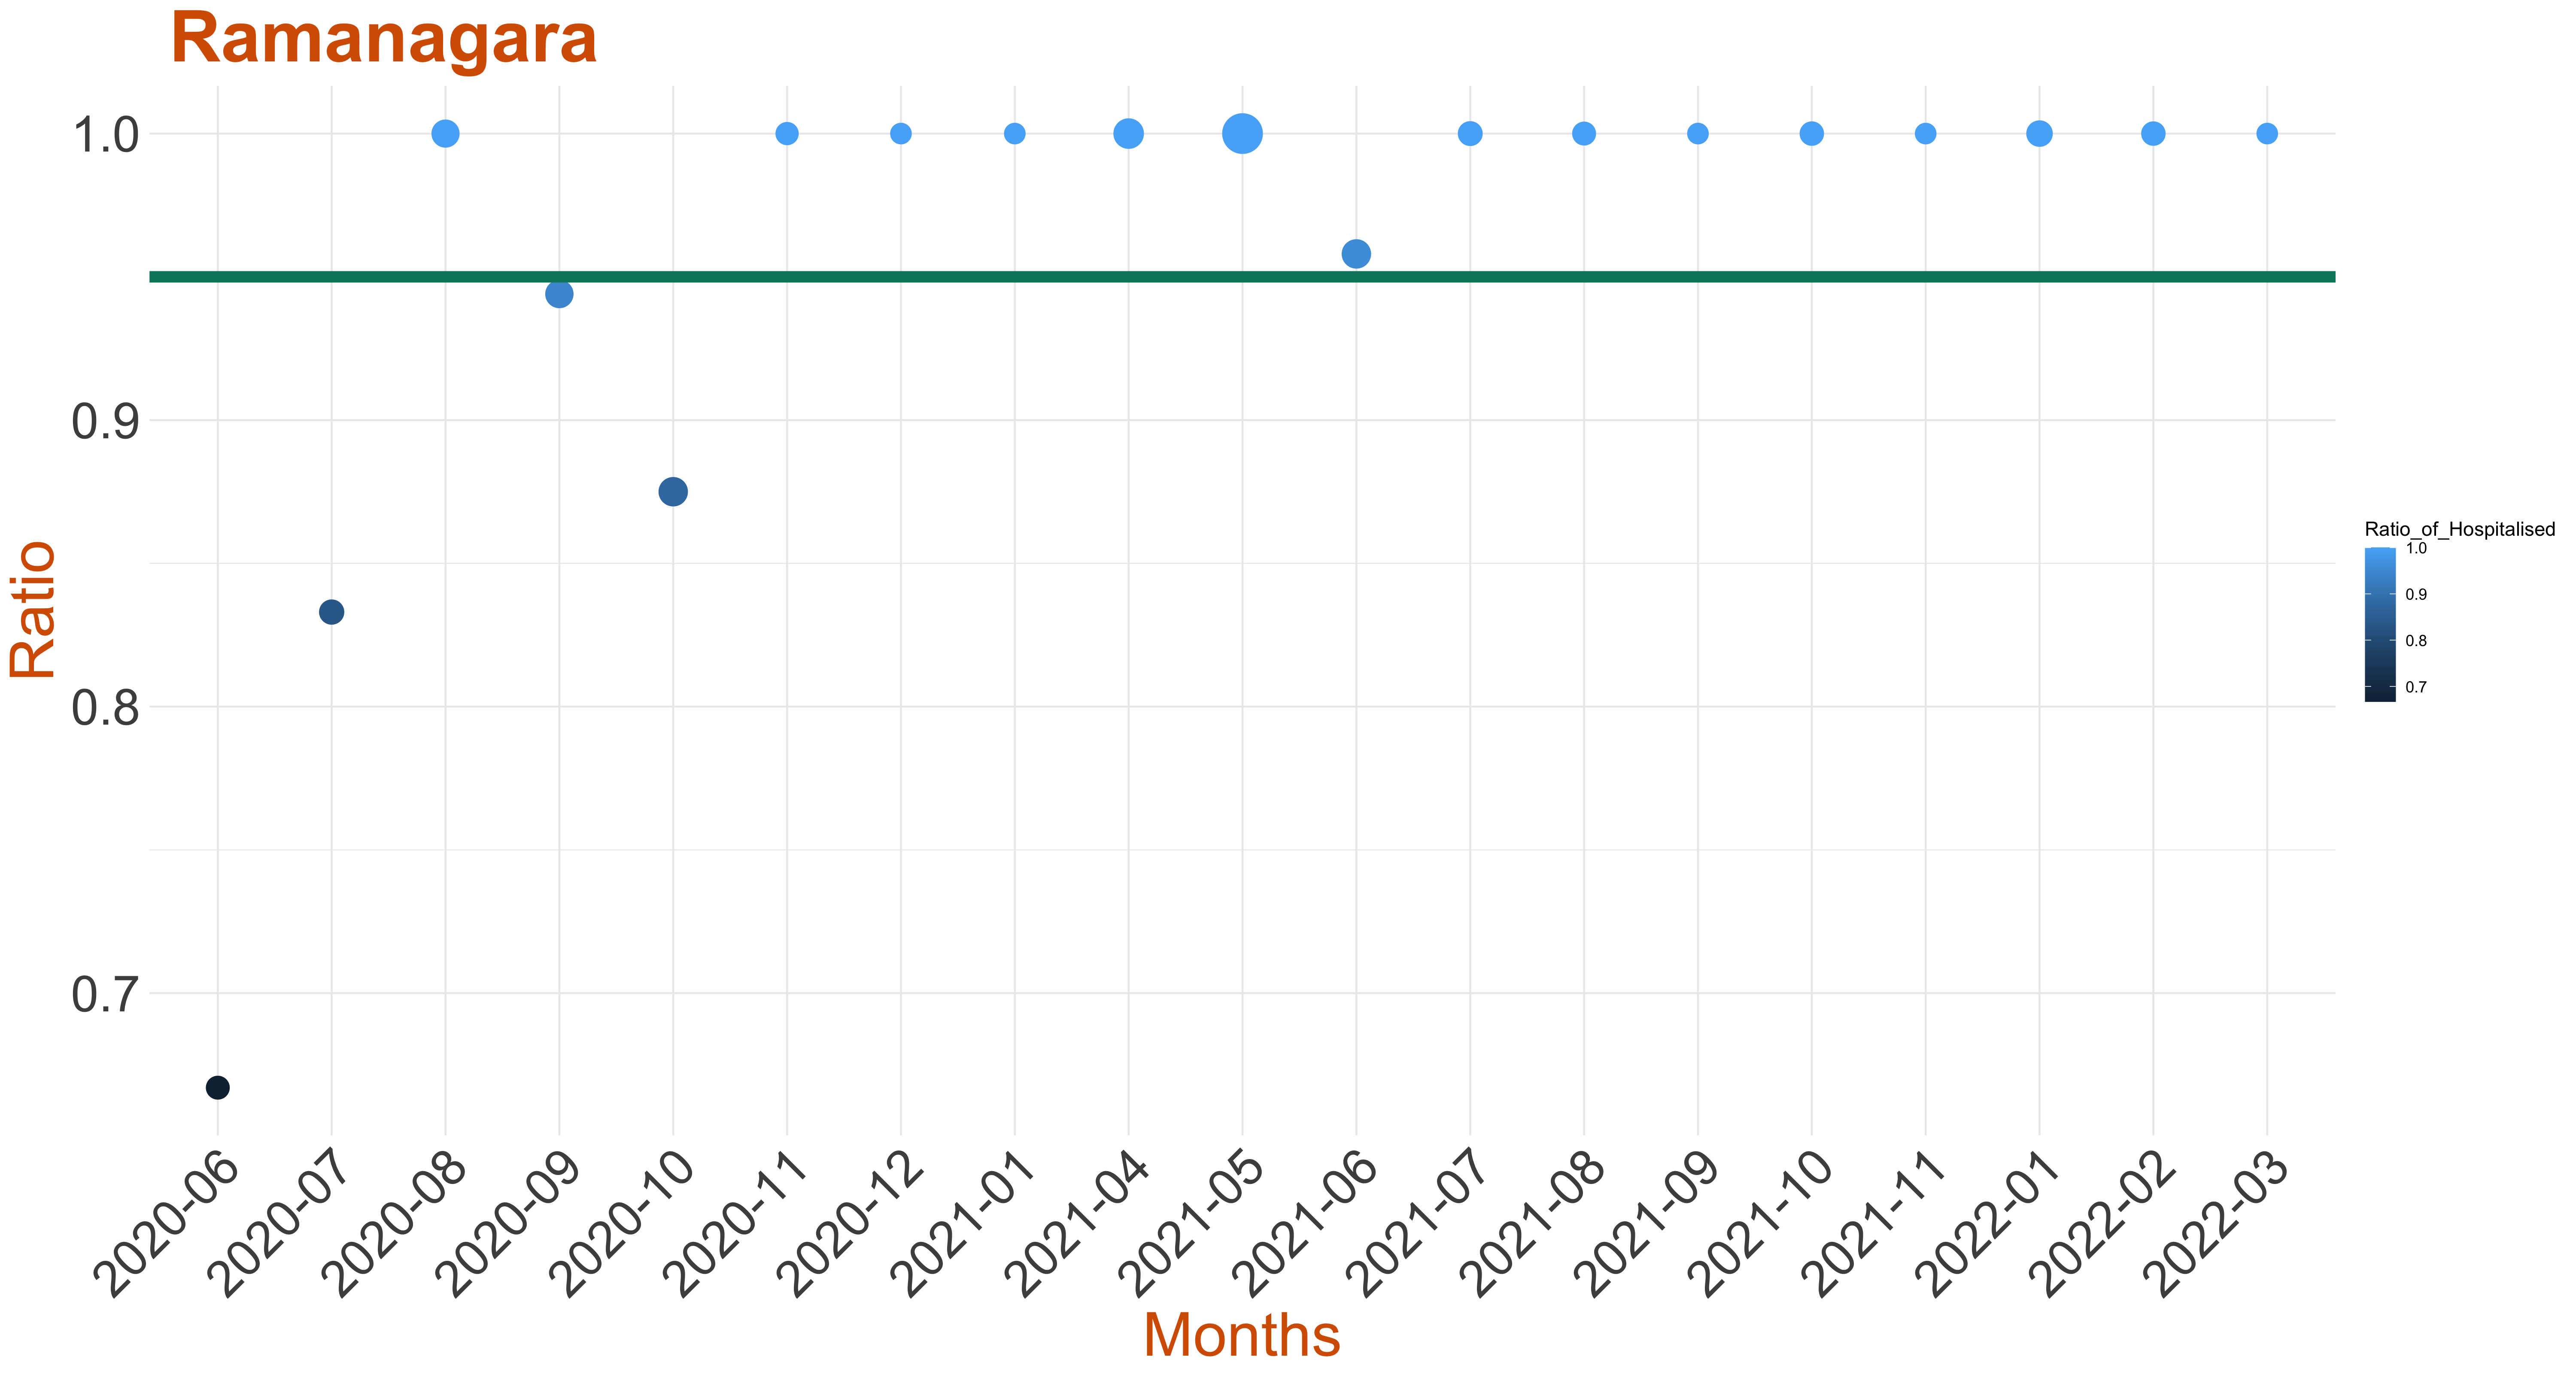
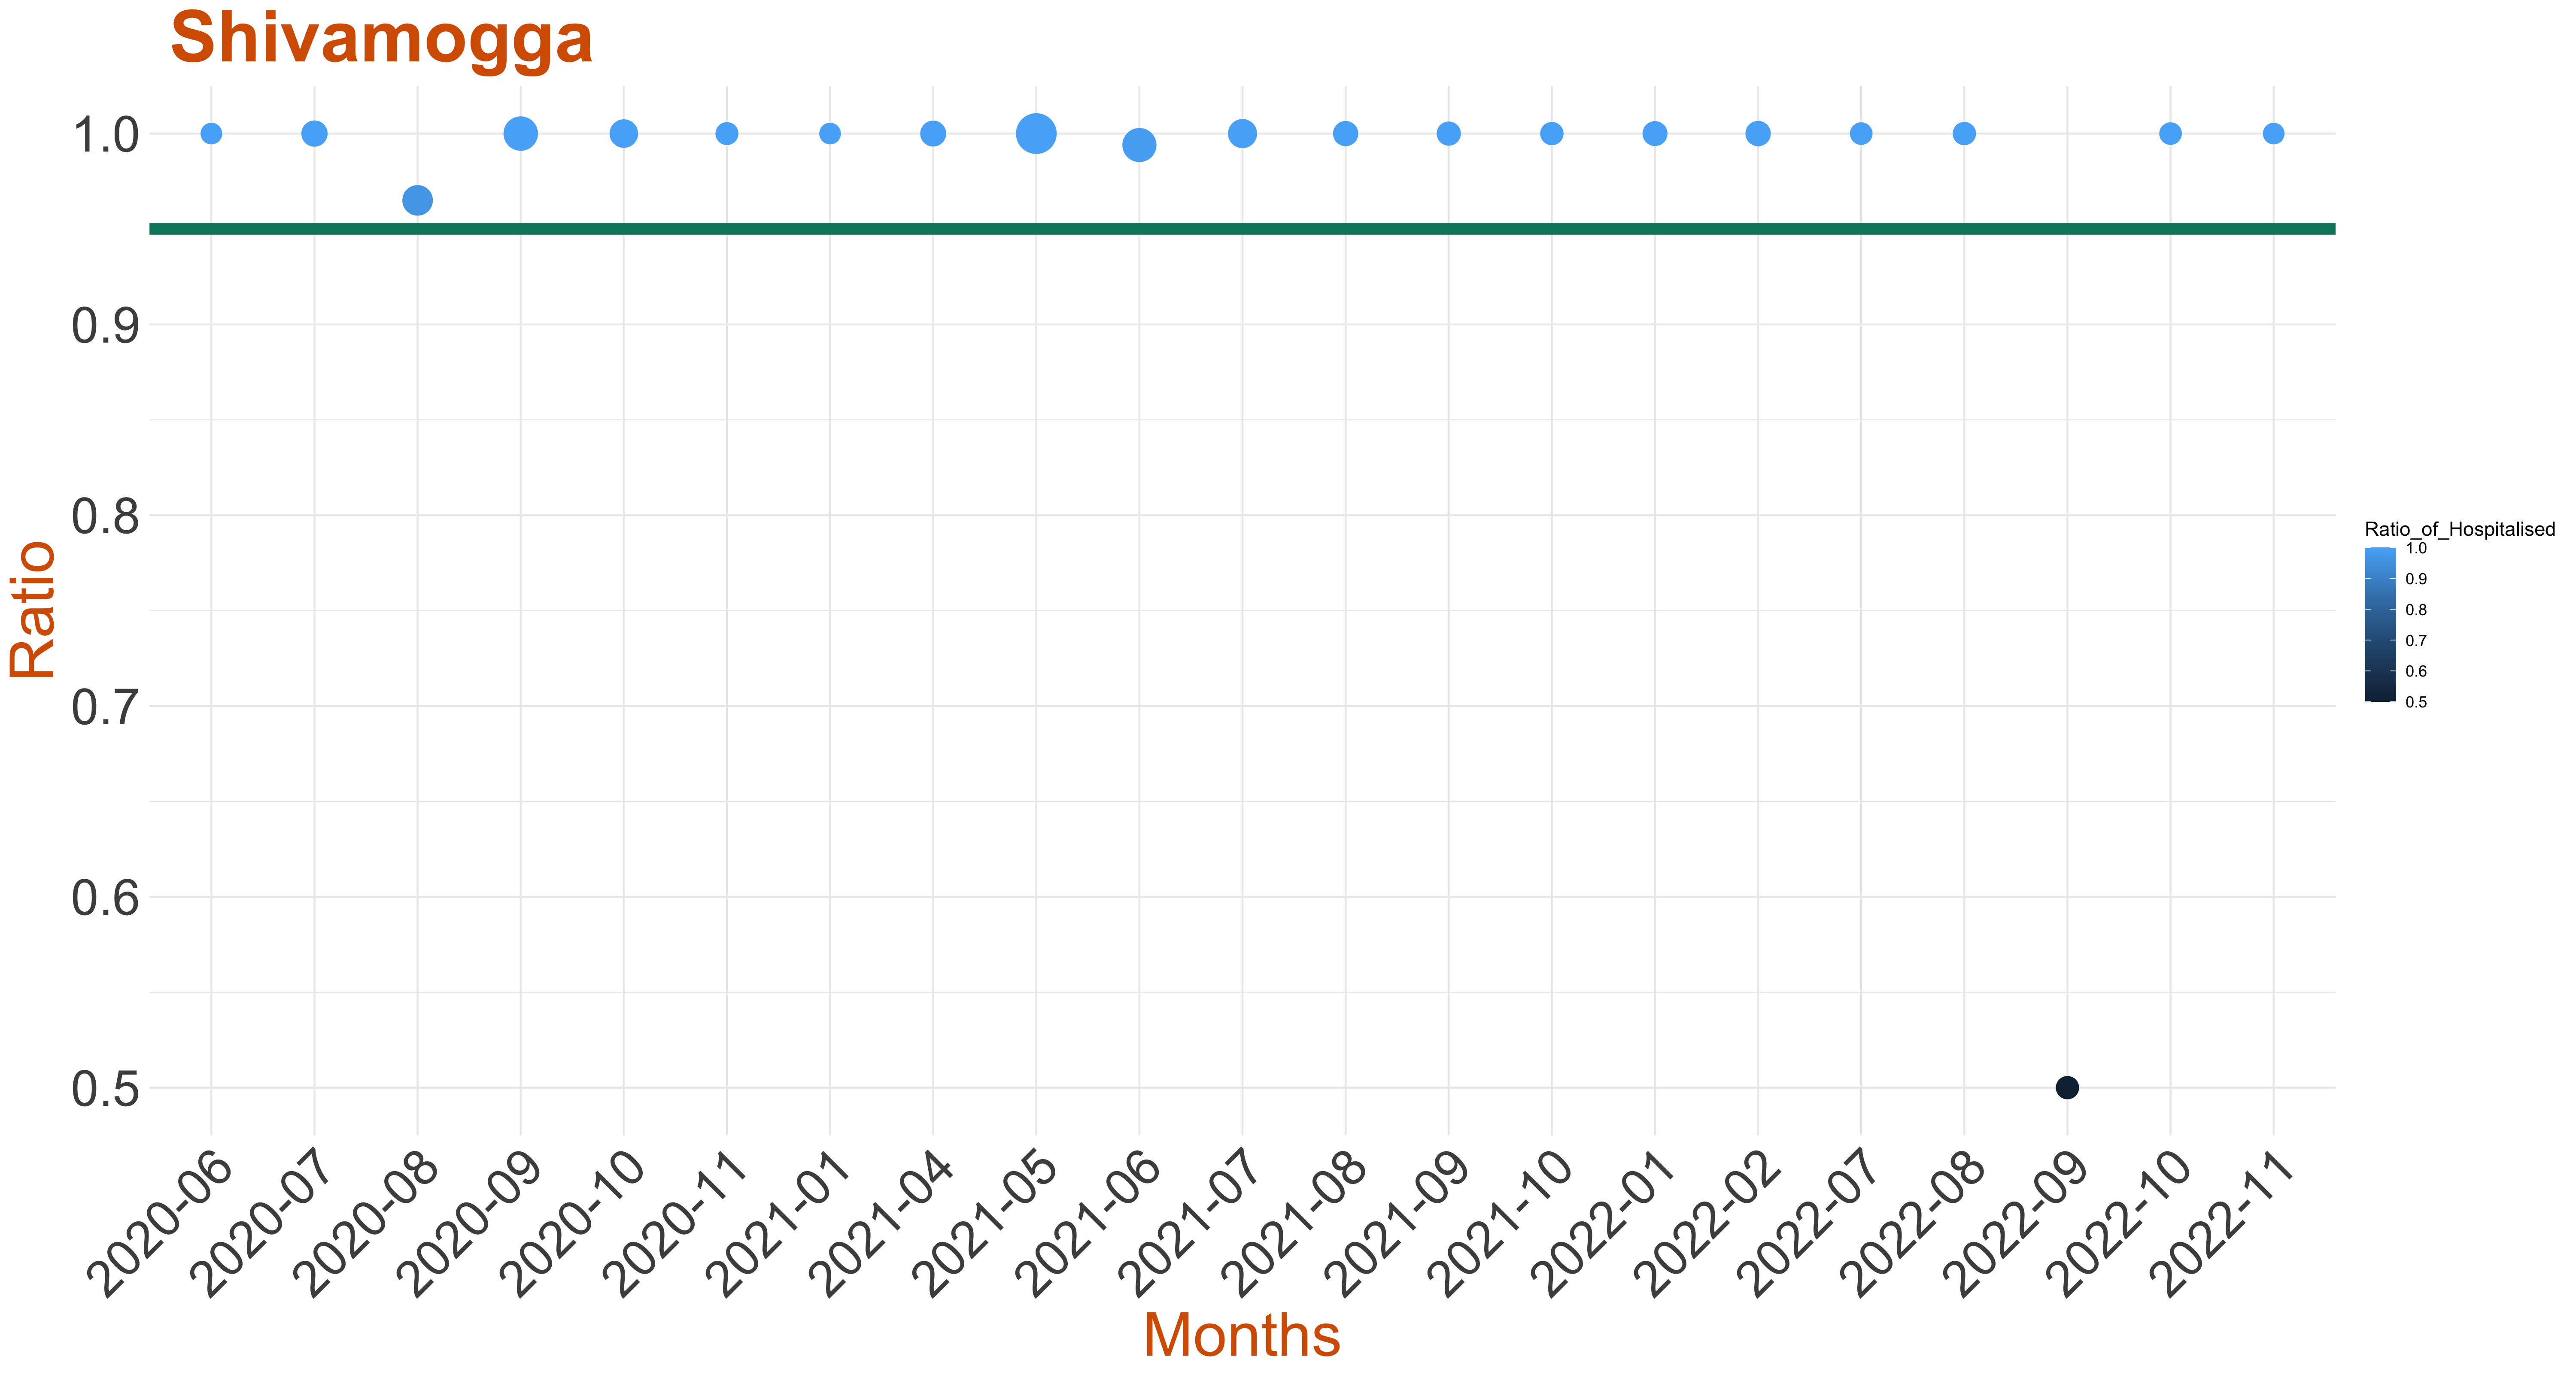
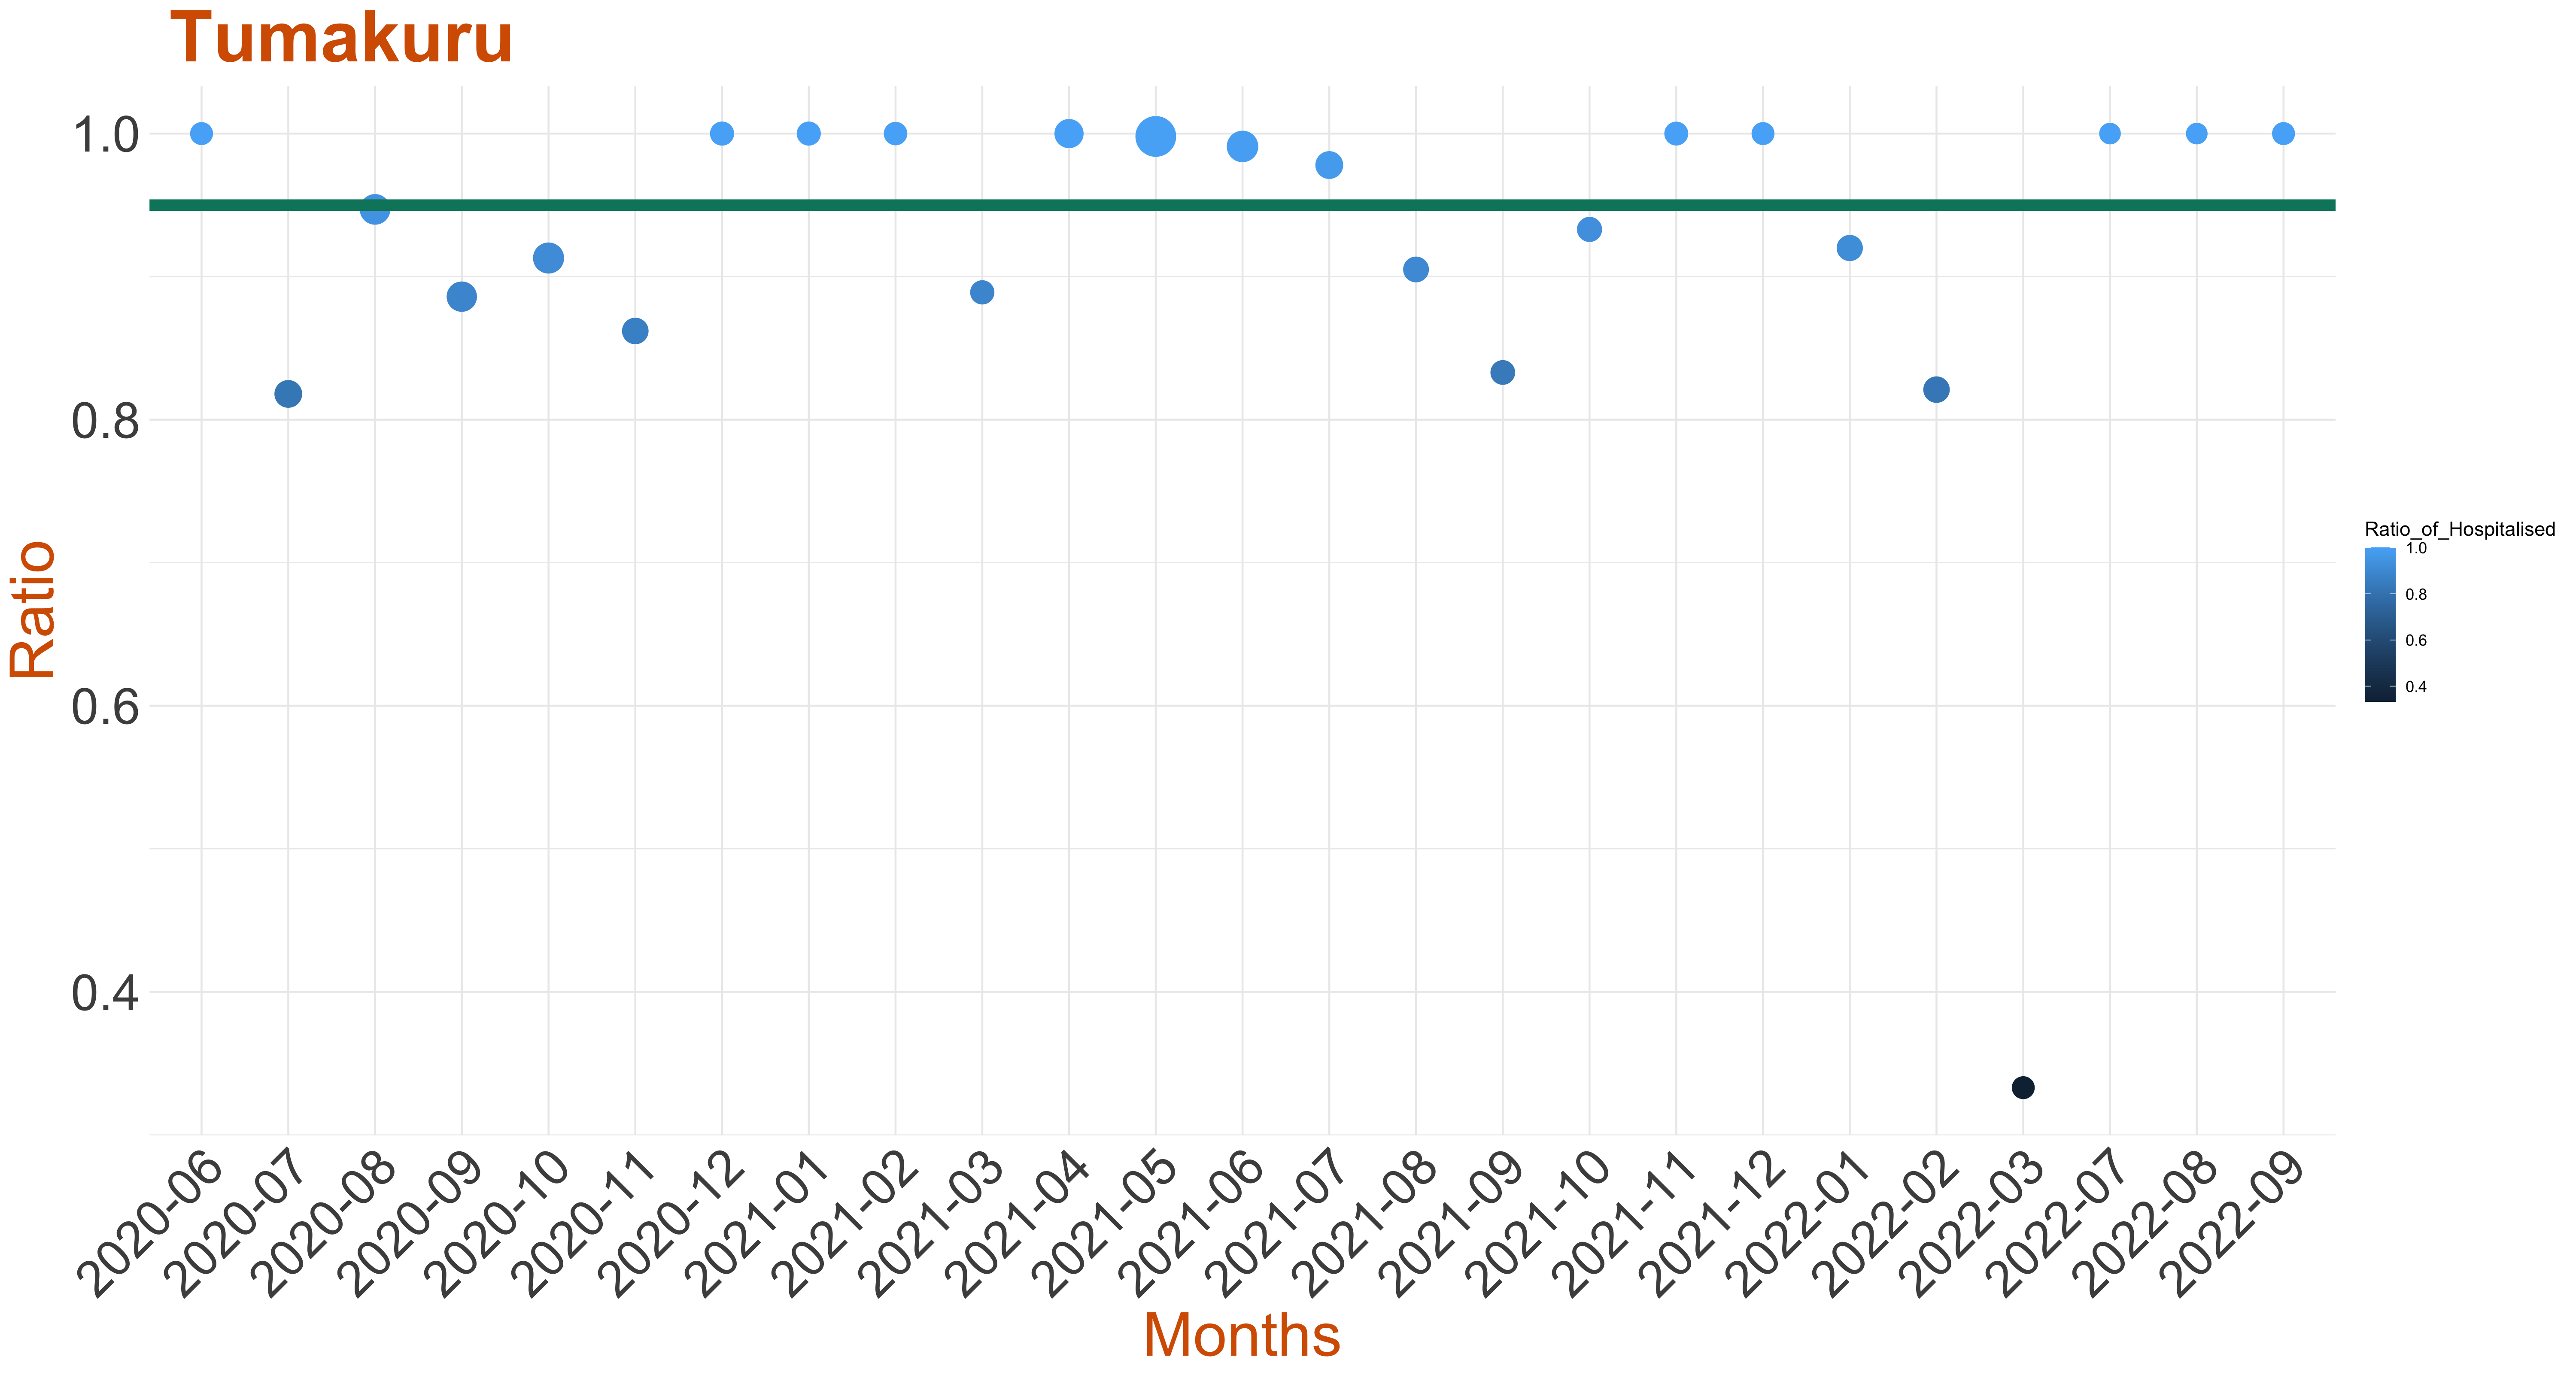
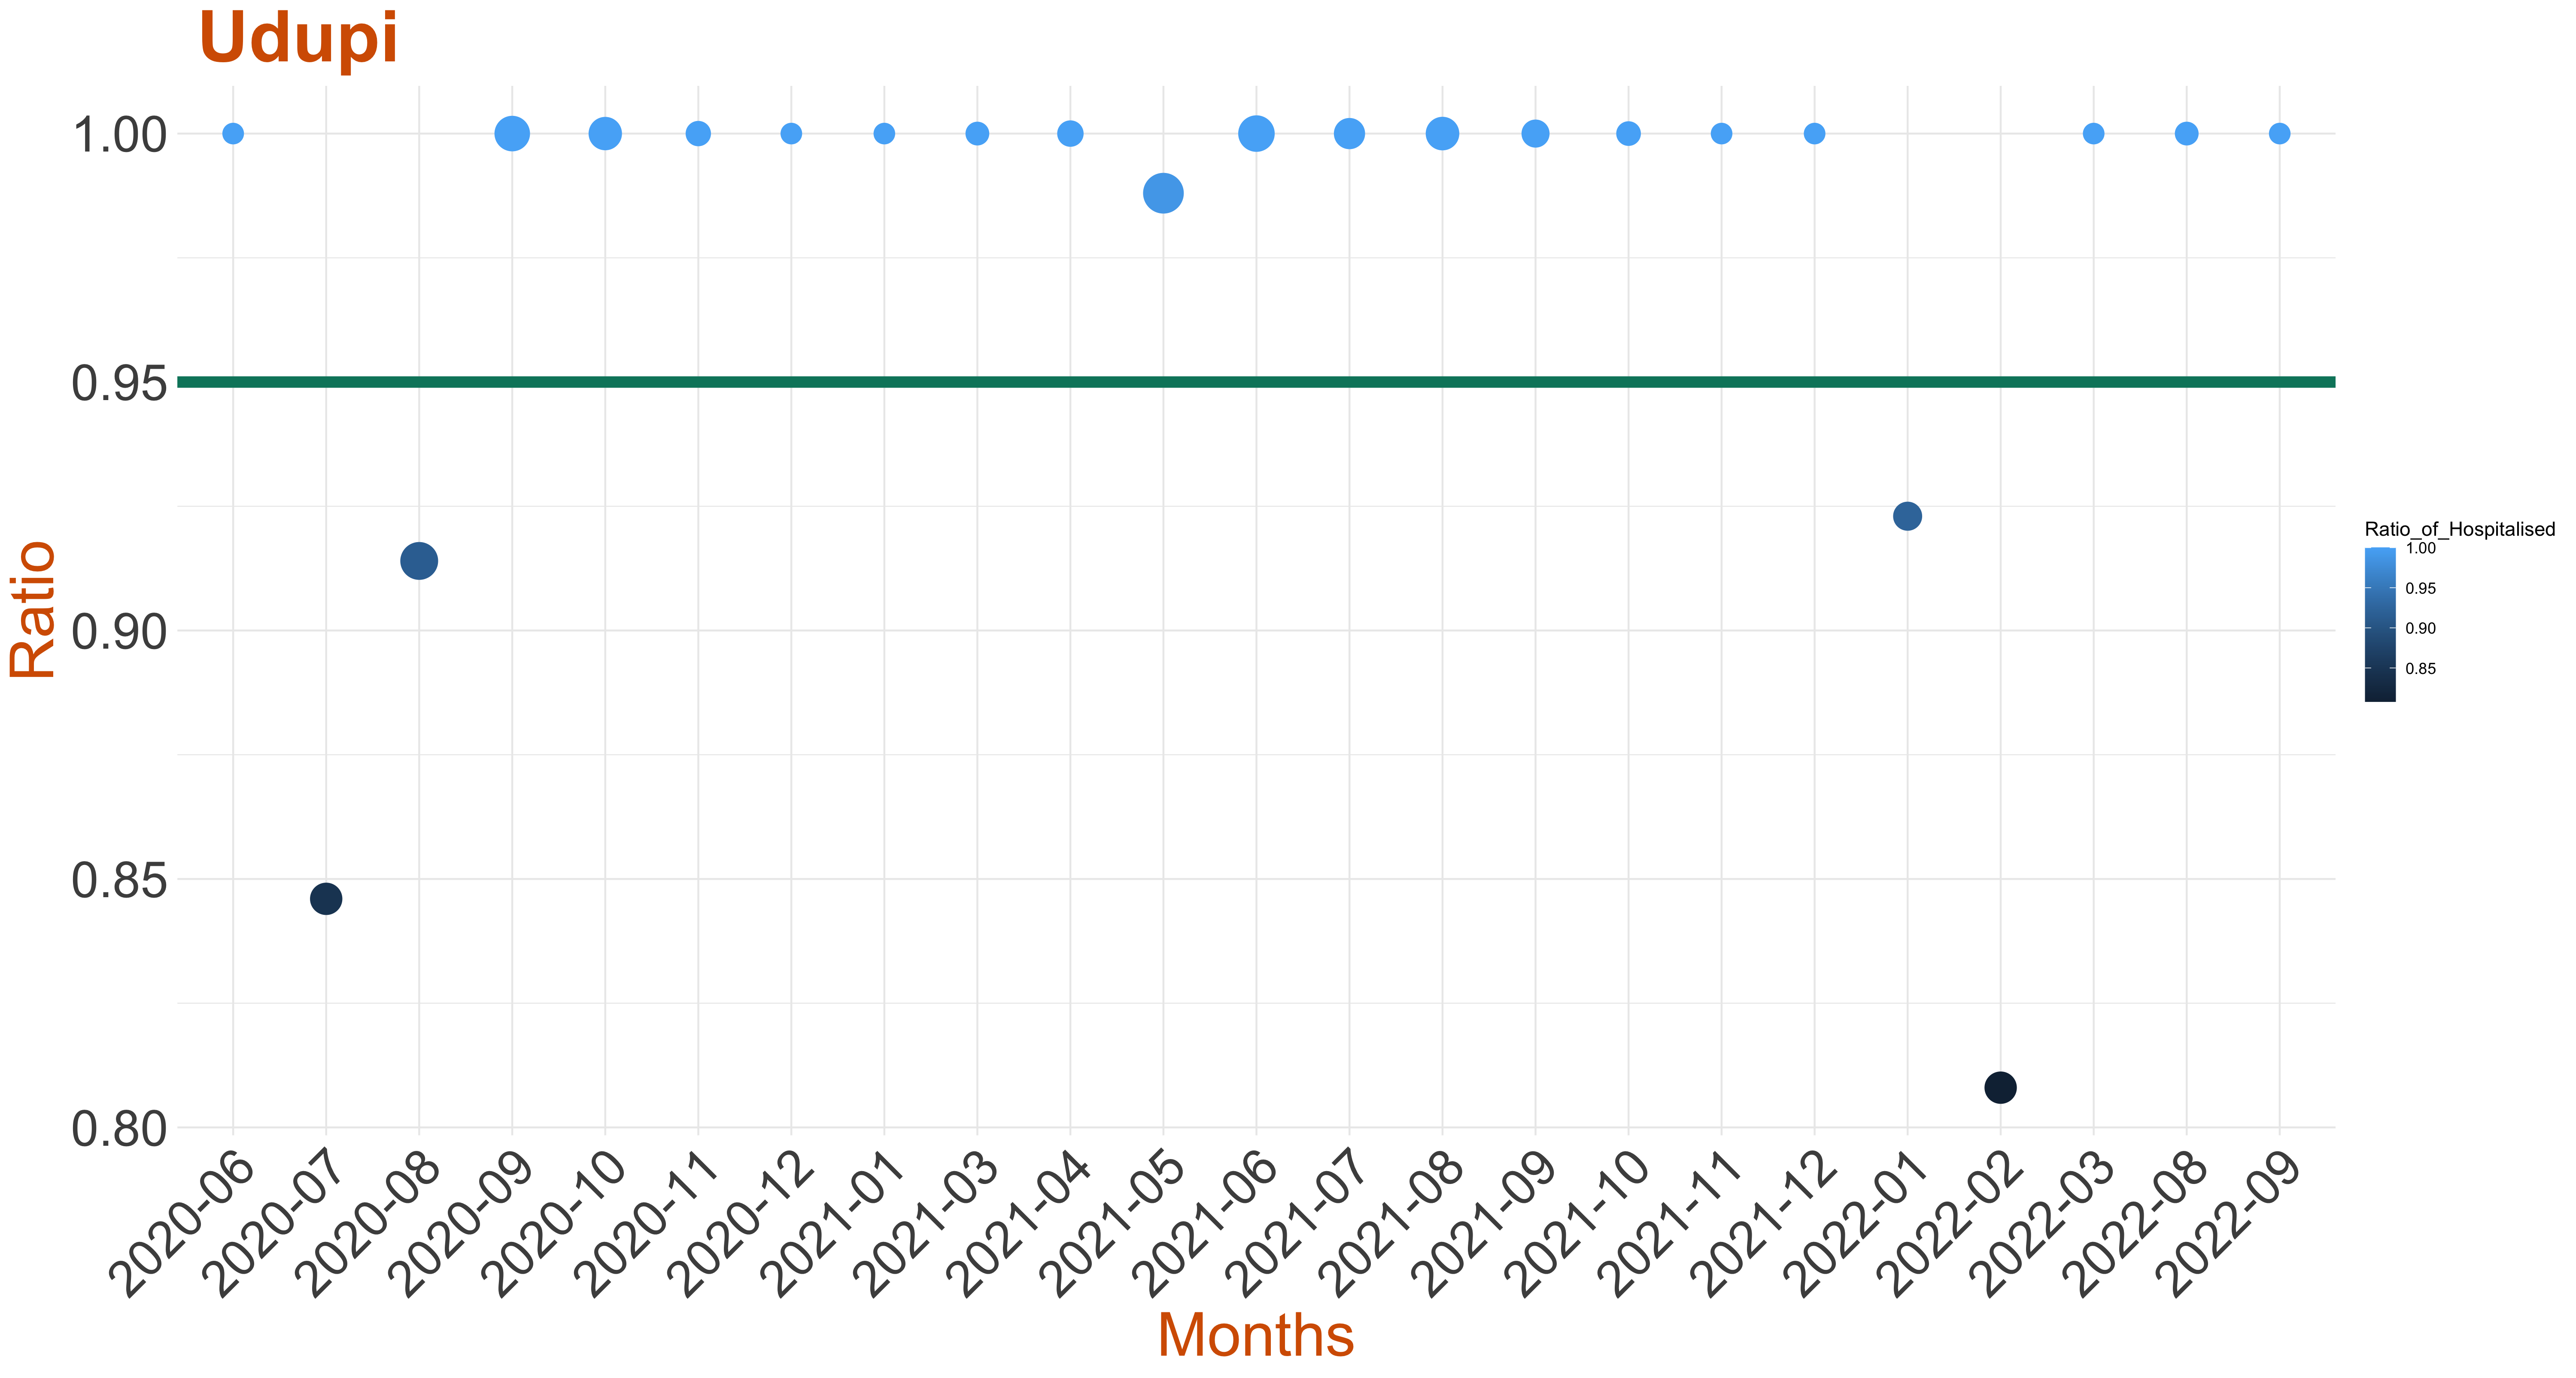
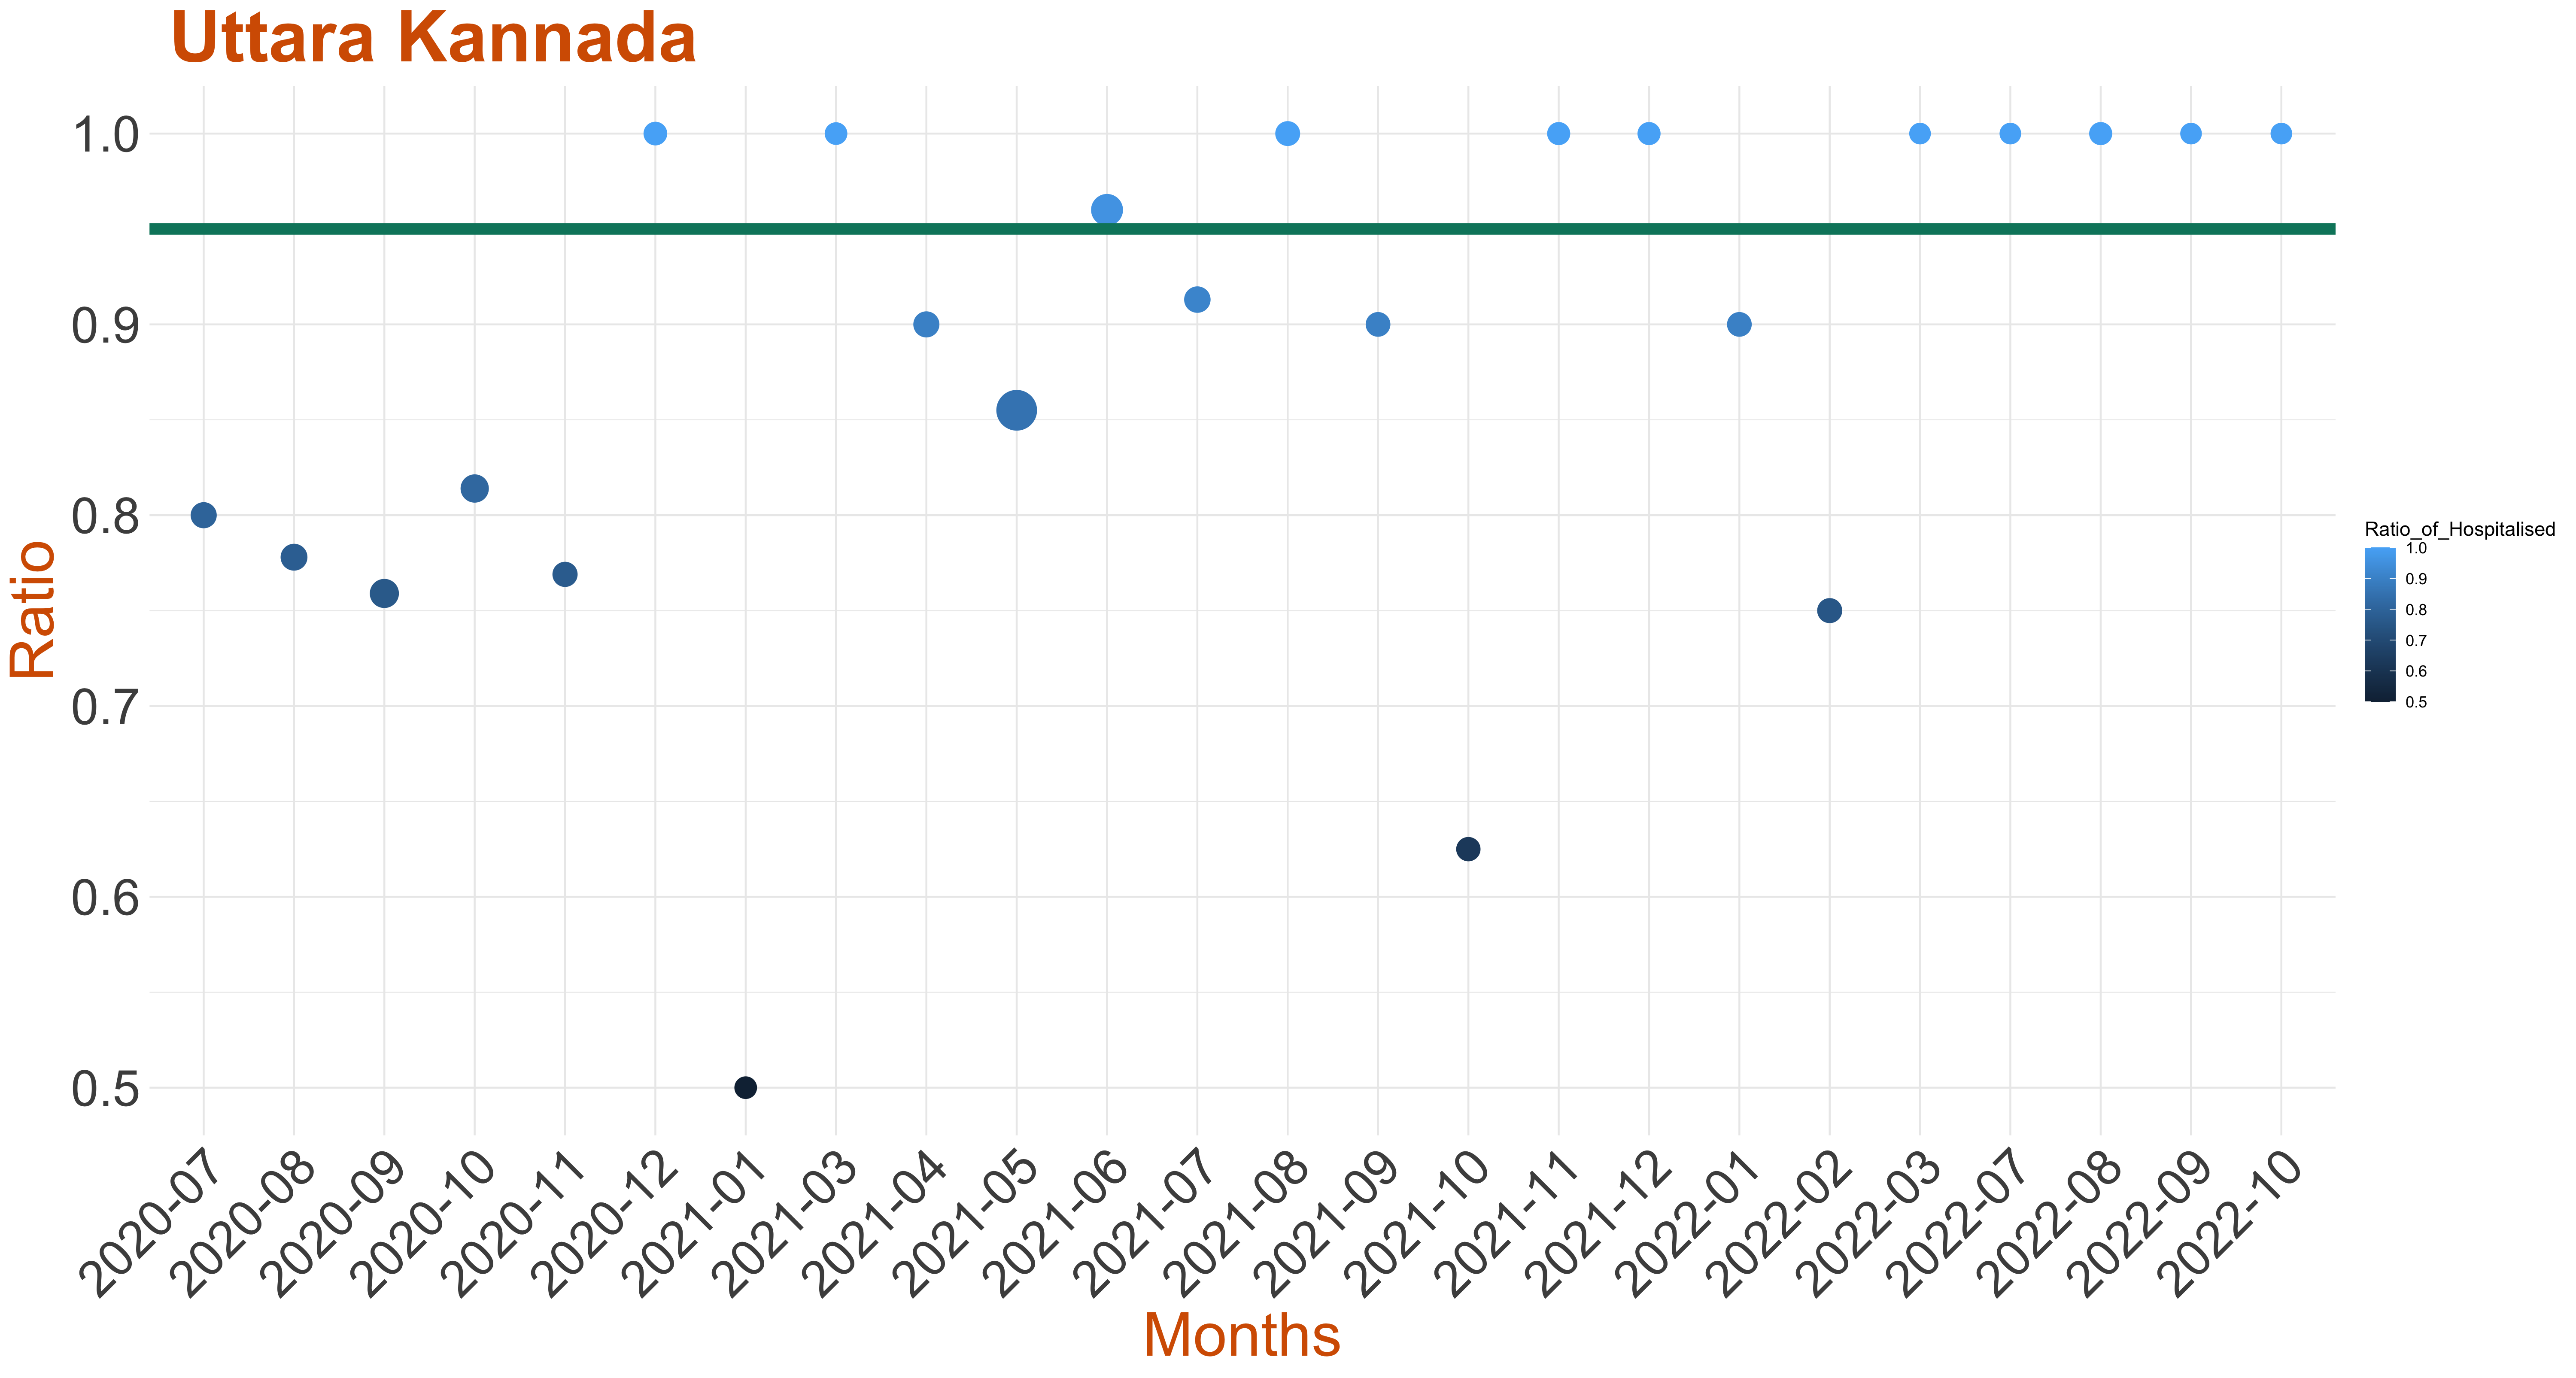
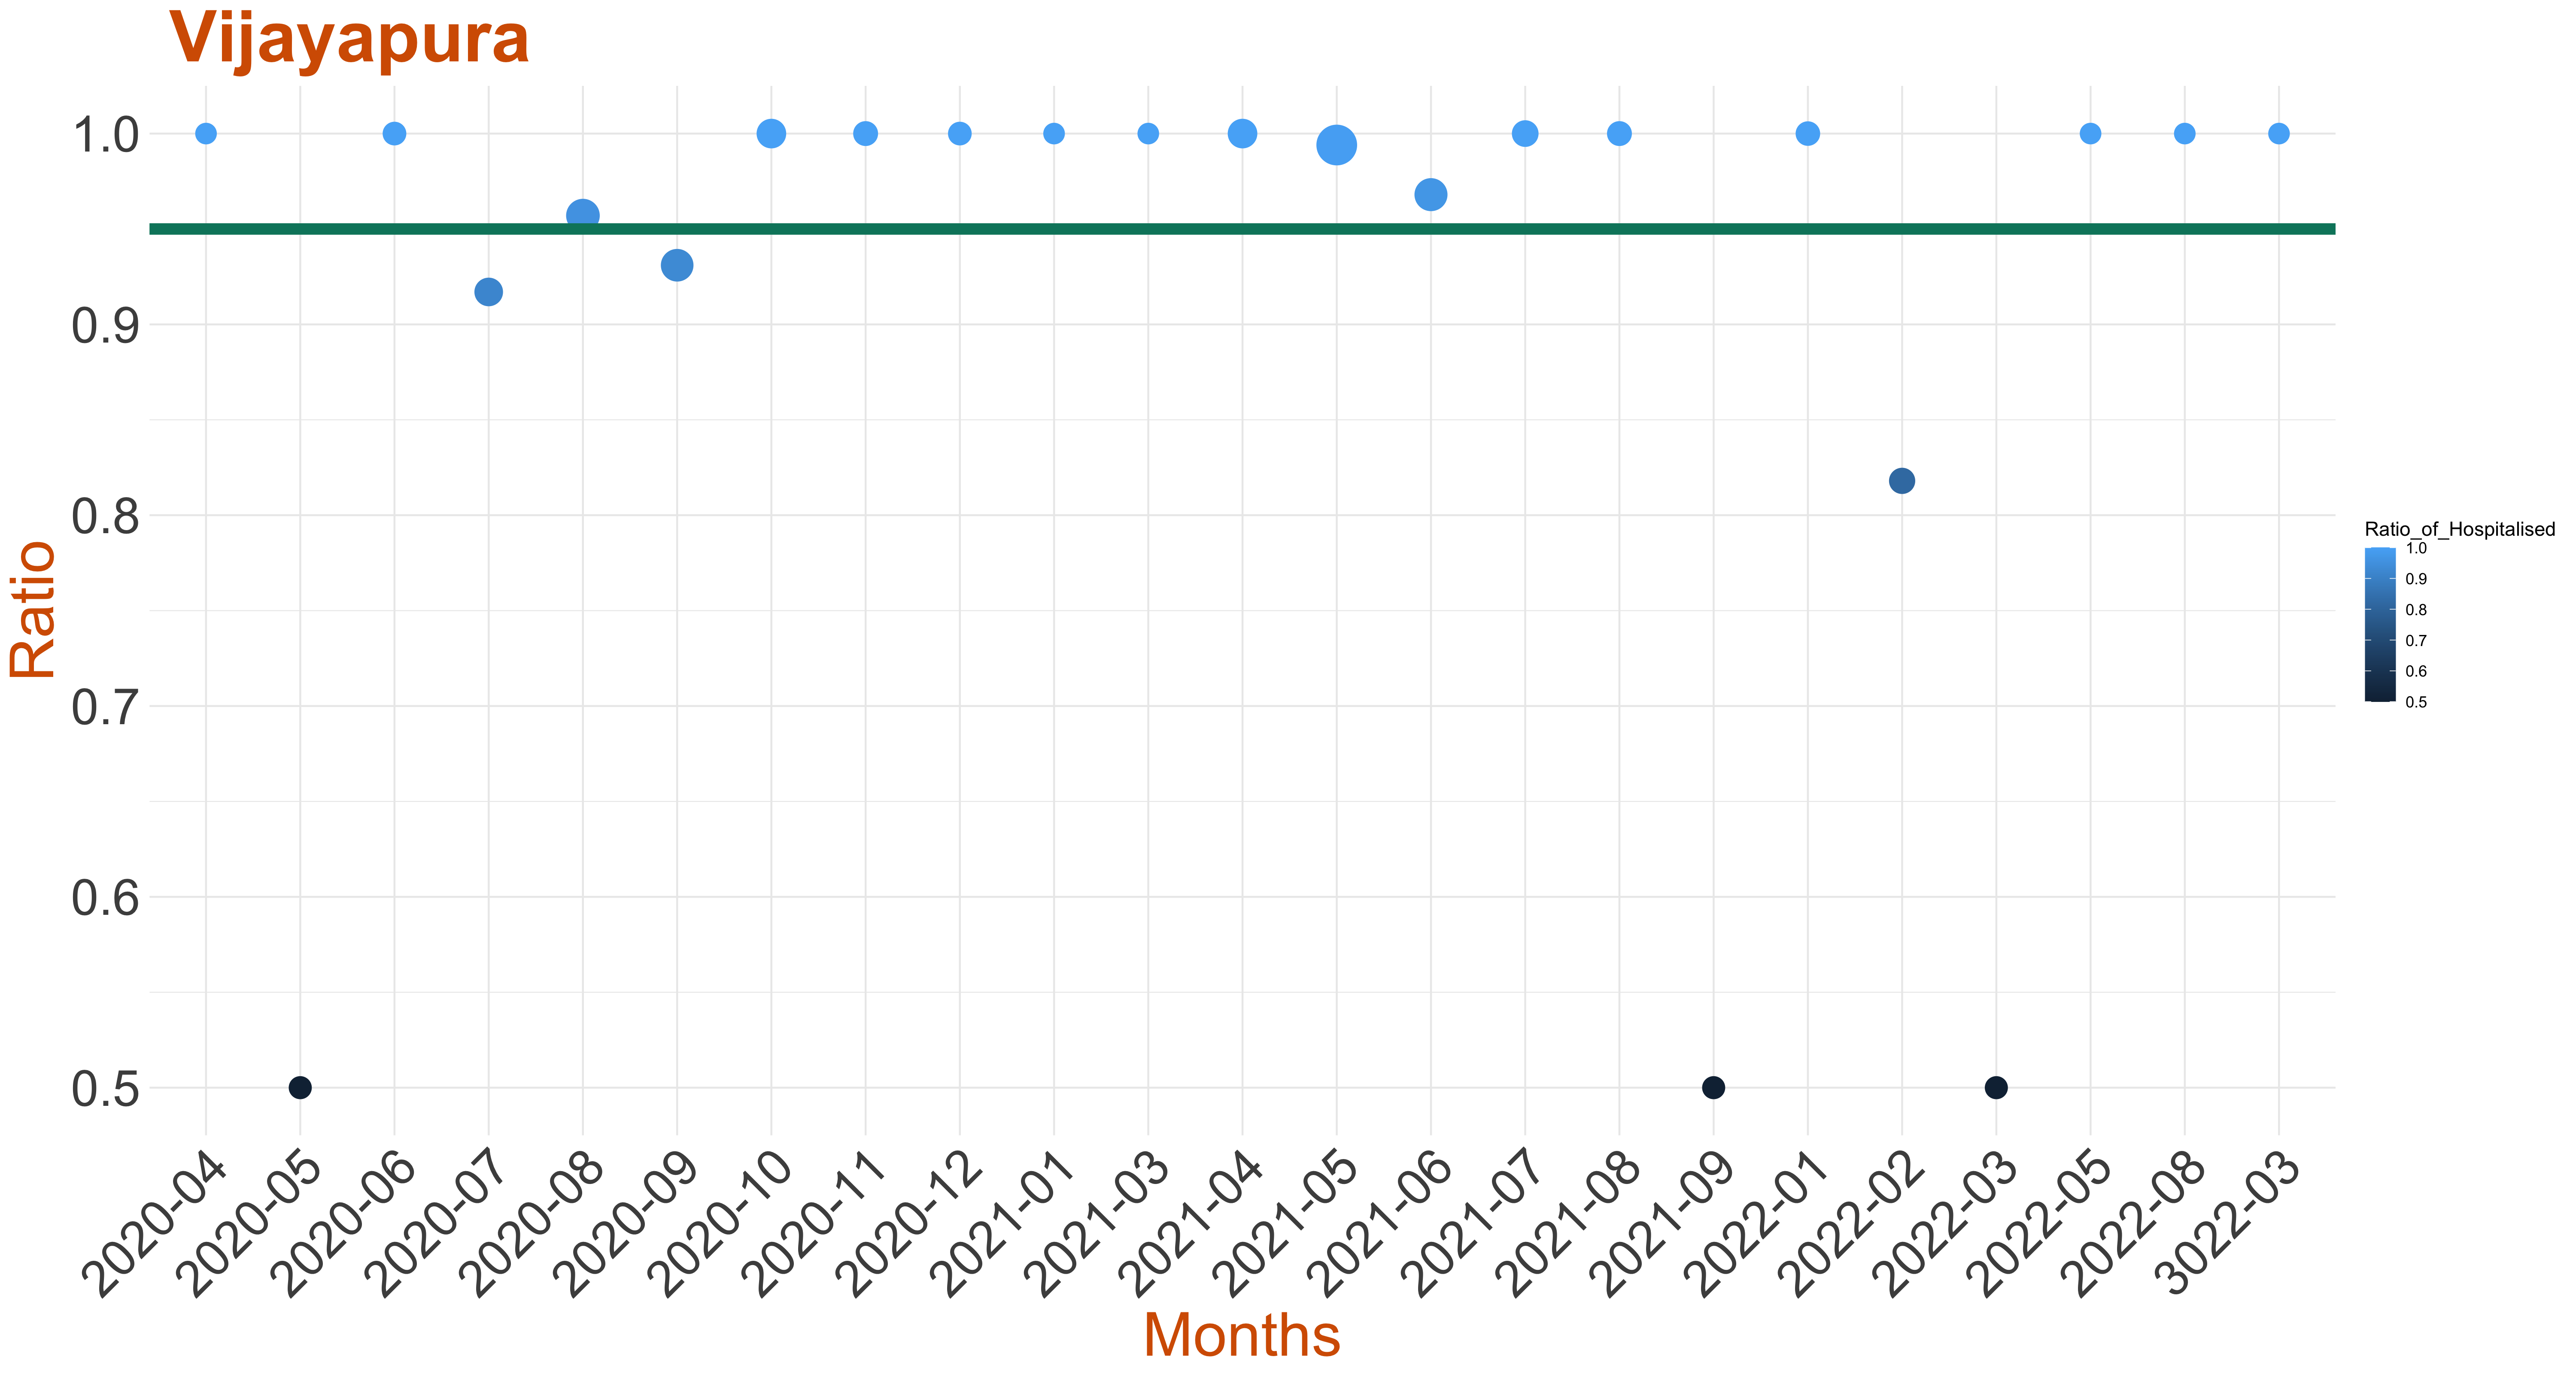
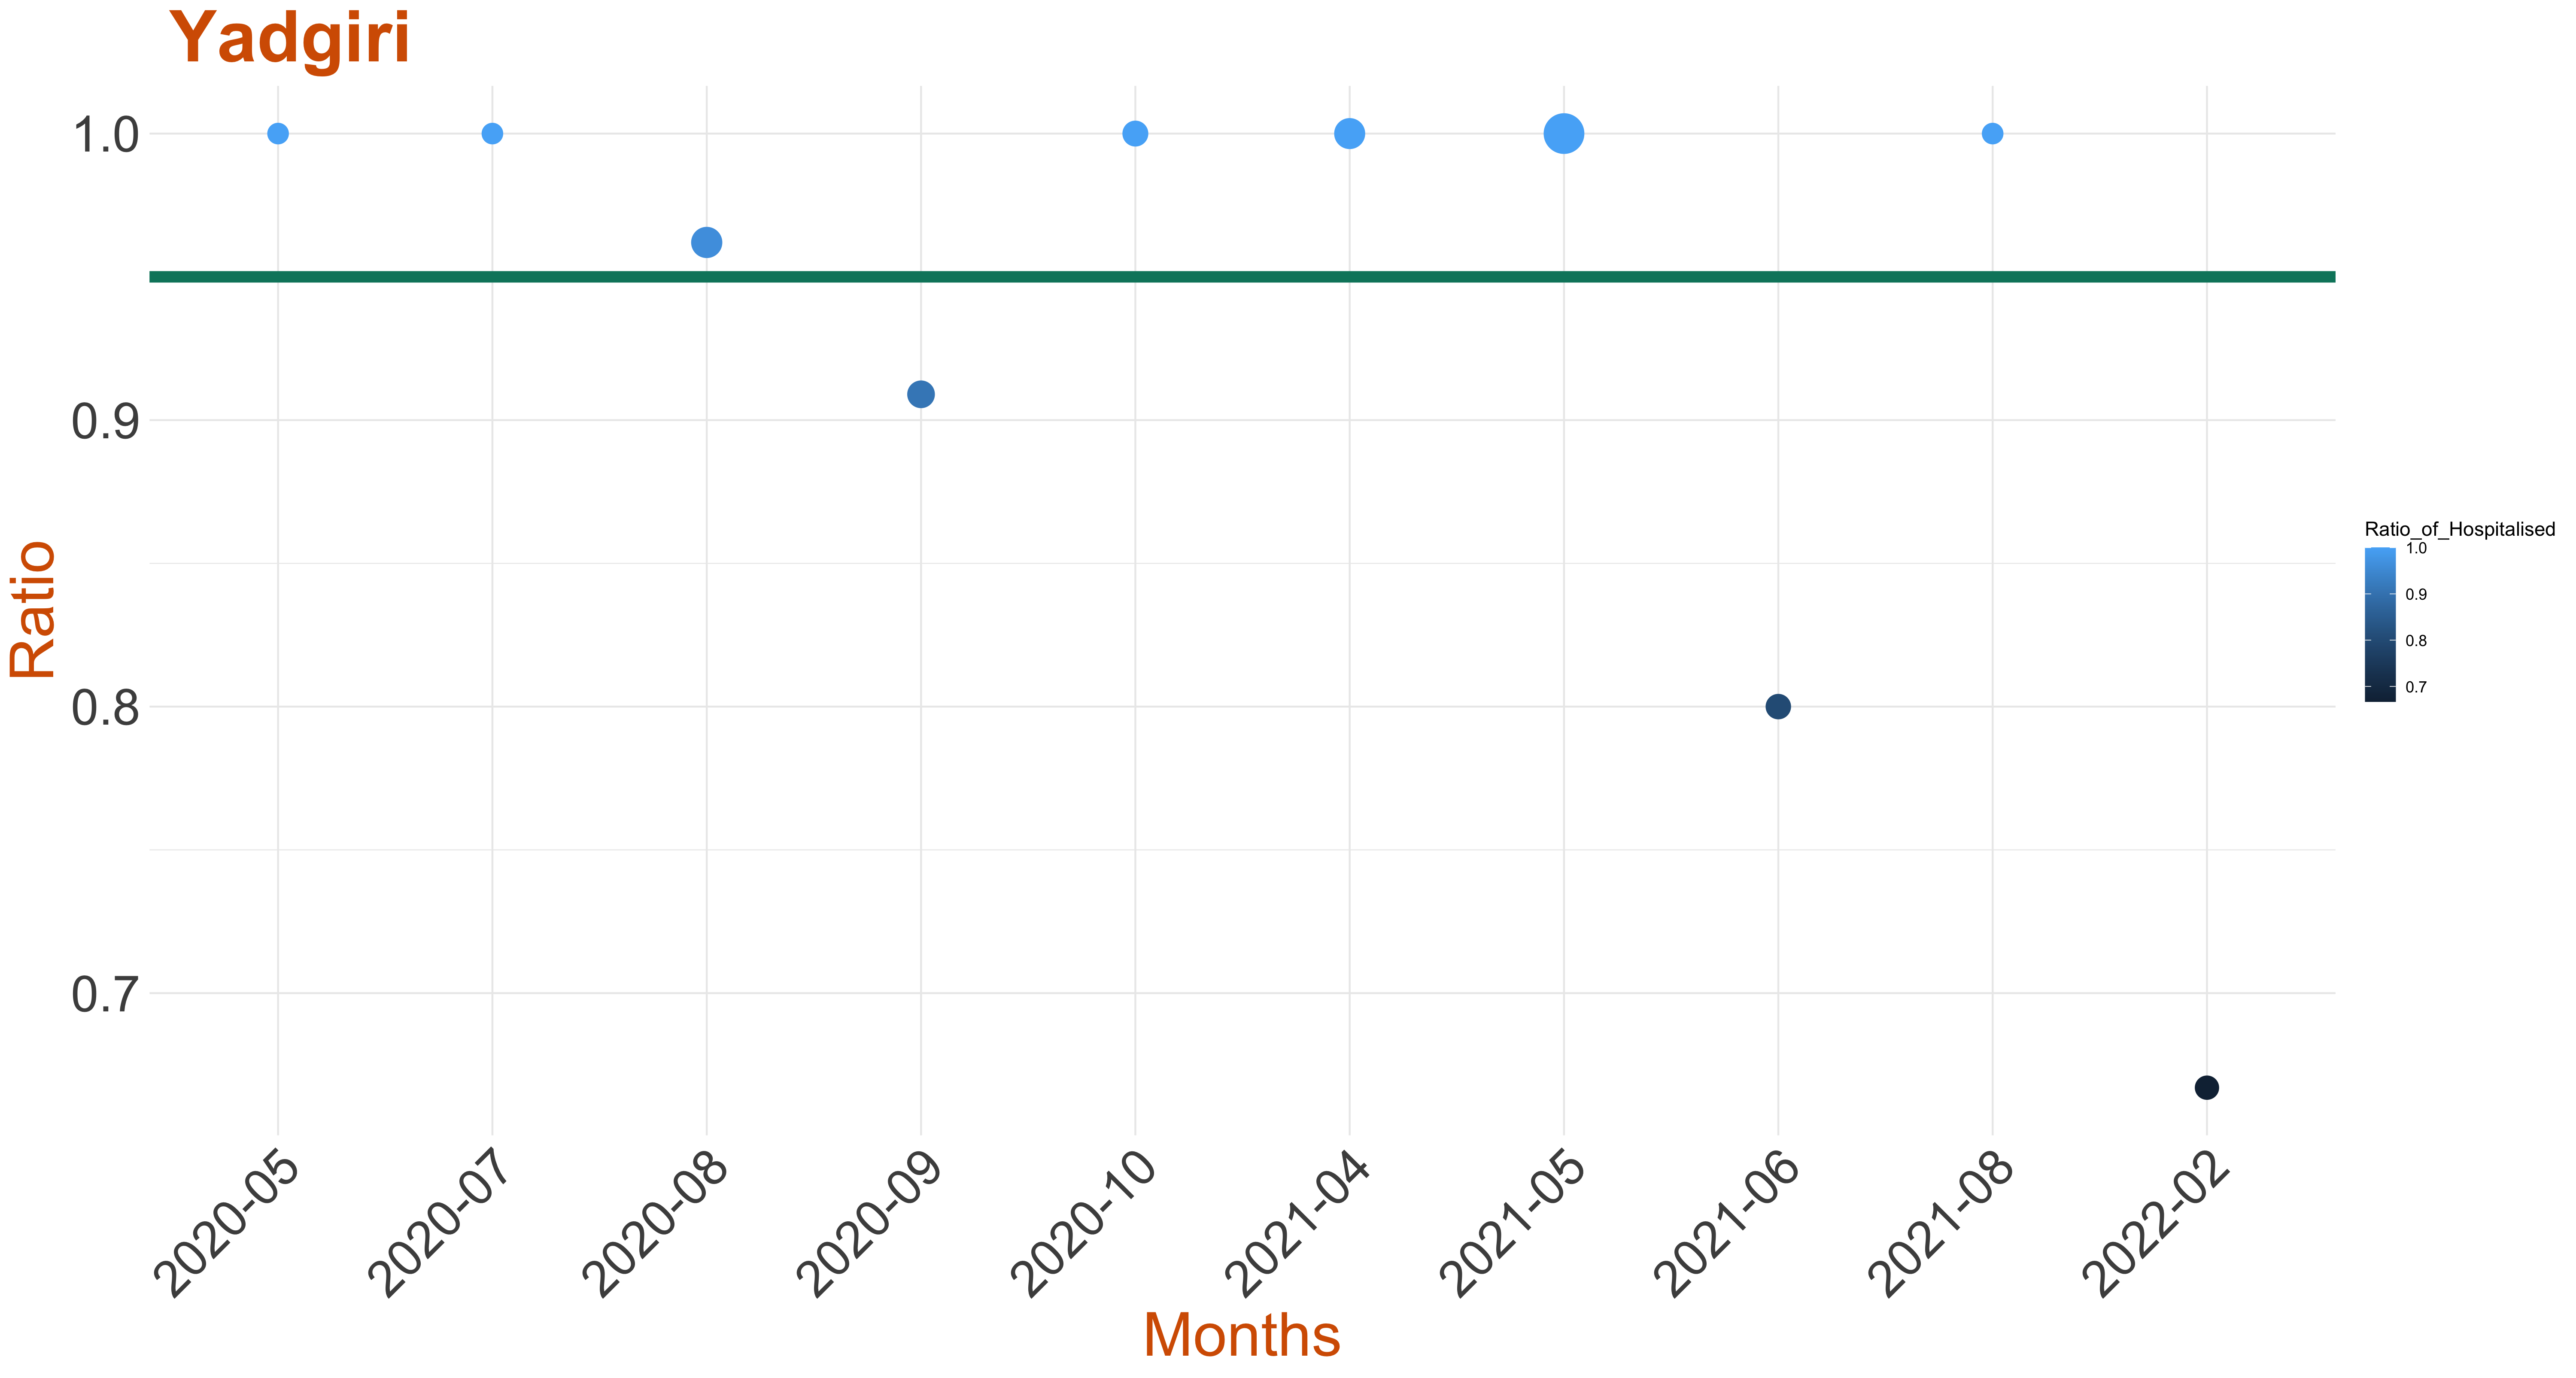
In the media bulletins provided by the government of Karnataka, the place of death is mentioned as Hospital or Brought Dead or Died at Residence. We take the ratio of hospitalised patients to total deceased patients to arrive at the hospitalisation ratio. Below we present the data of Hospitalisation Ratio of the deceased patients as scatter plots for each district. The size of the blob in the scatter plot indicates the number of monthly deaths.
We have marked a line at 95% hospitalisation ratio in the scatter plots or at the minimum monthly hospilisation ratio if it is higher. This line may be viewed as an ideal that each district could aim to attain in terms of hospitalisation ratio. In comparison with days to decease one may arrive at a standard for clinical treatment.