COVID-19 India-Timeline an understanding across States and Union Territories
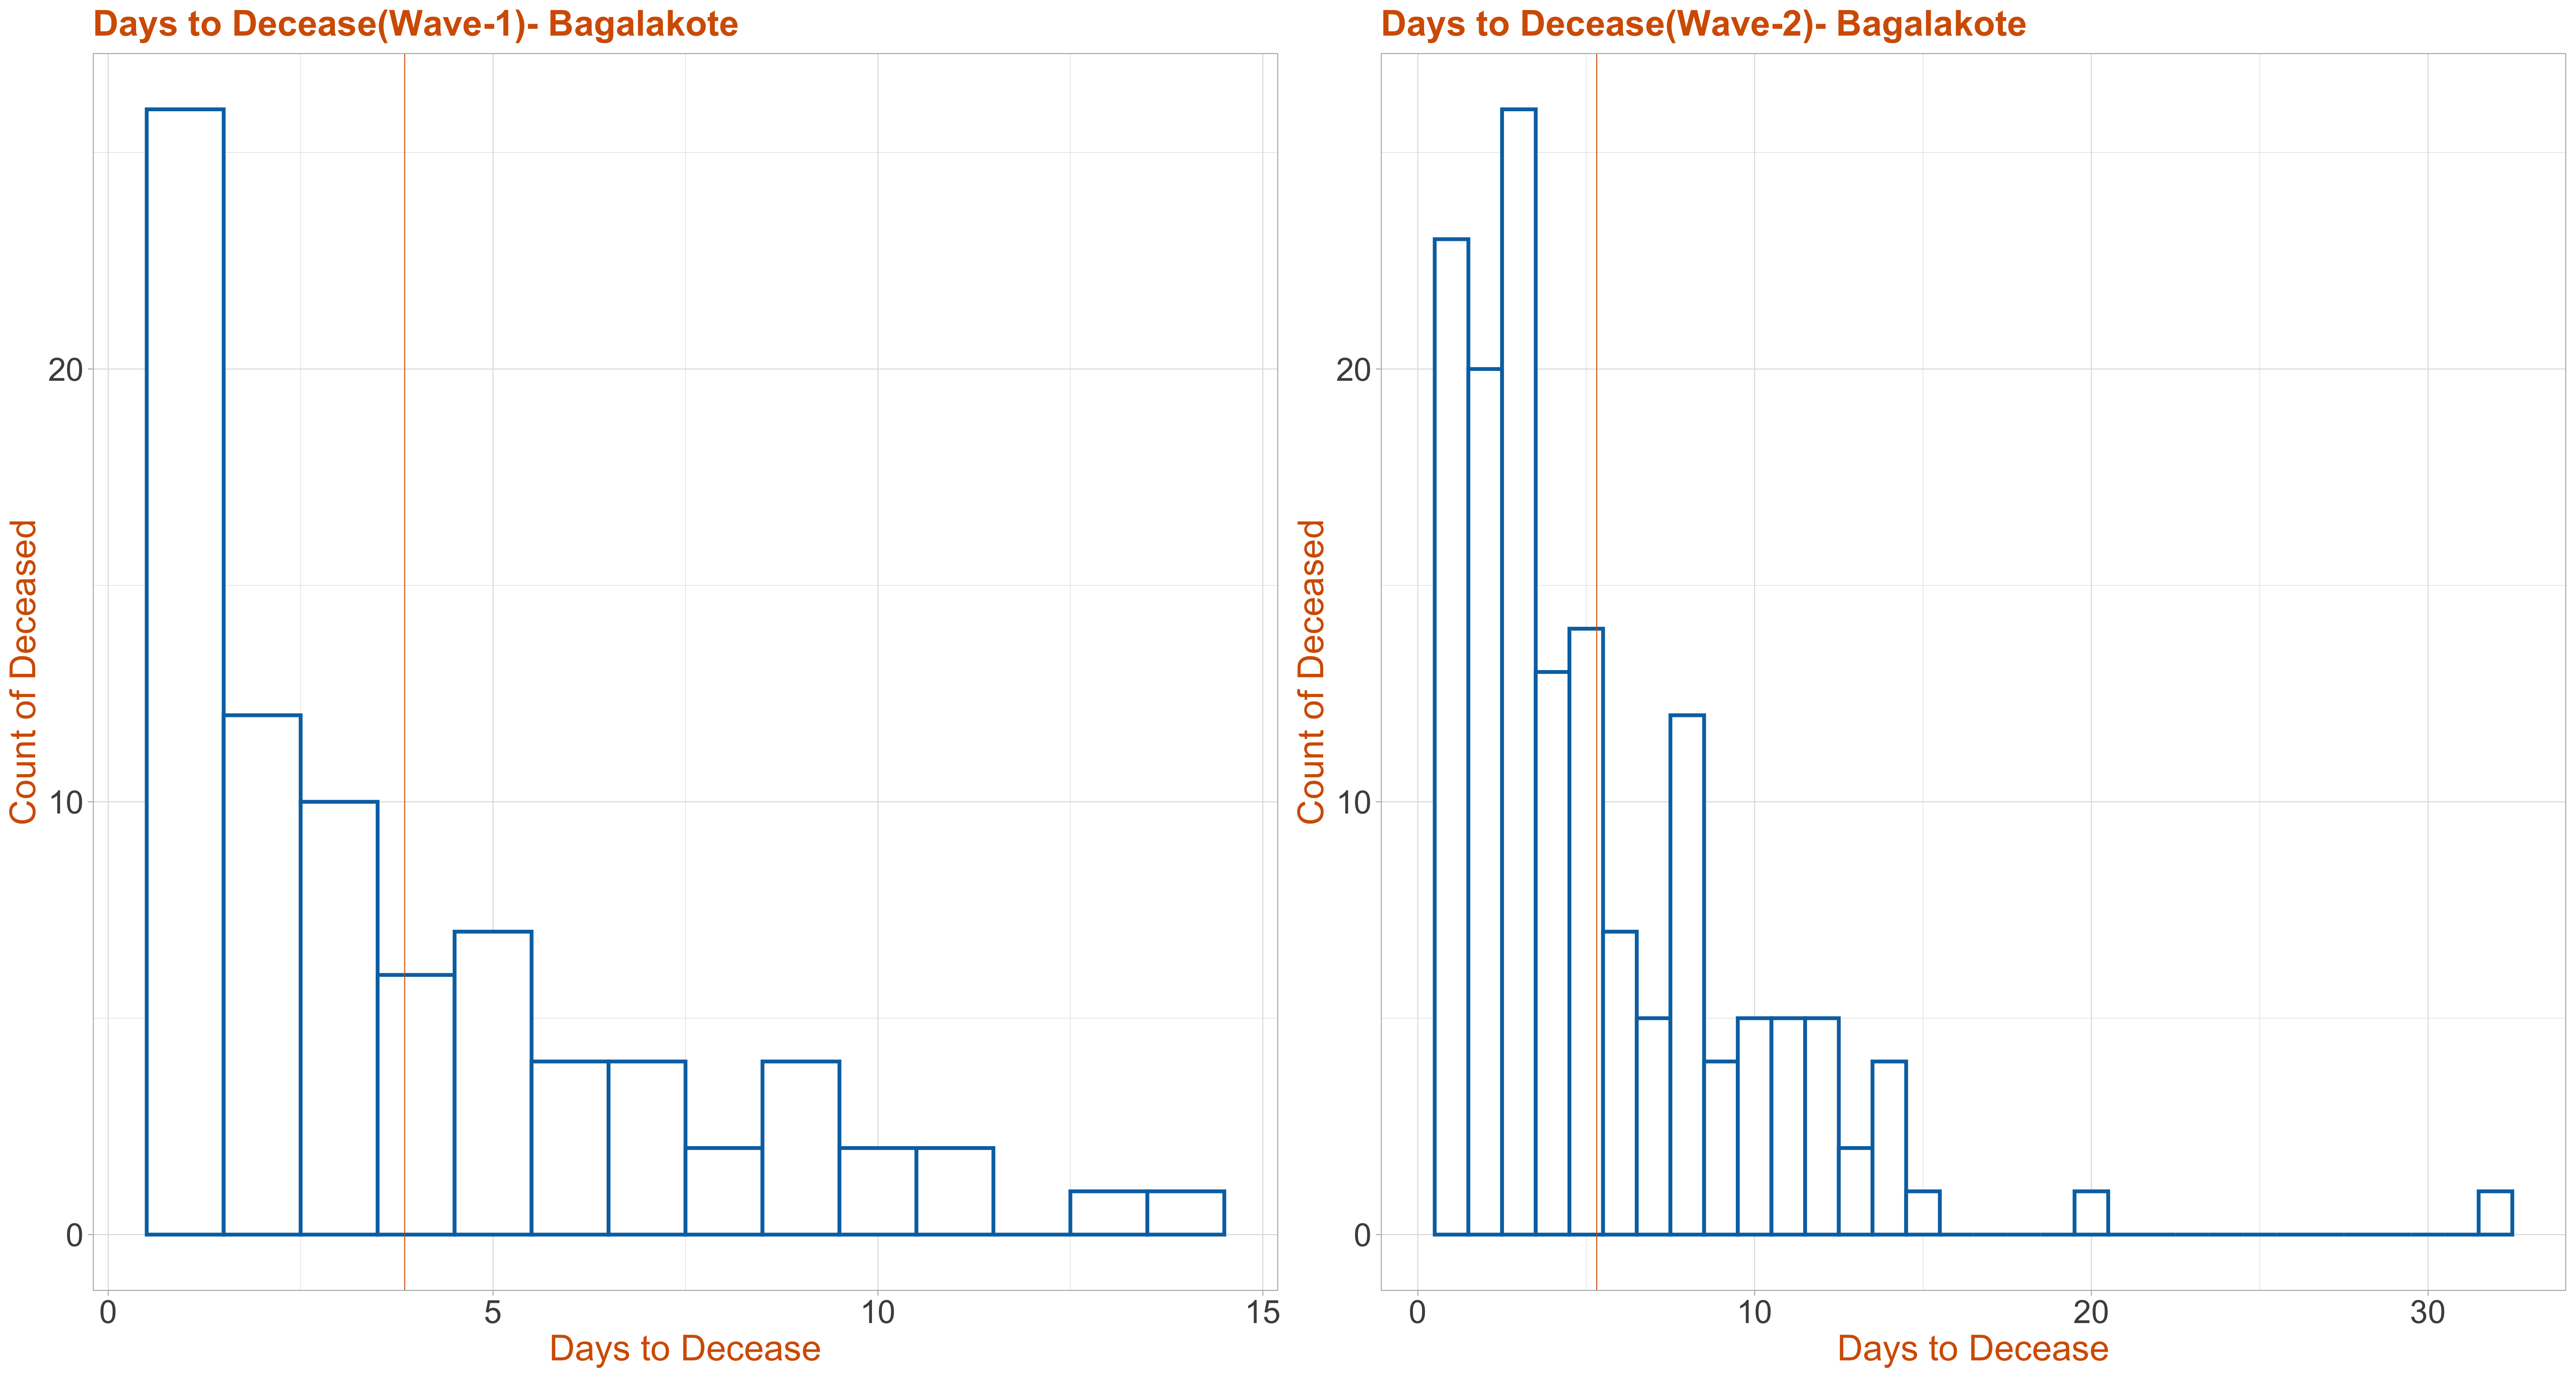
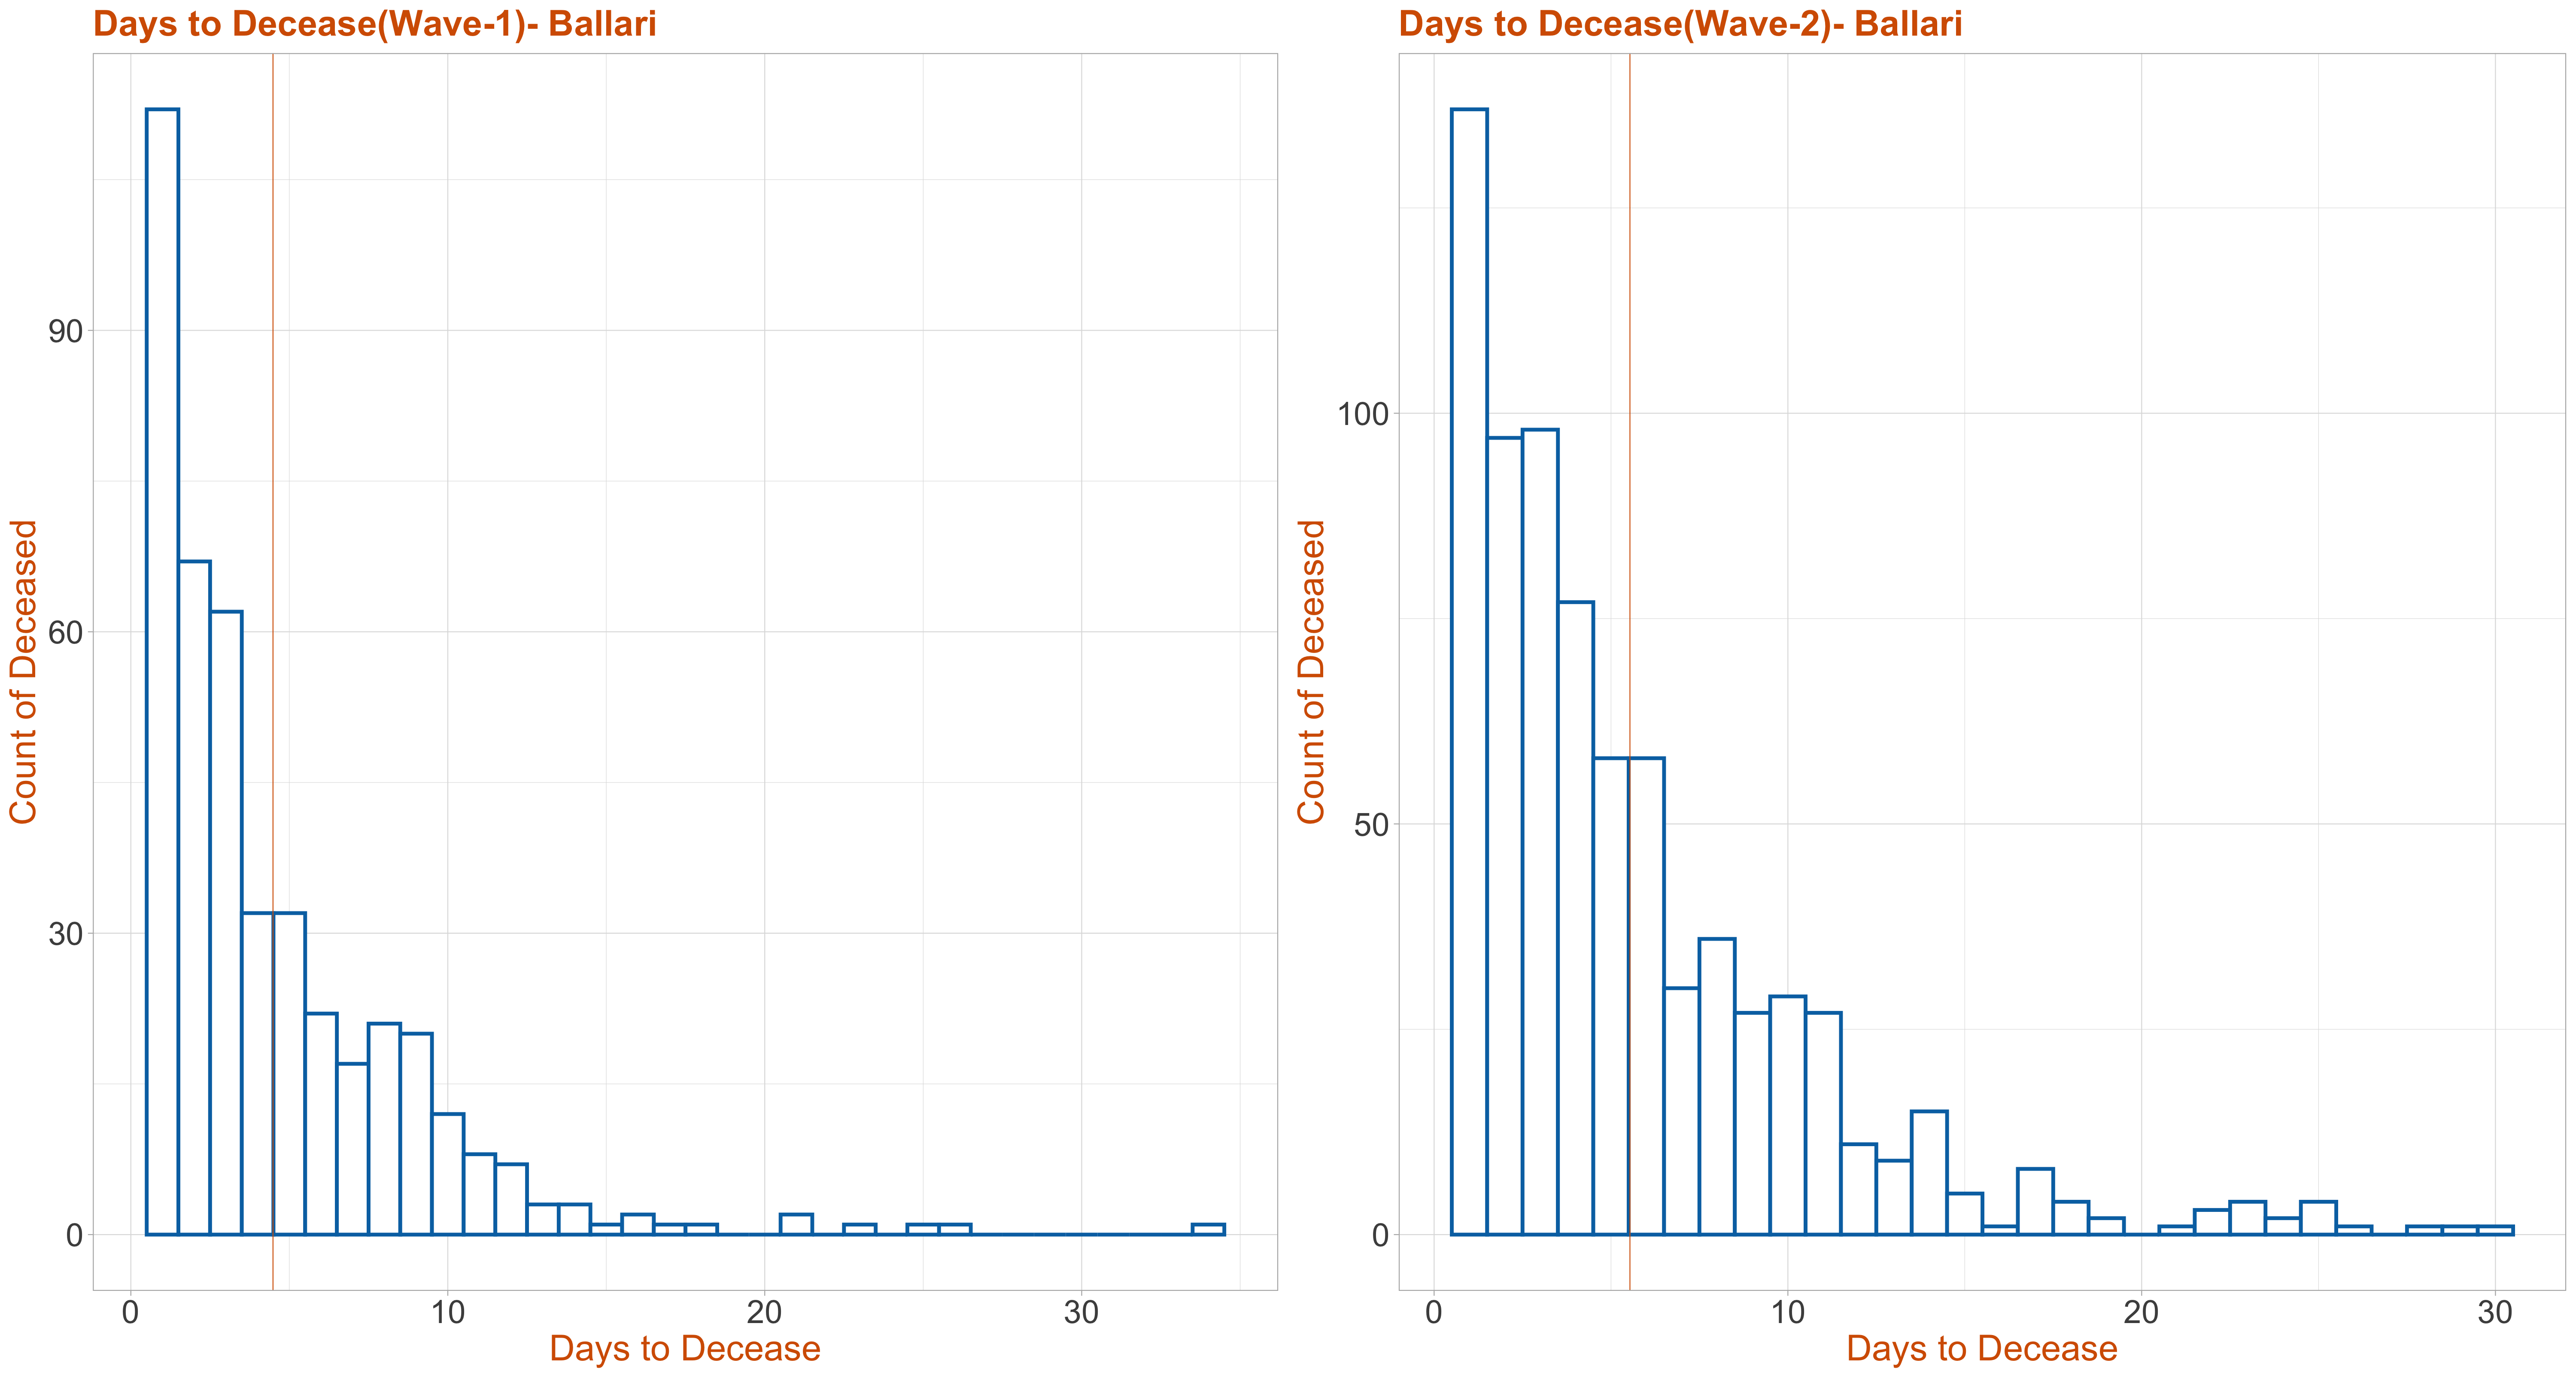
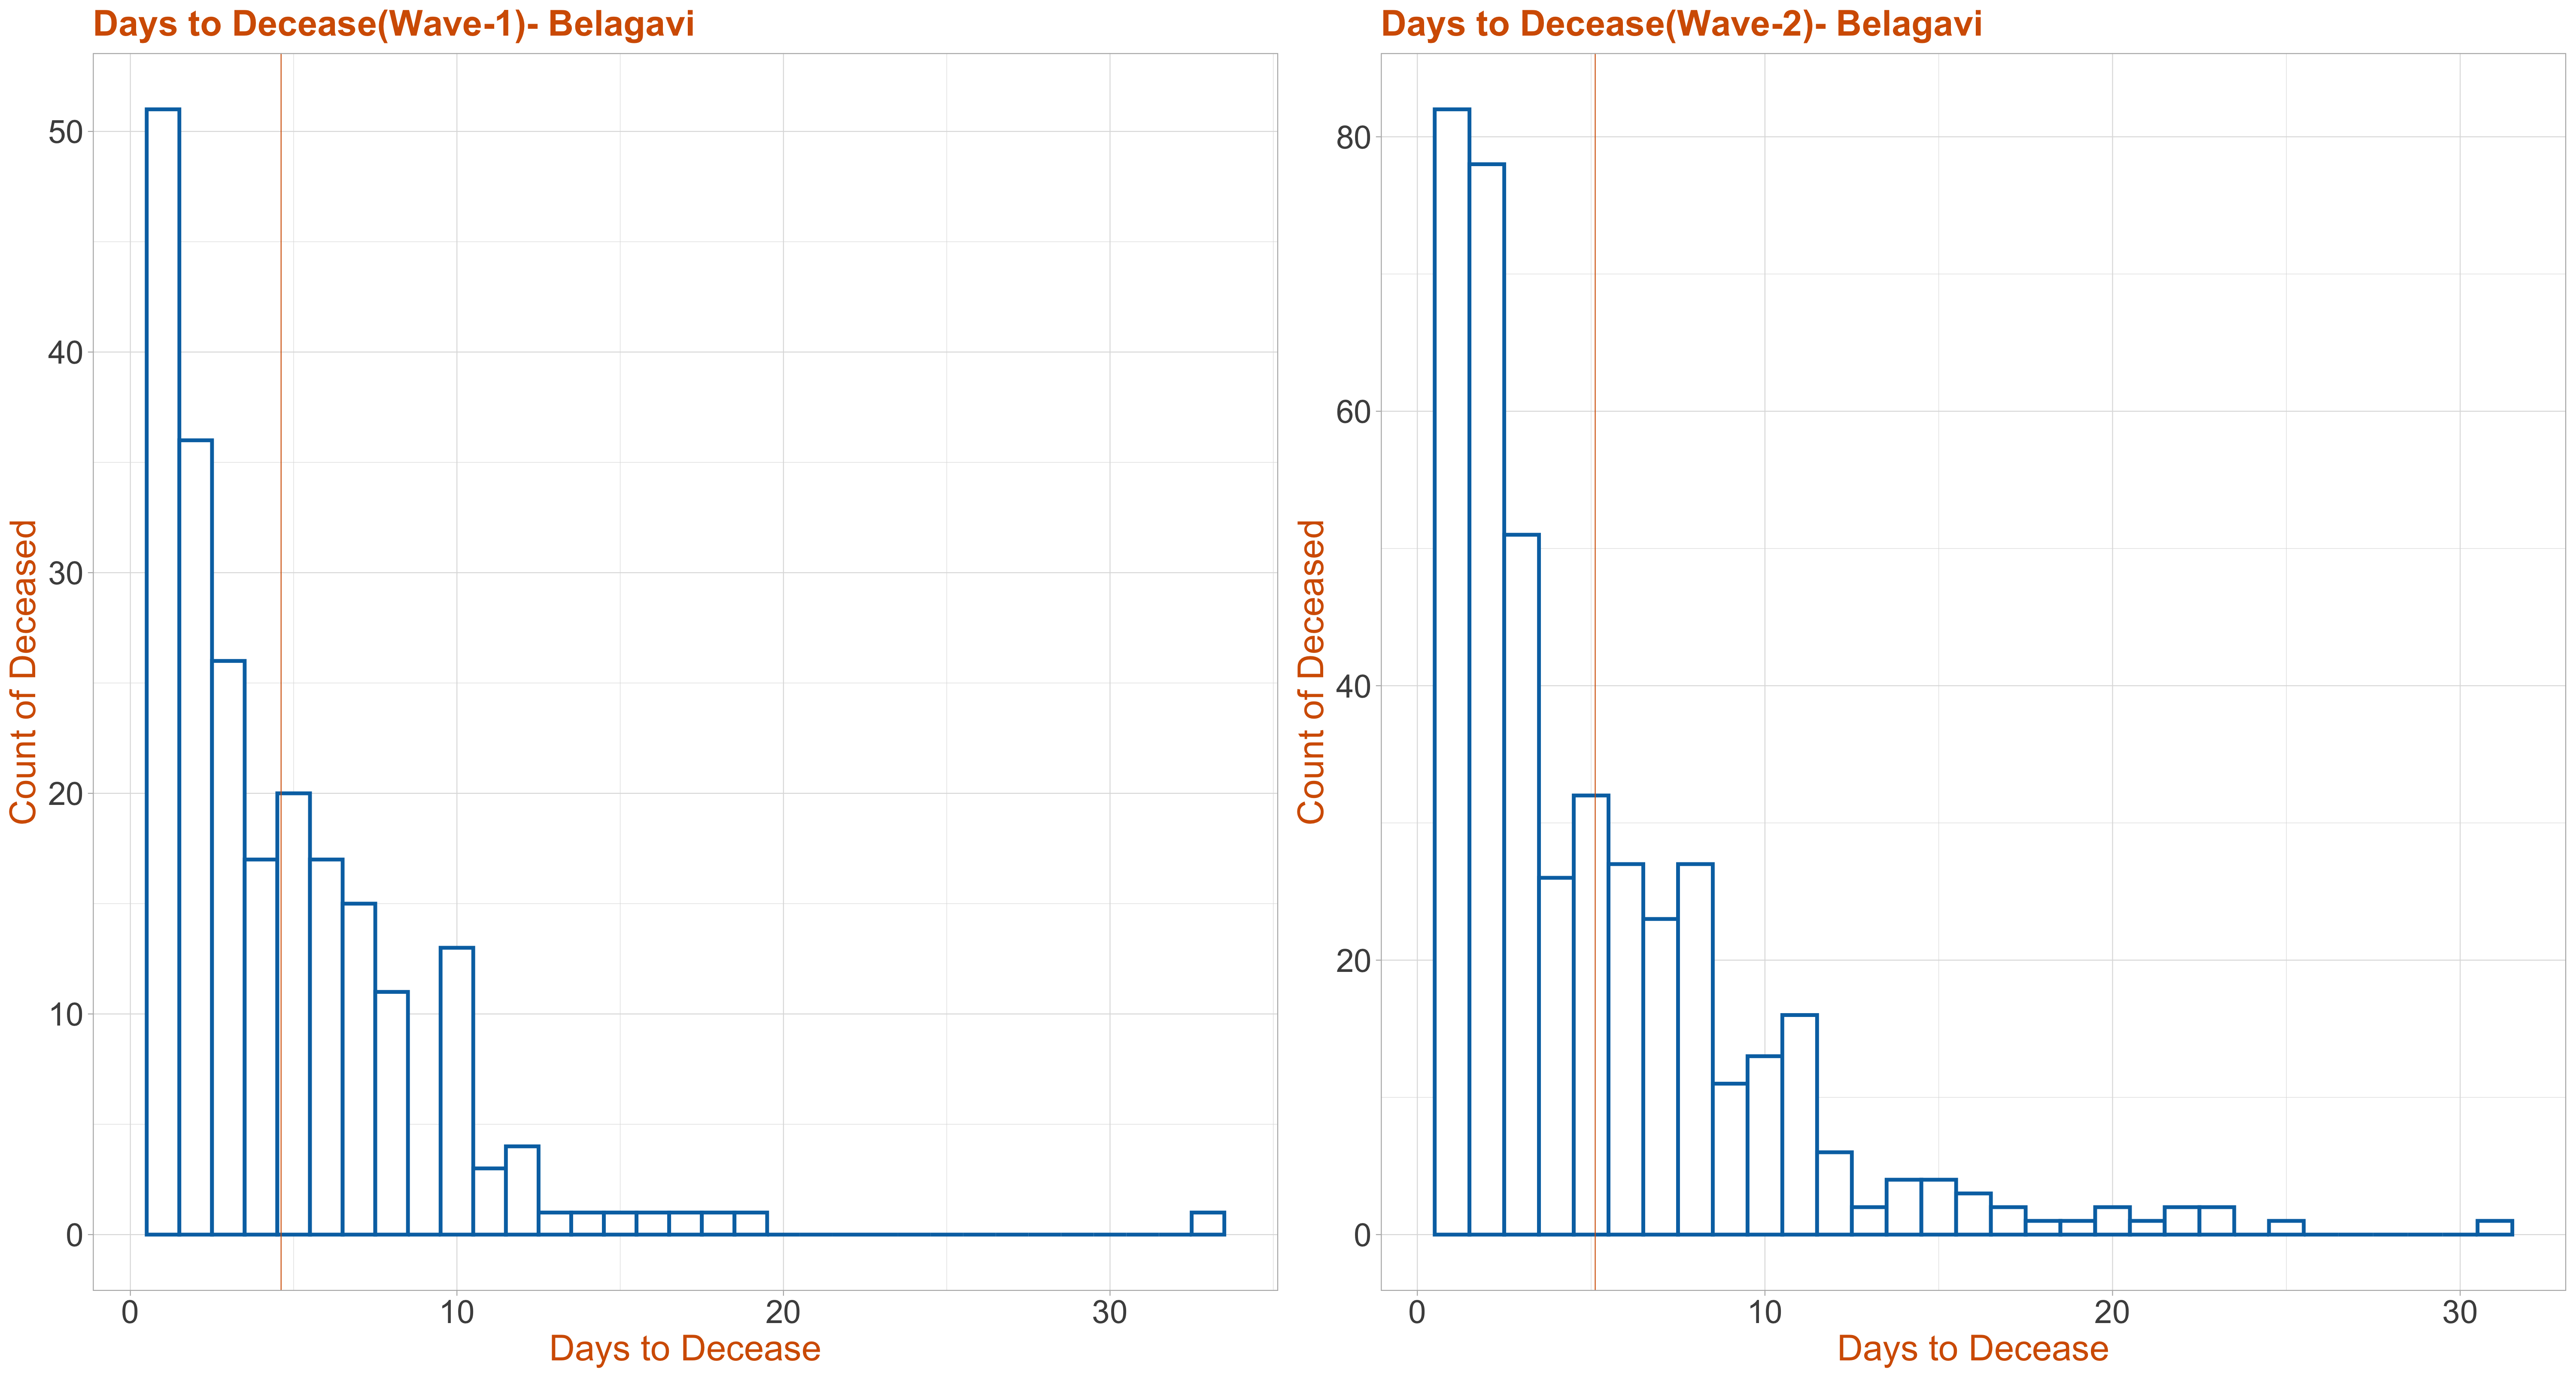
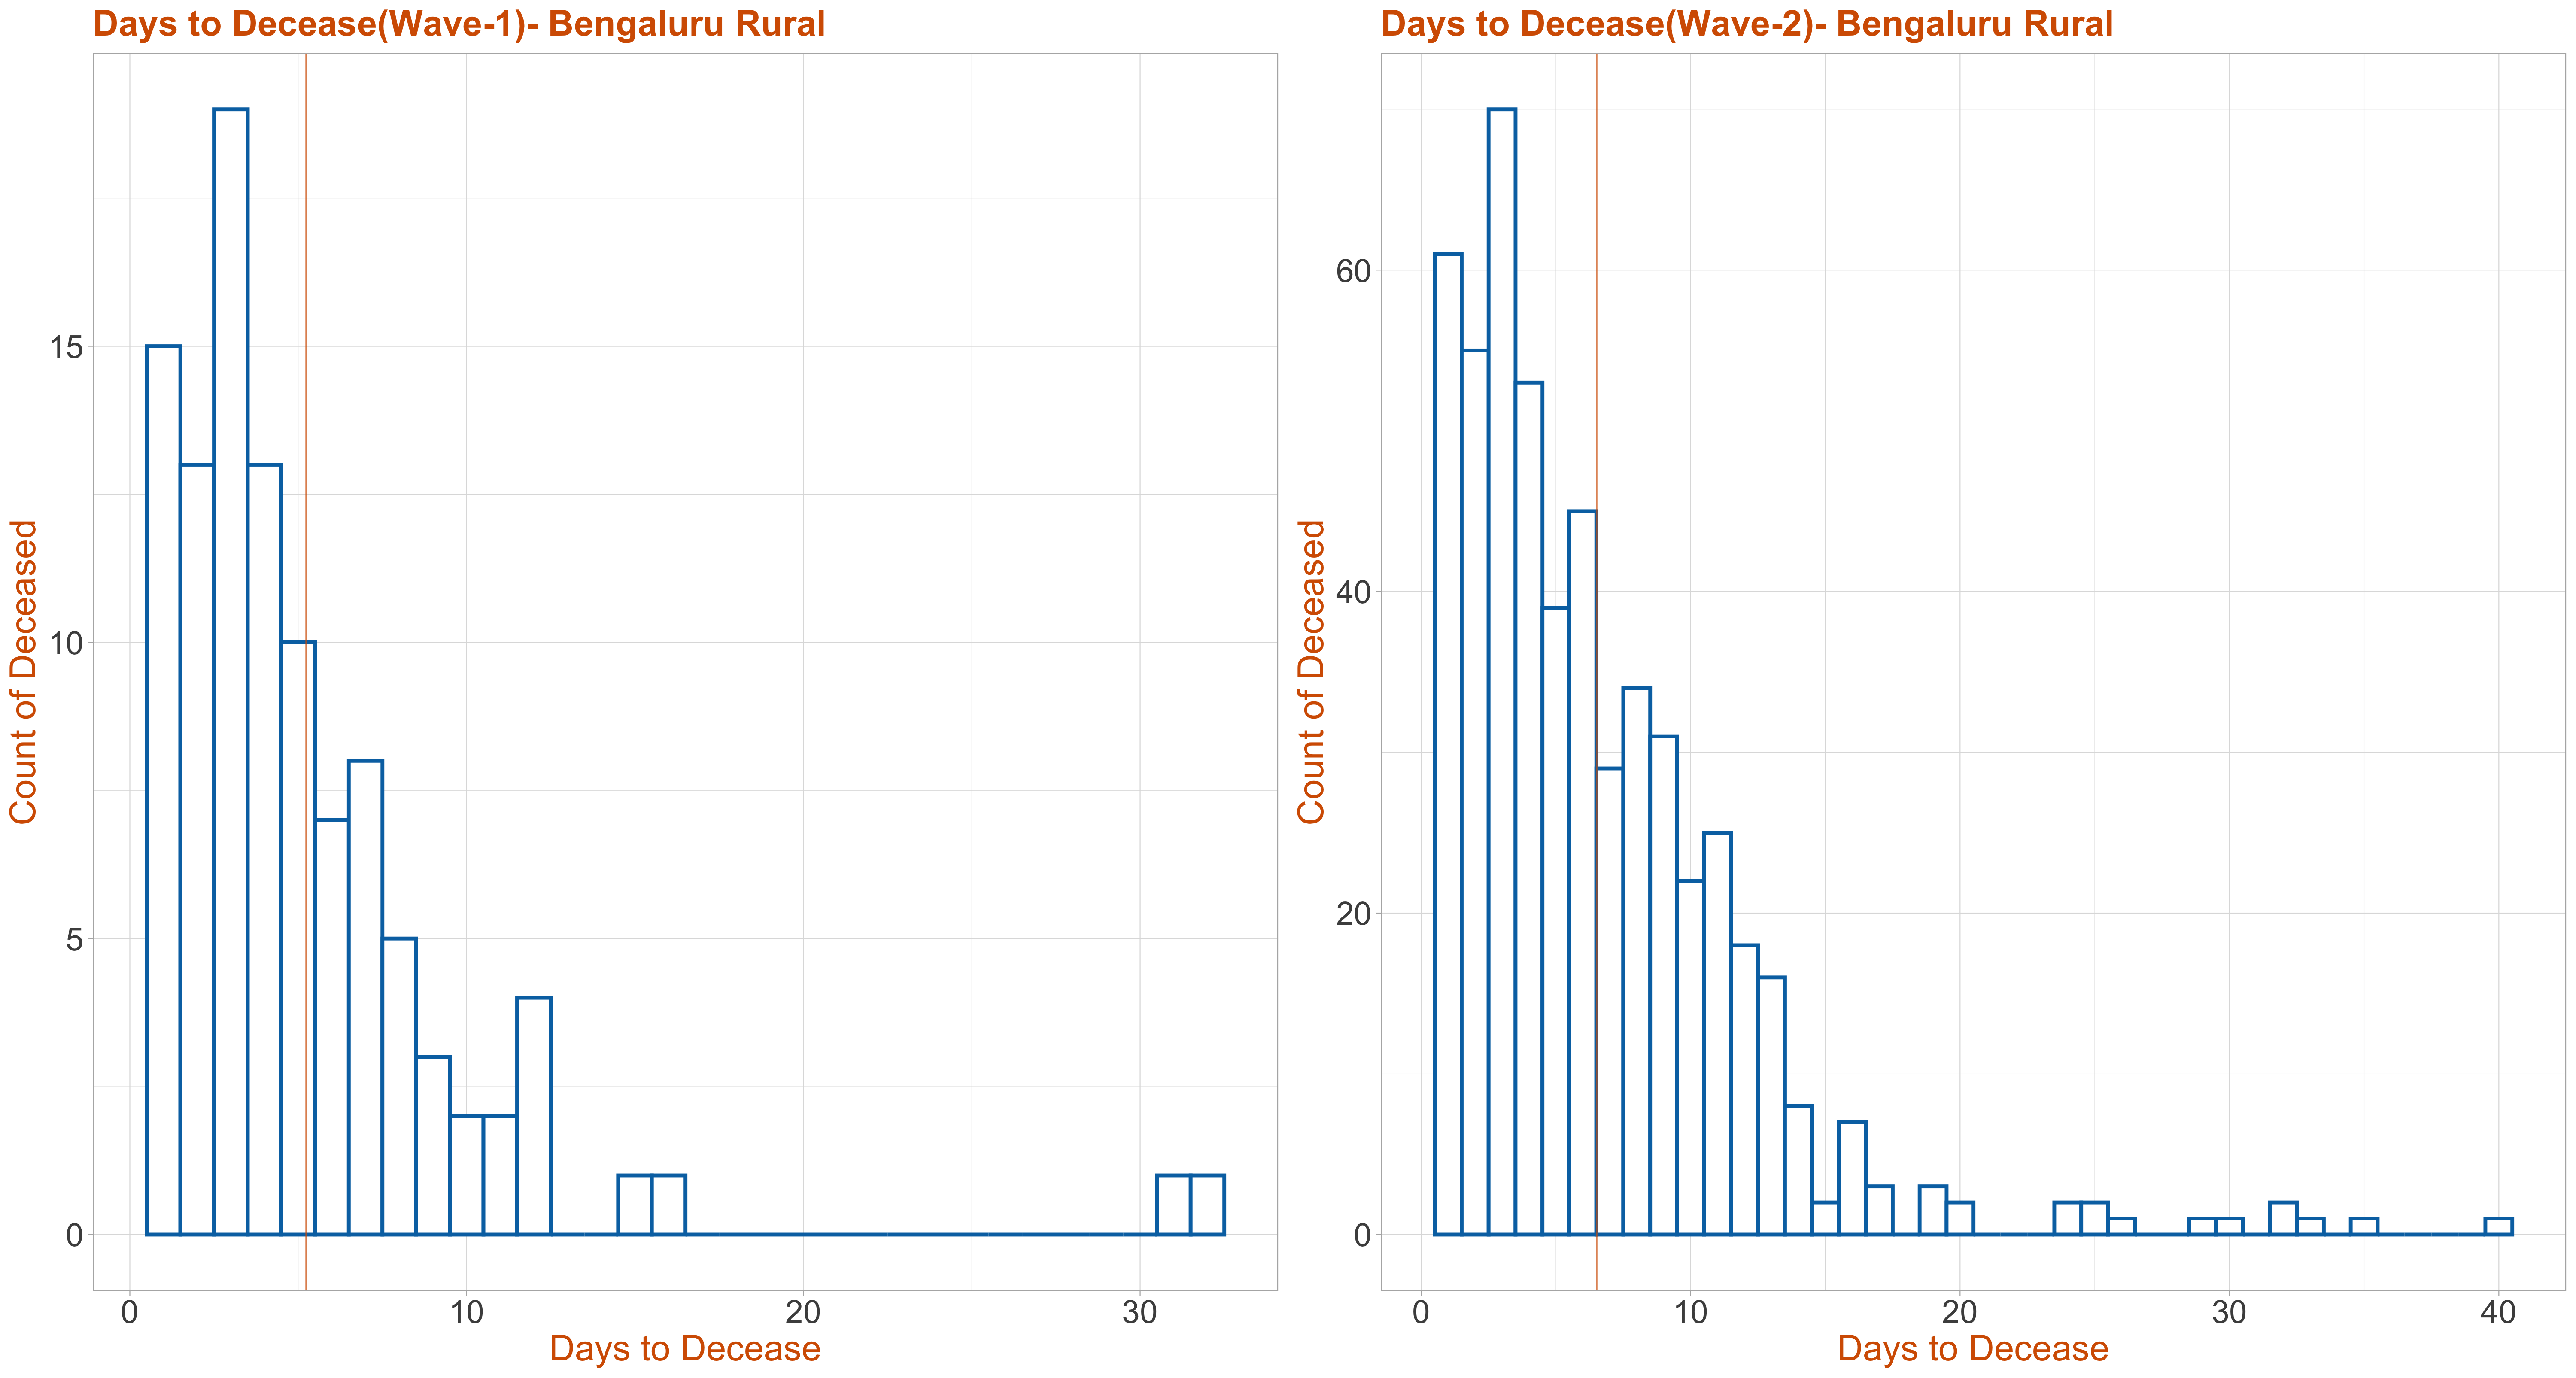
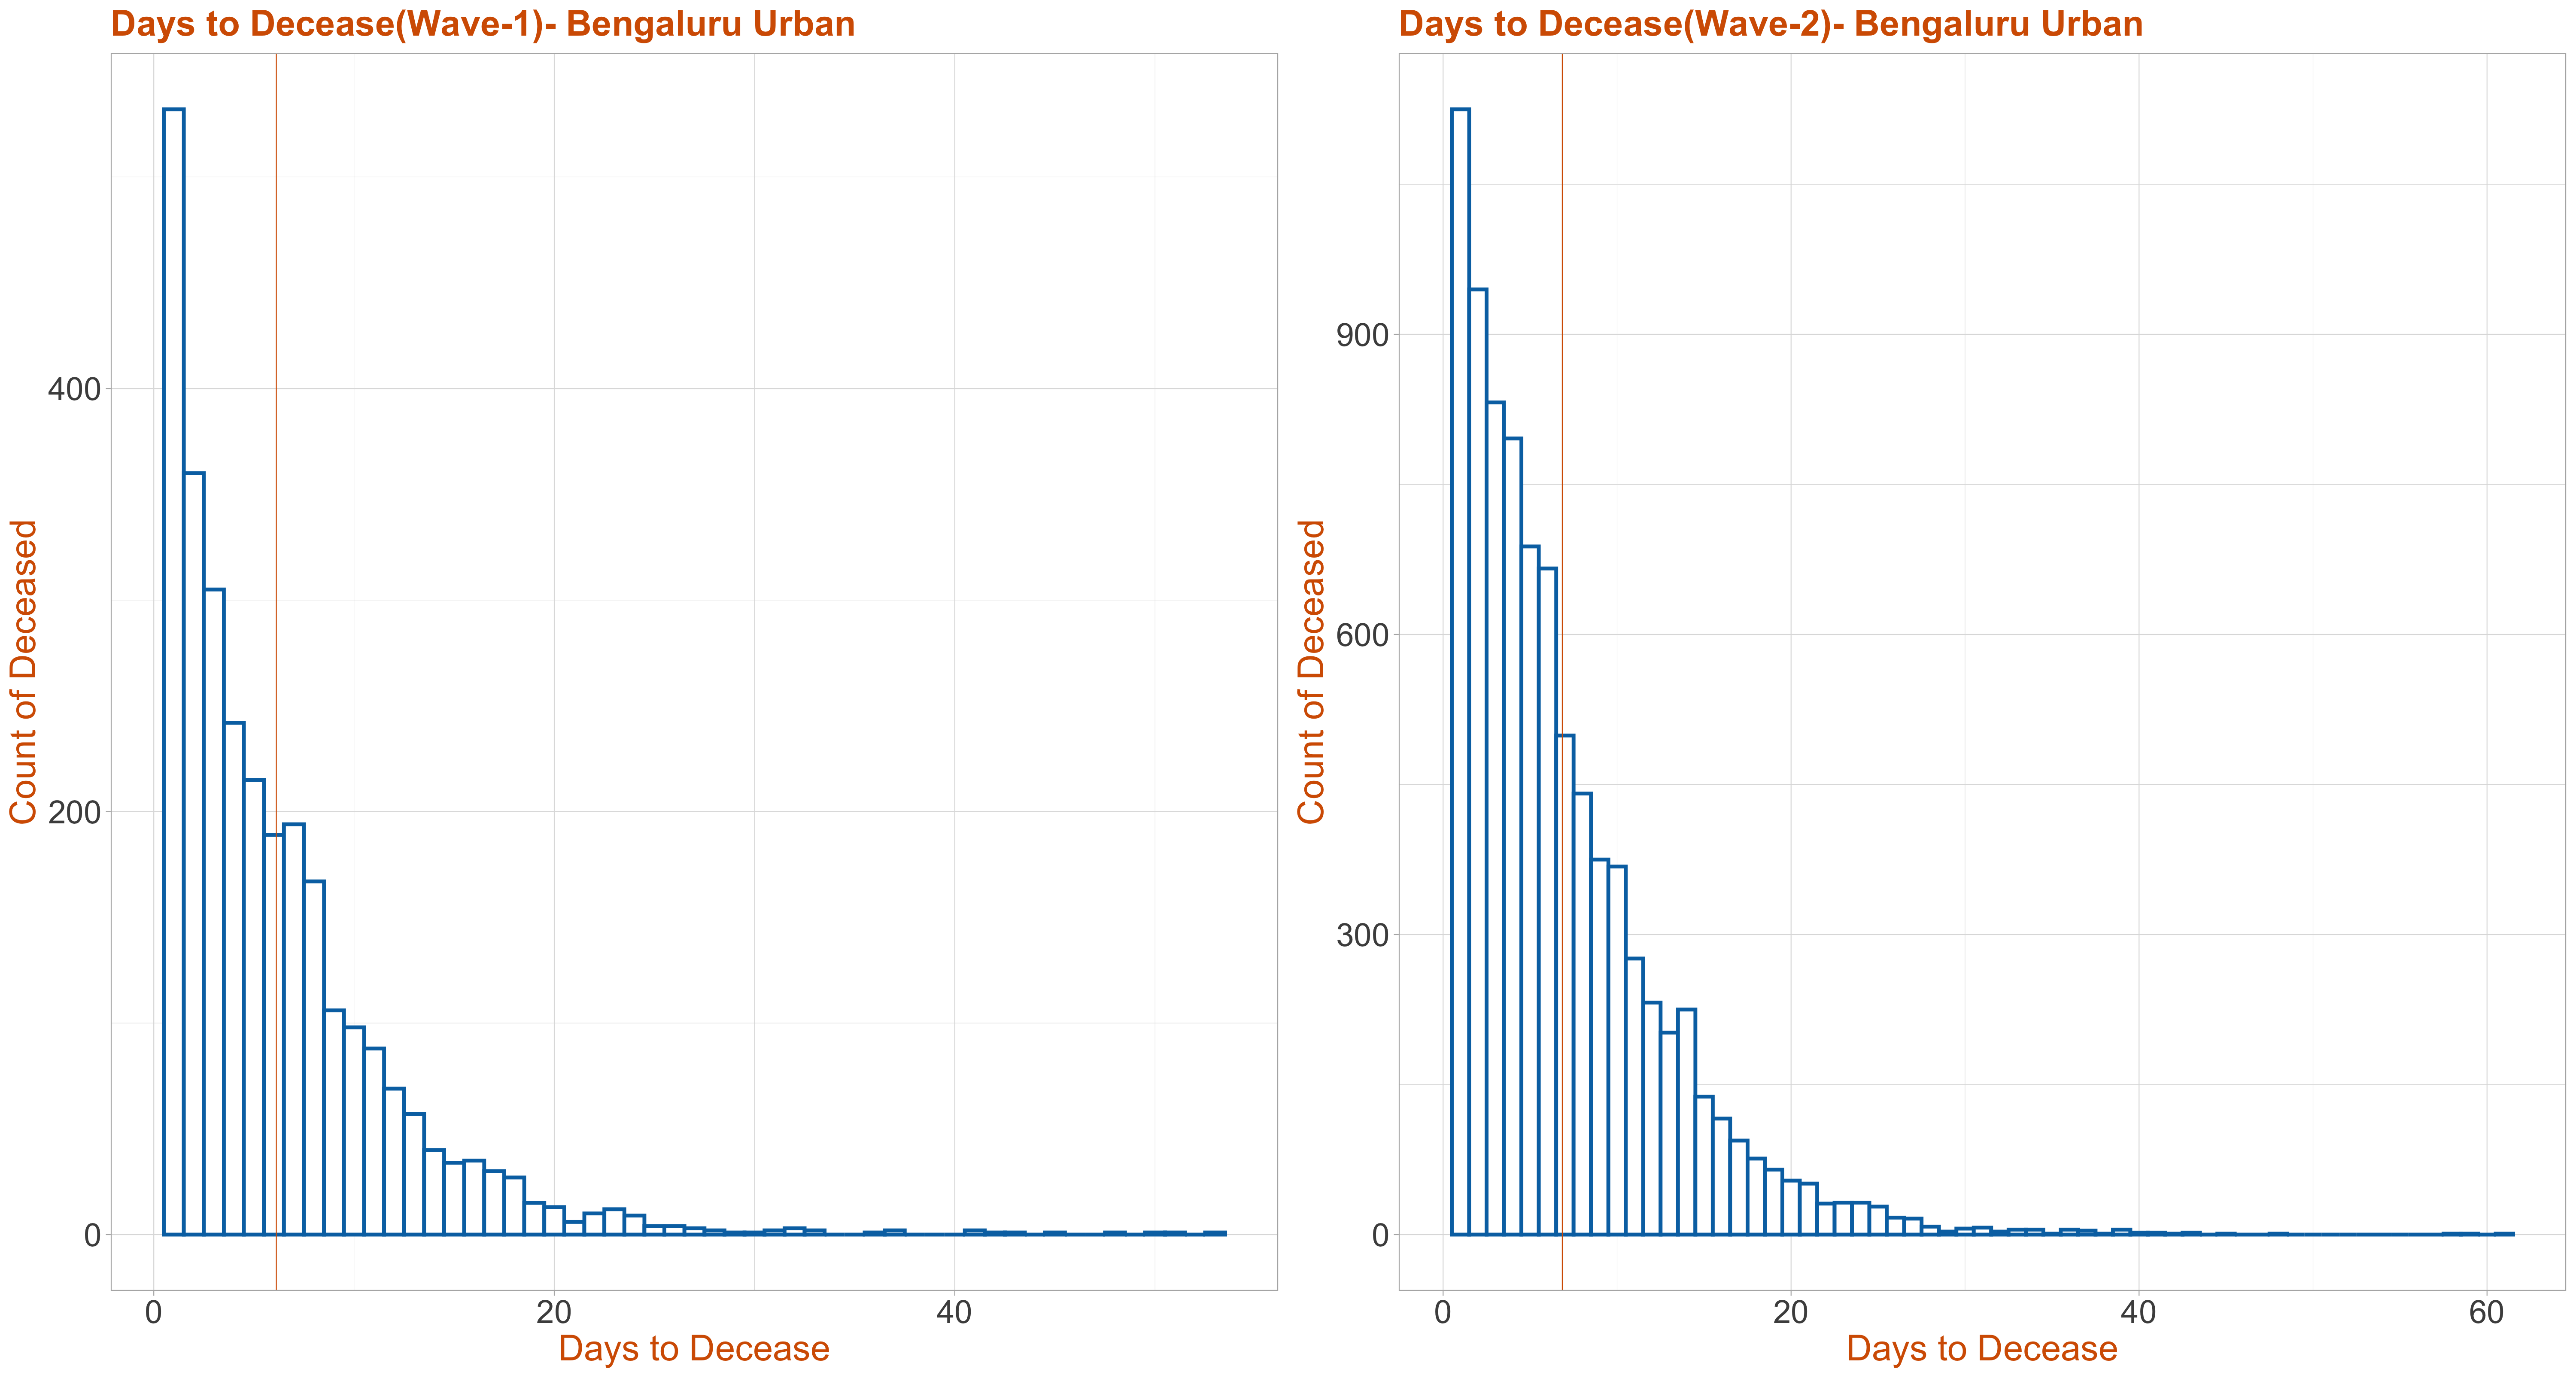
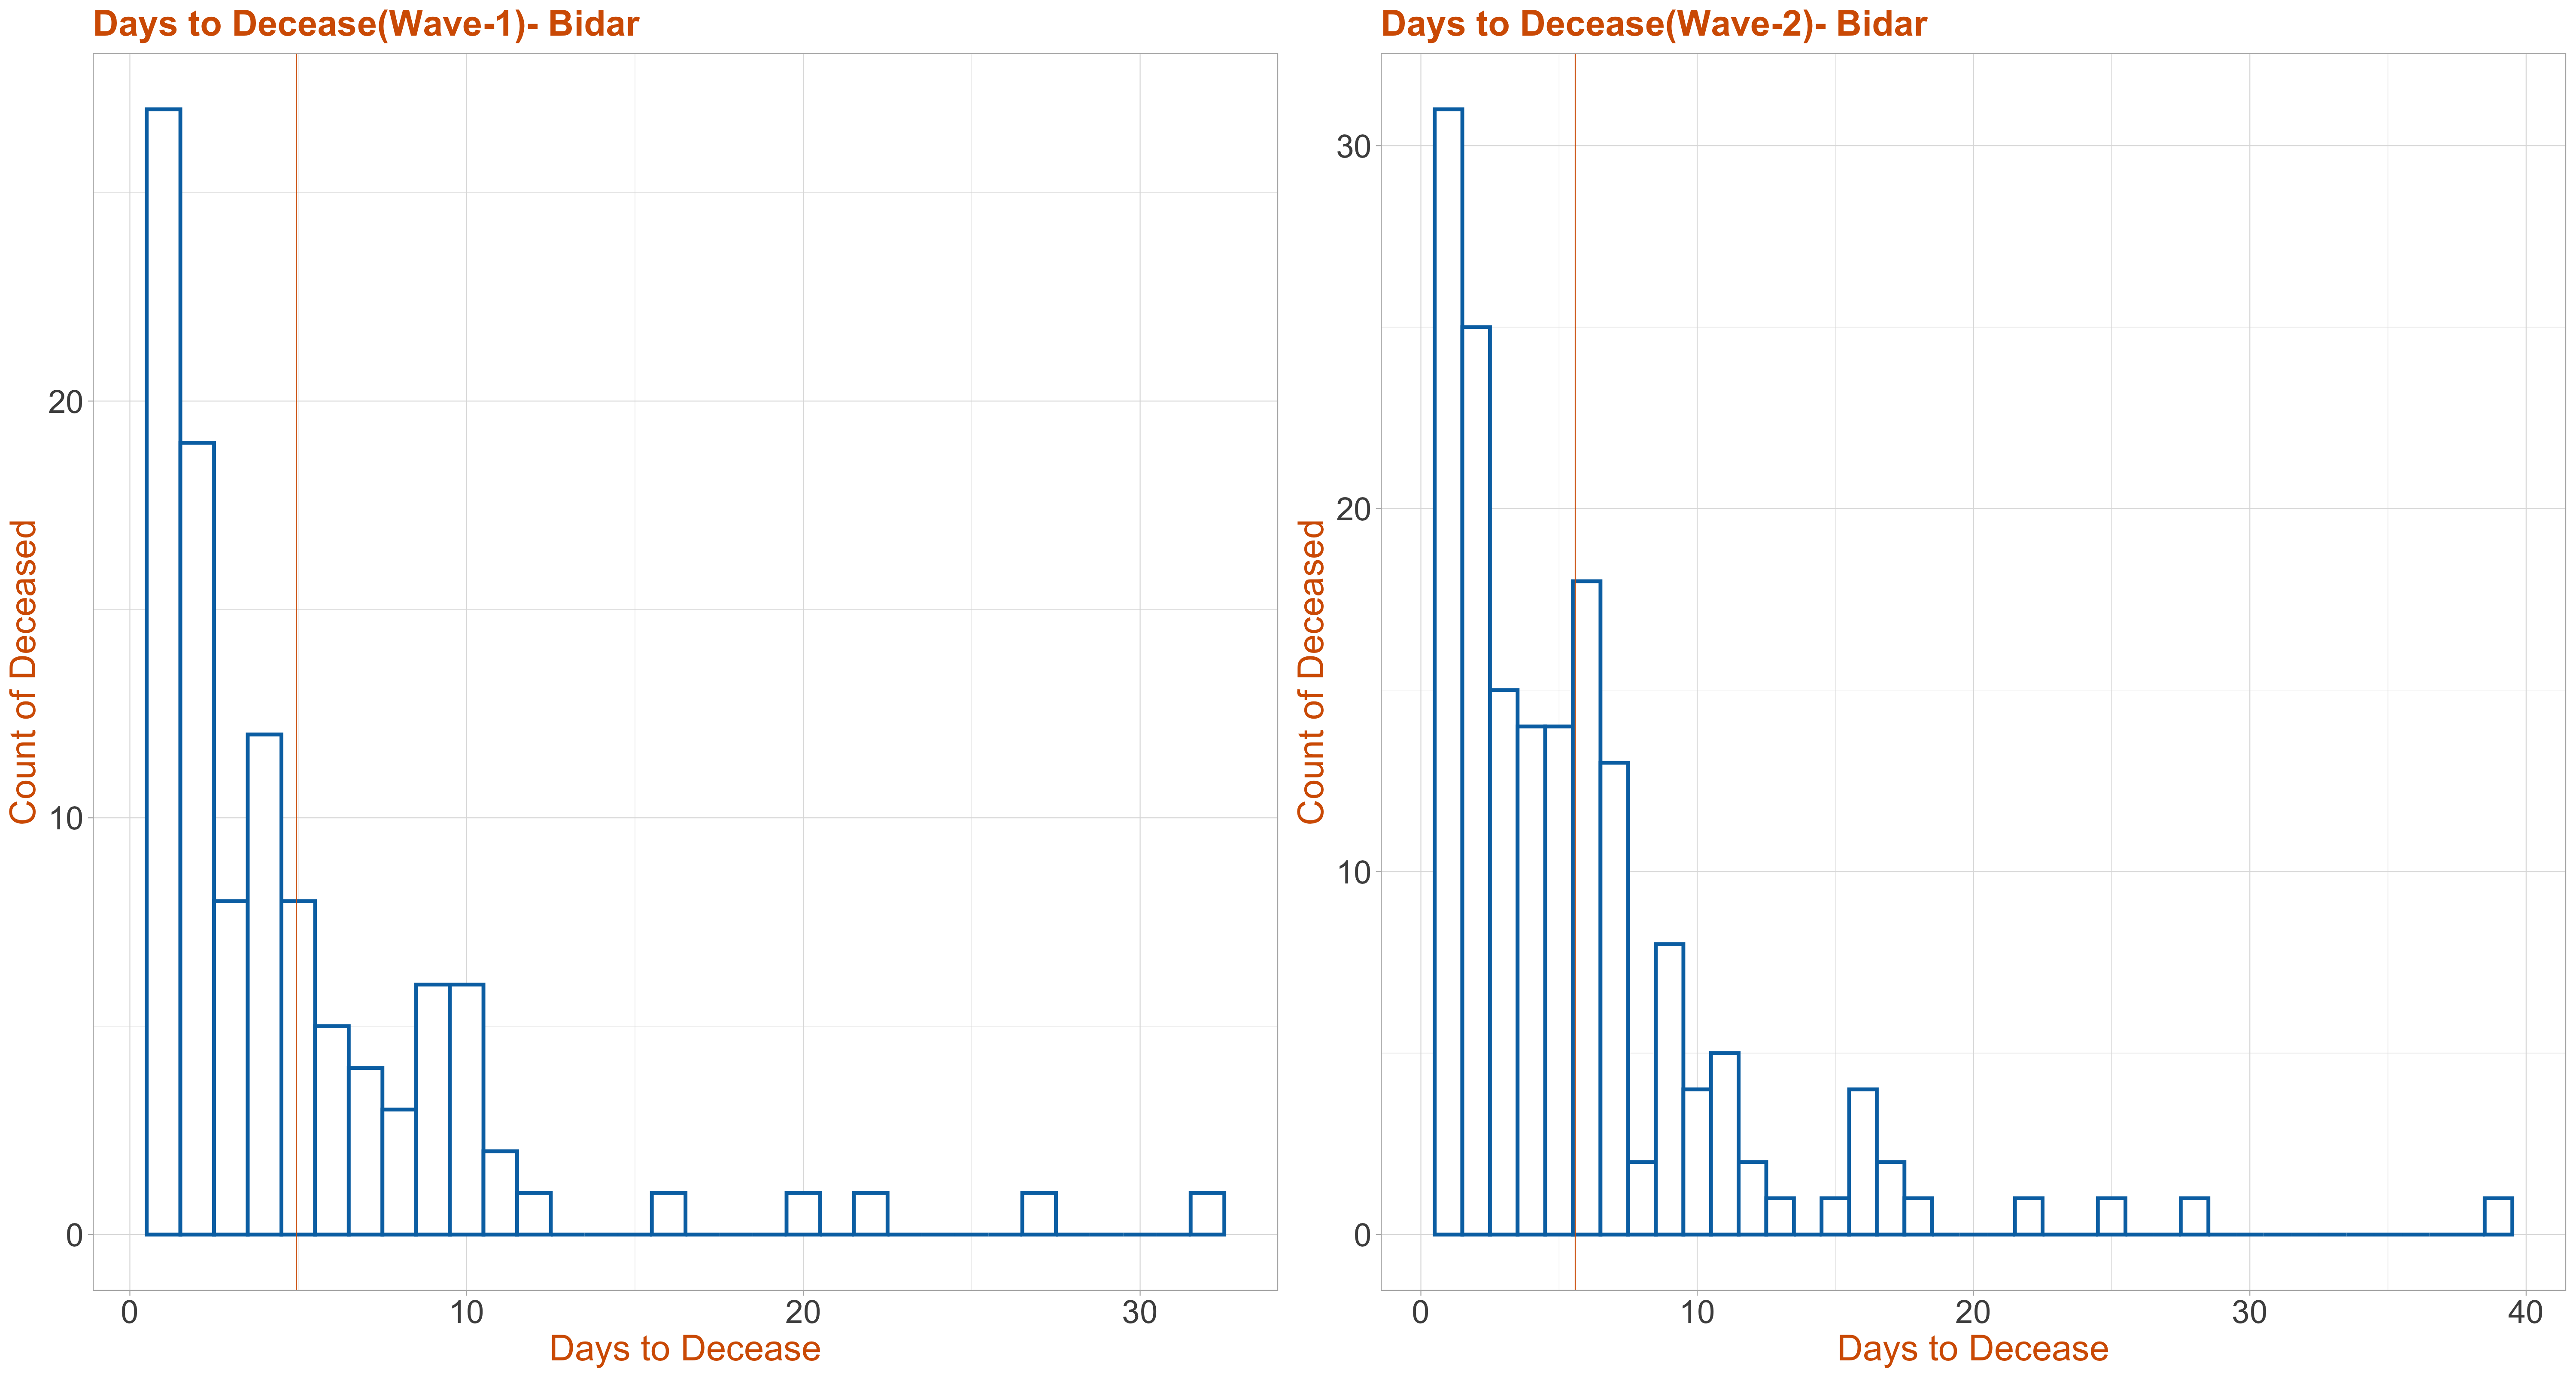
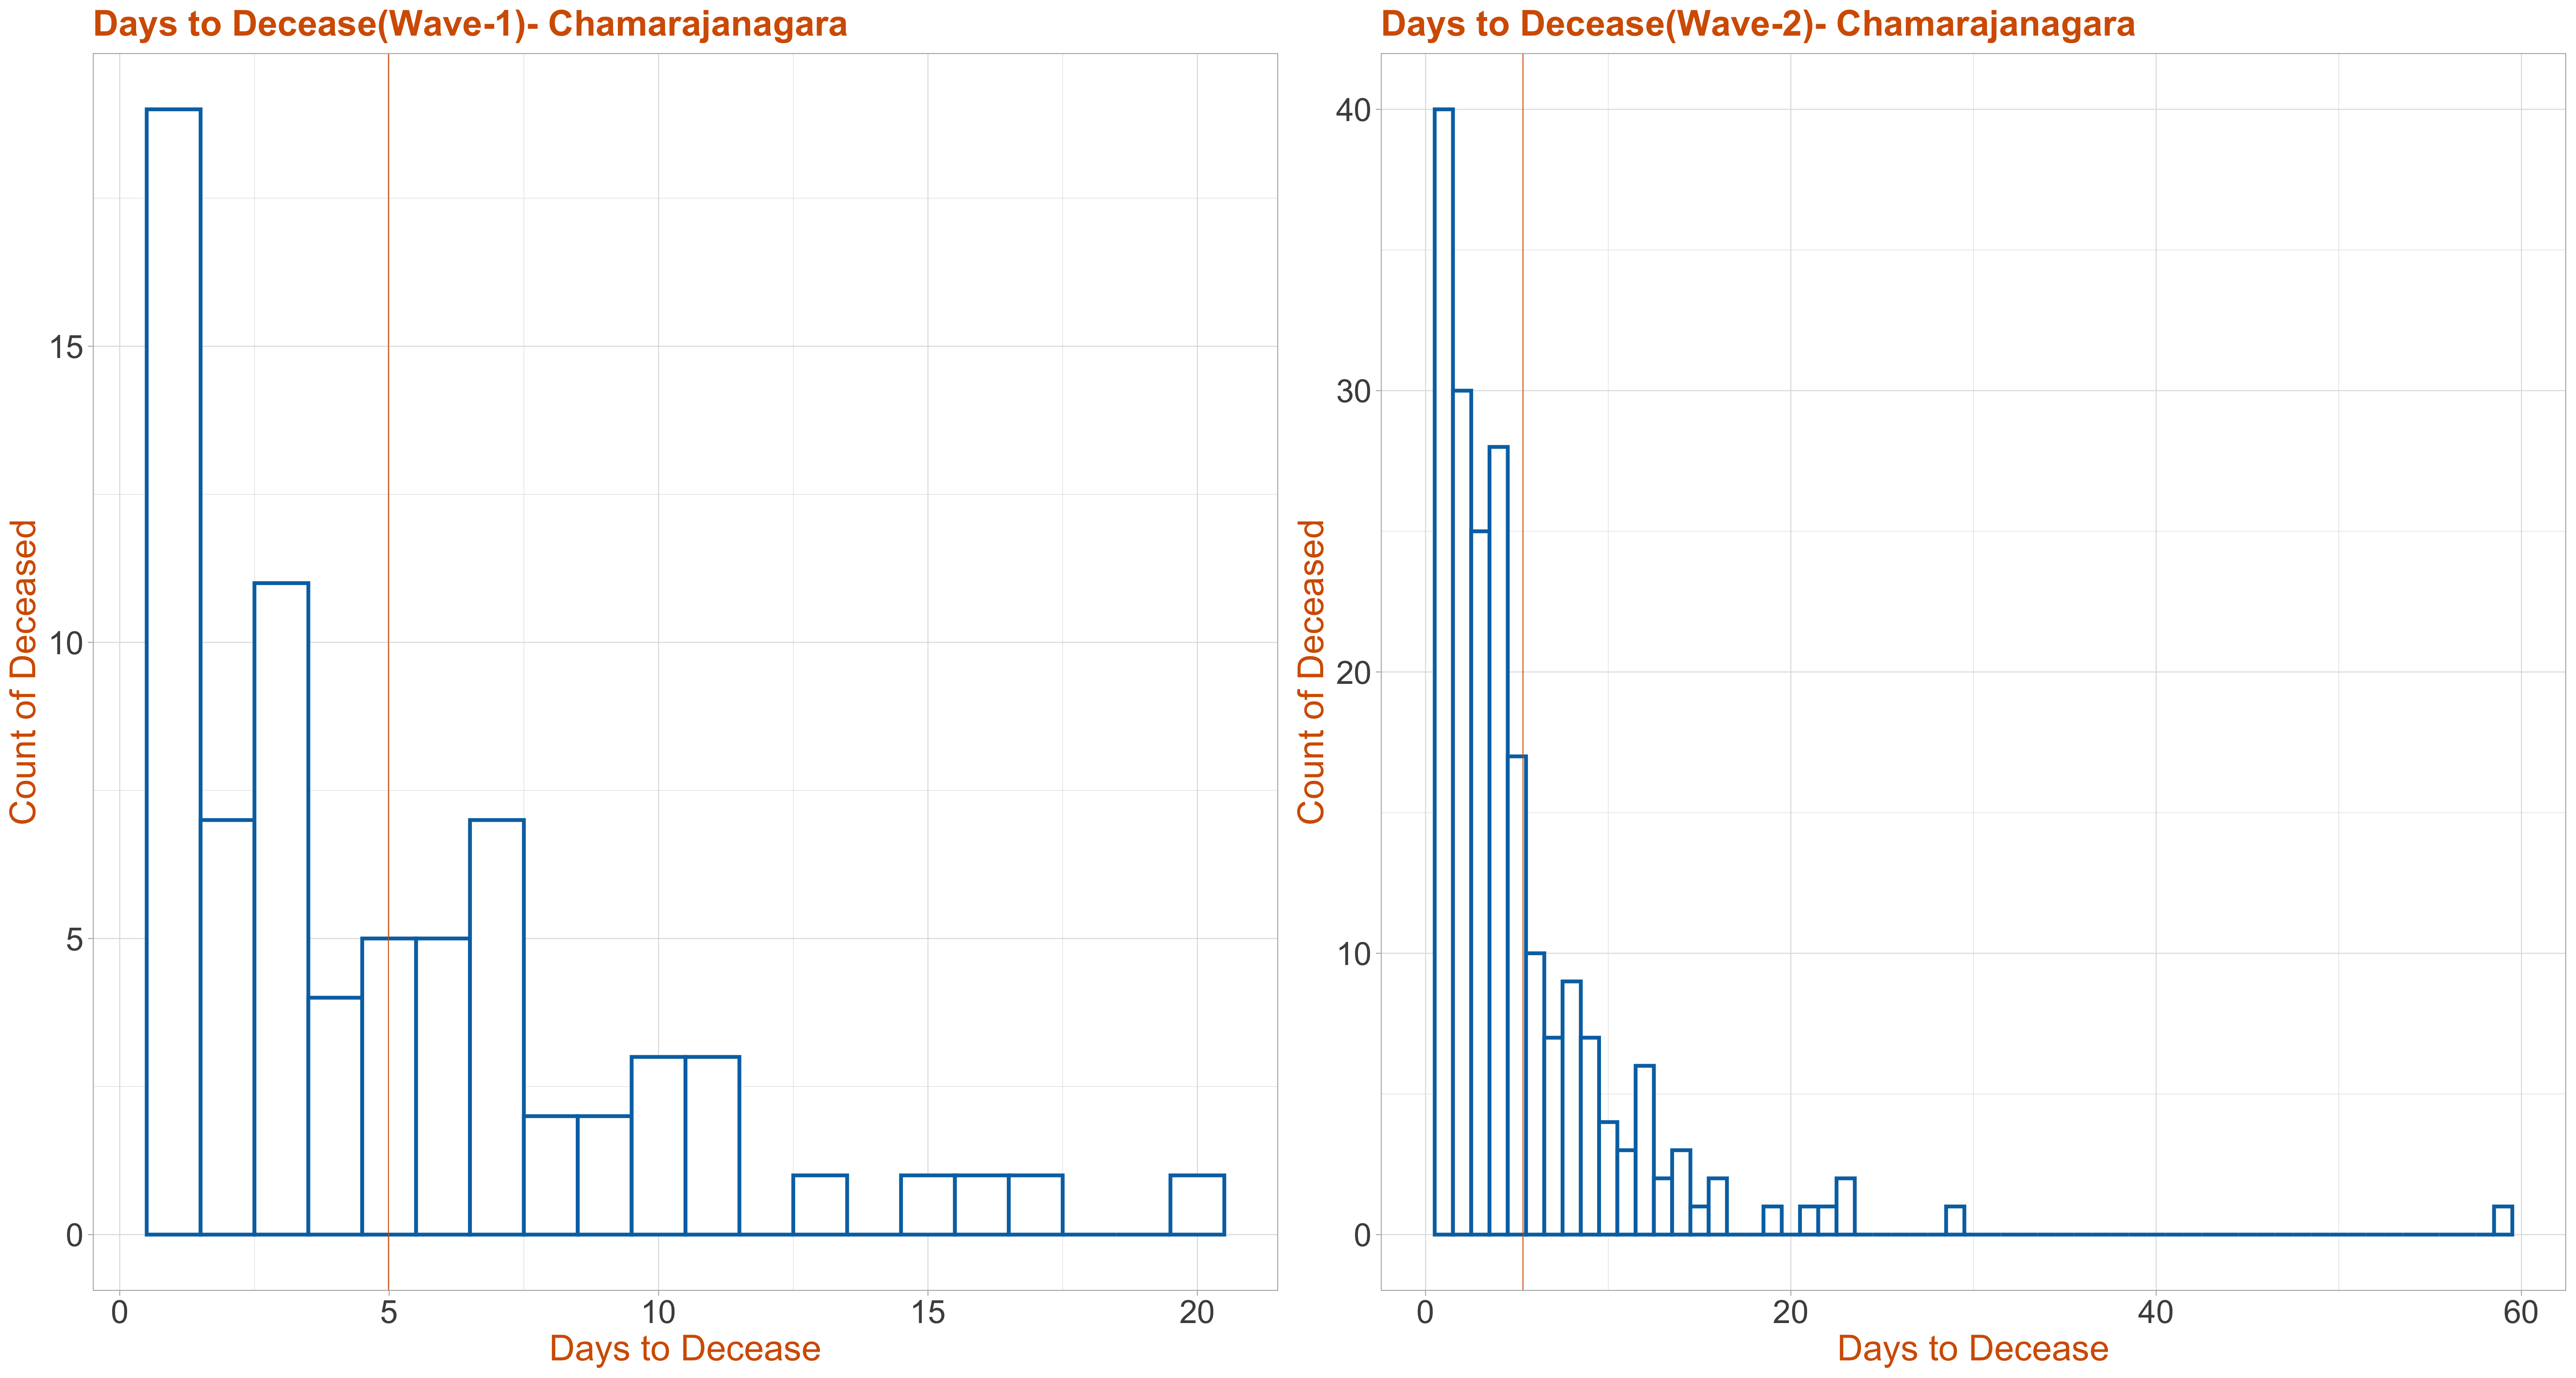
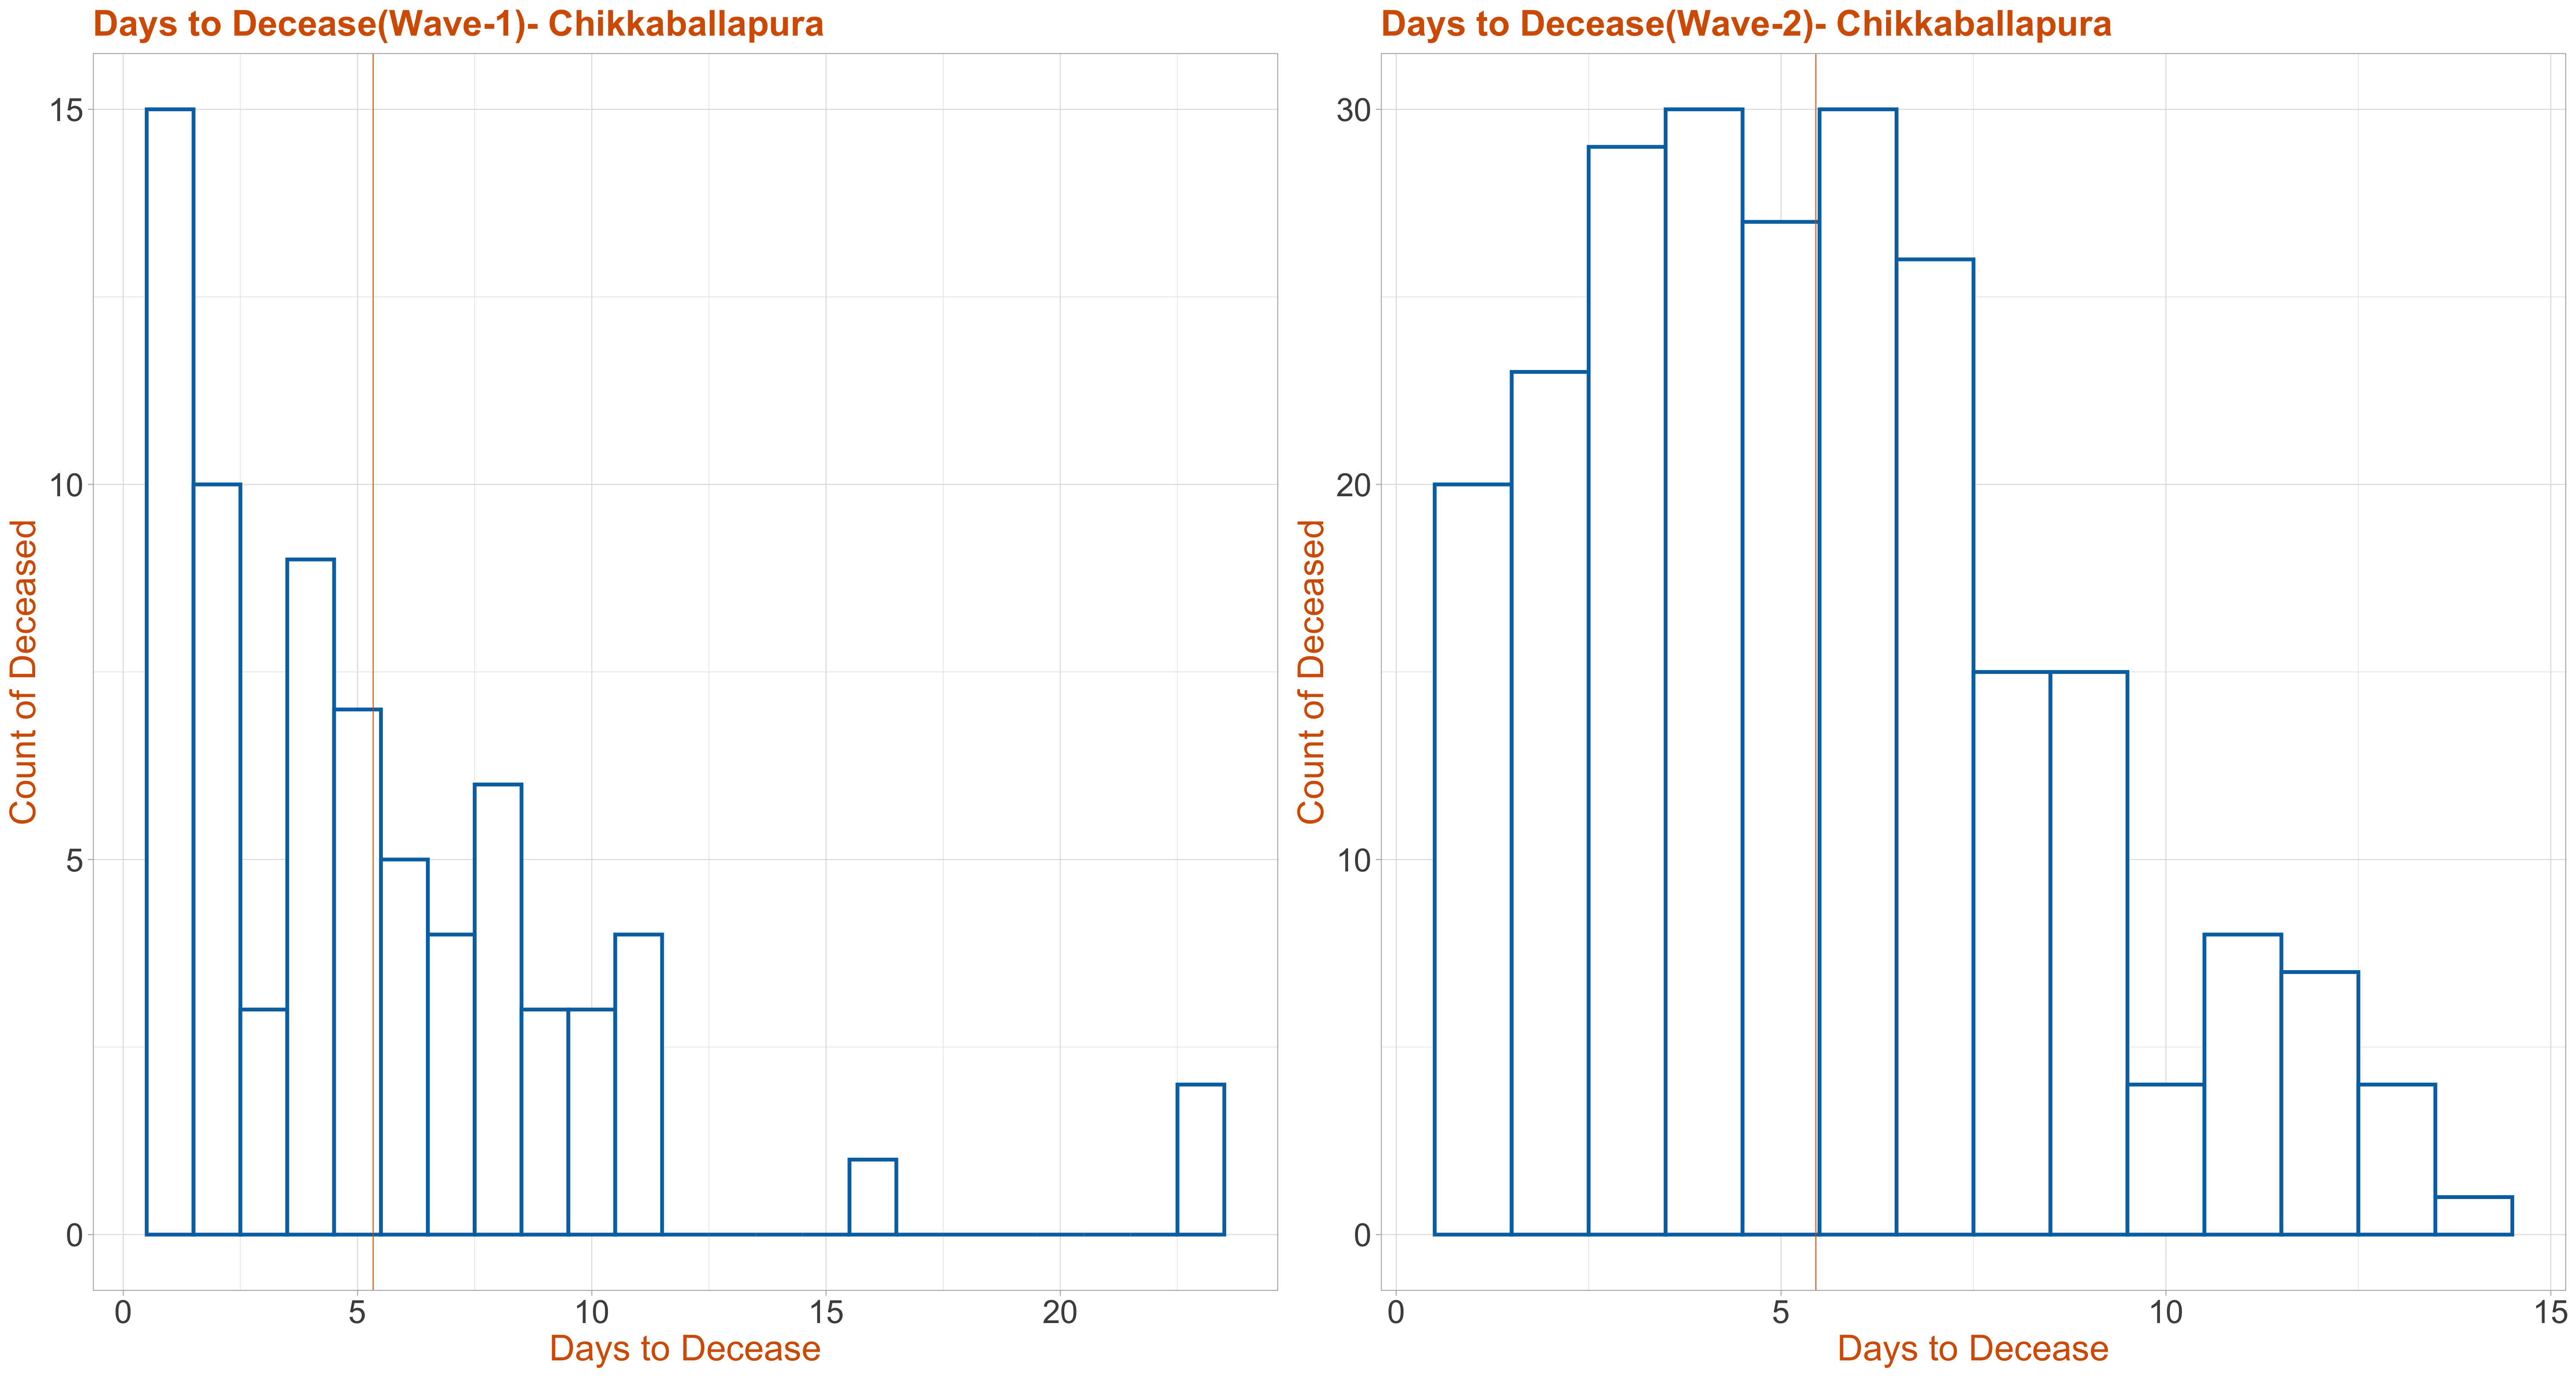
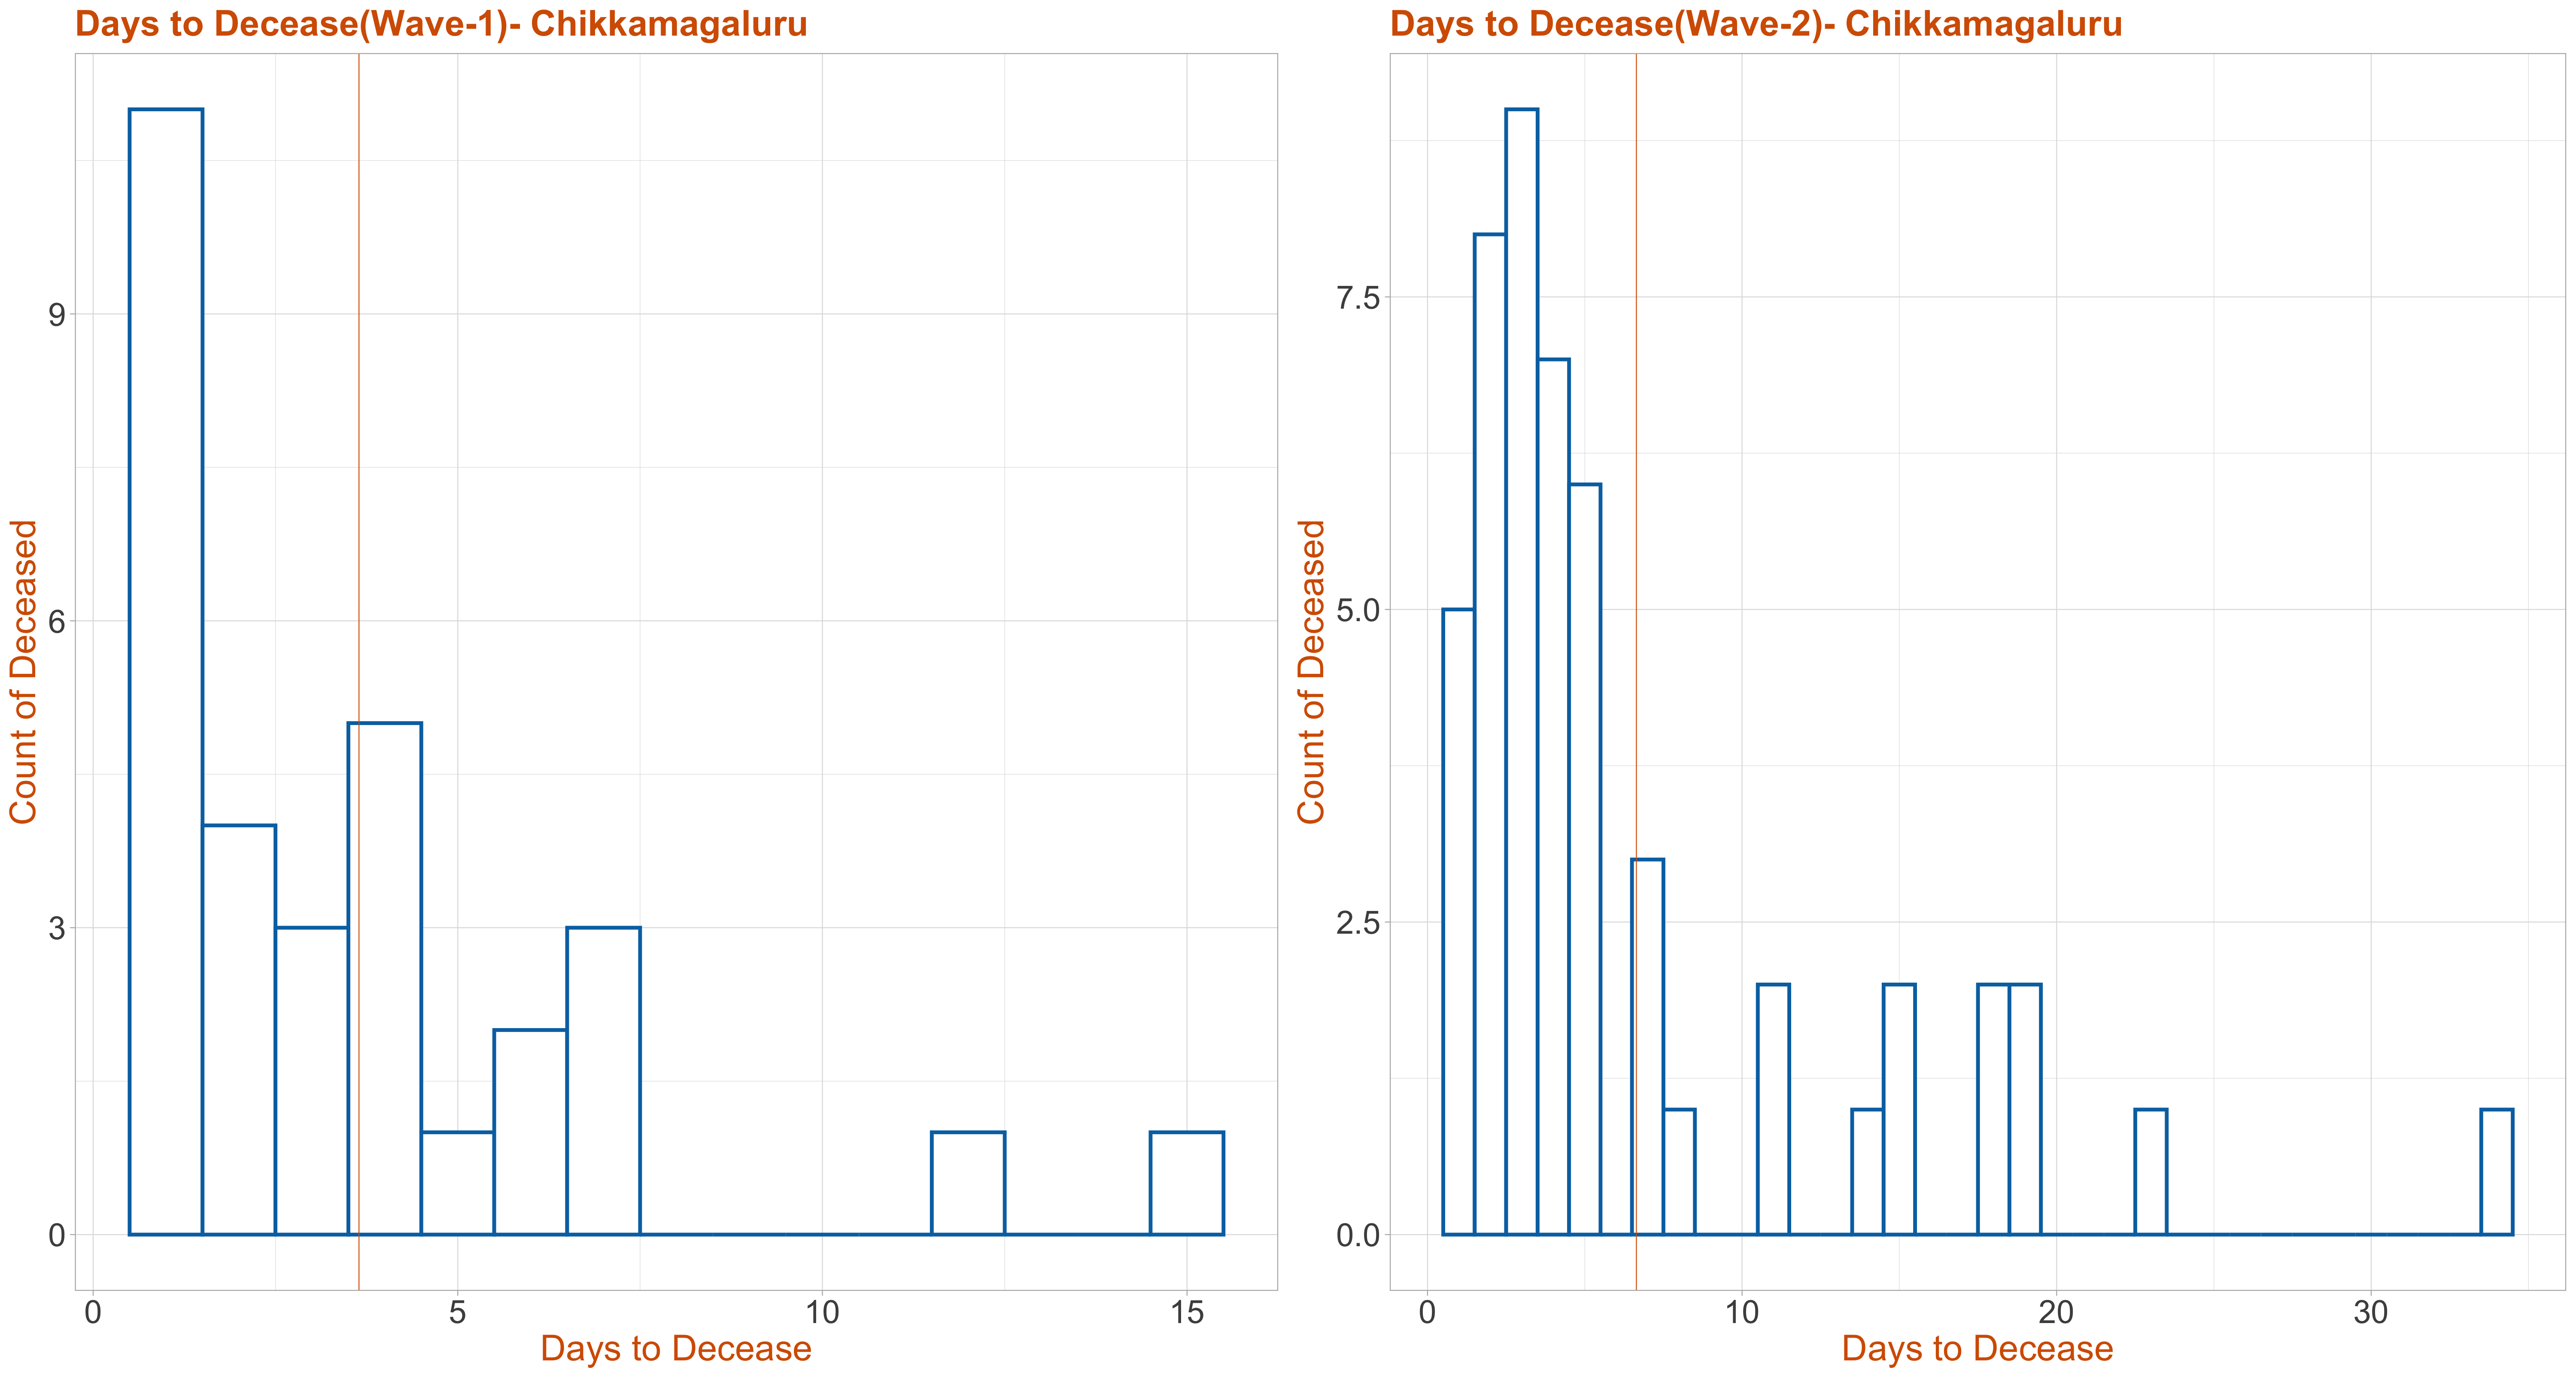
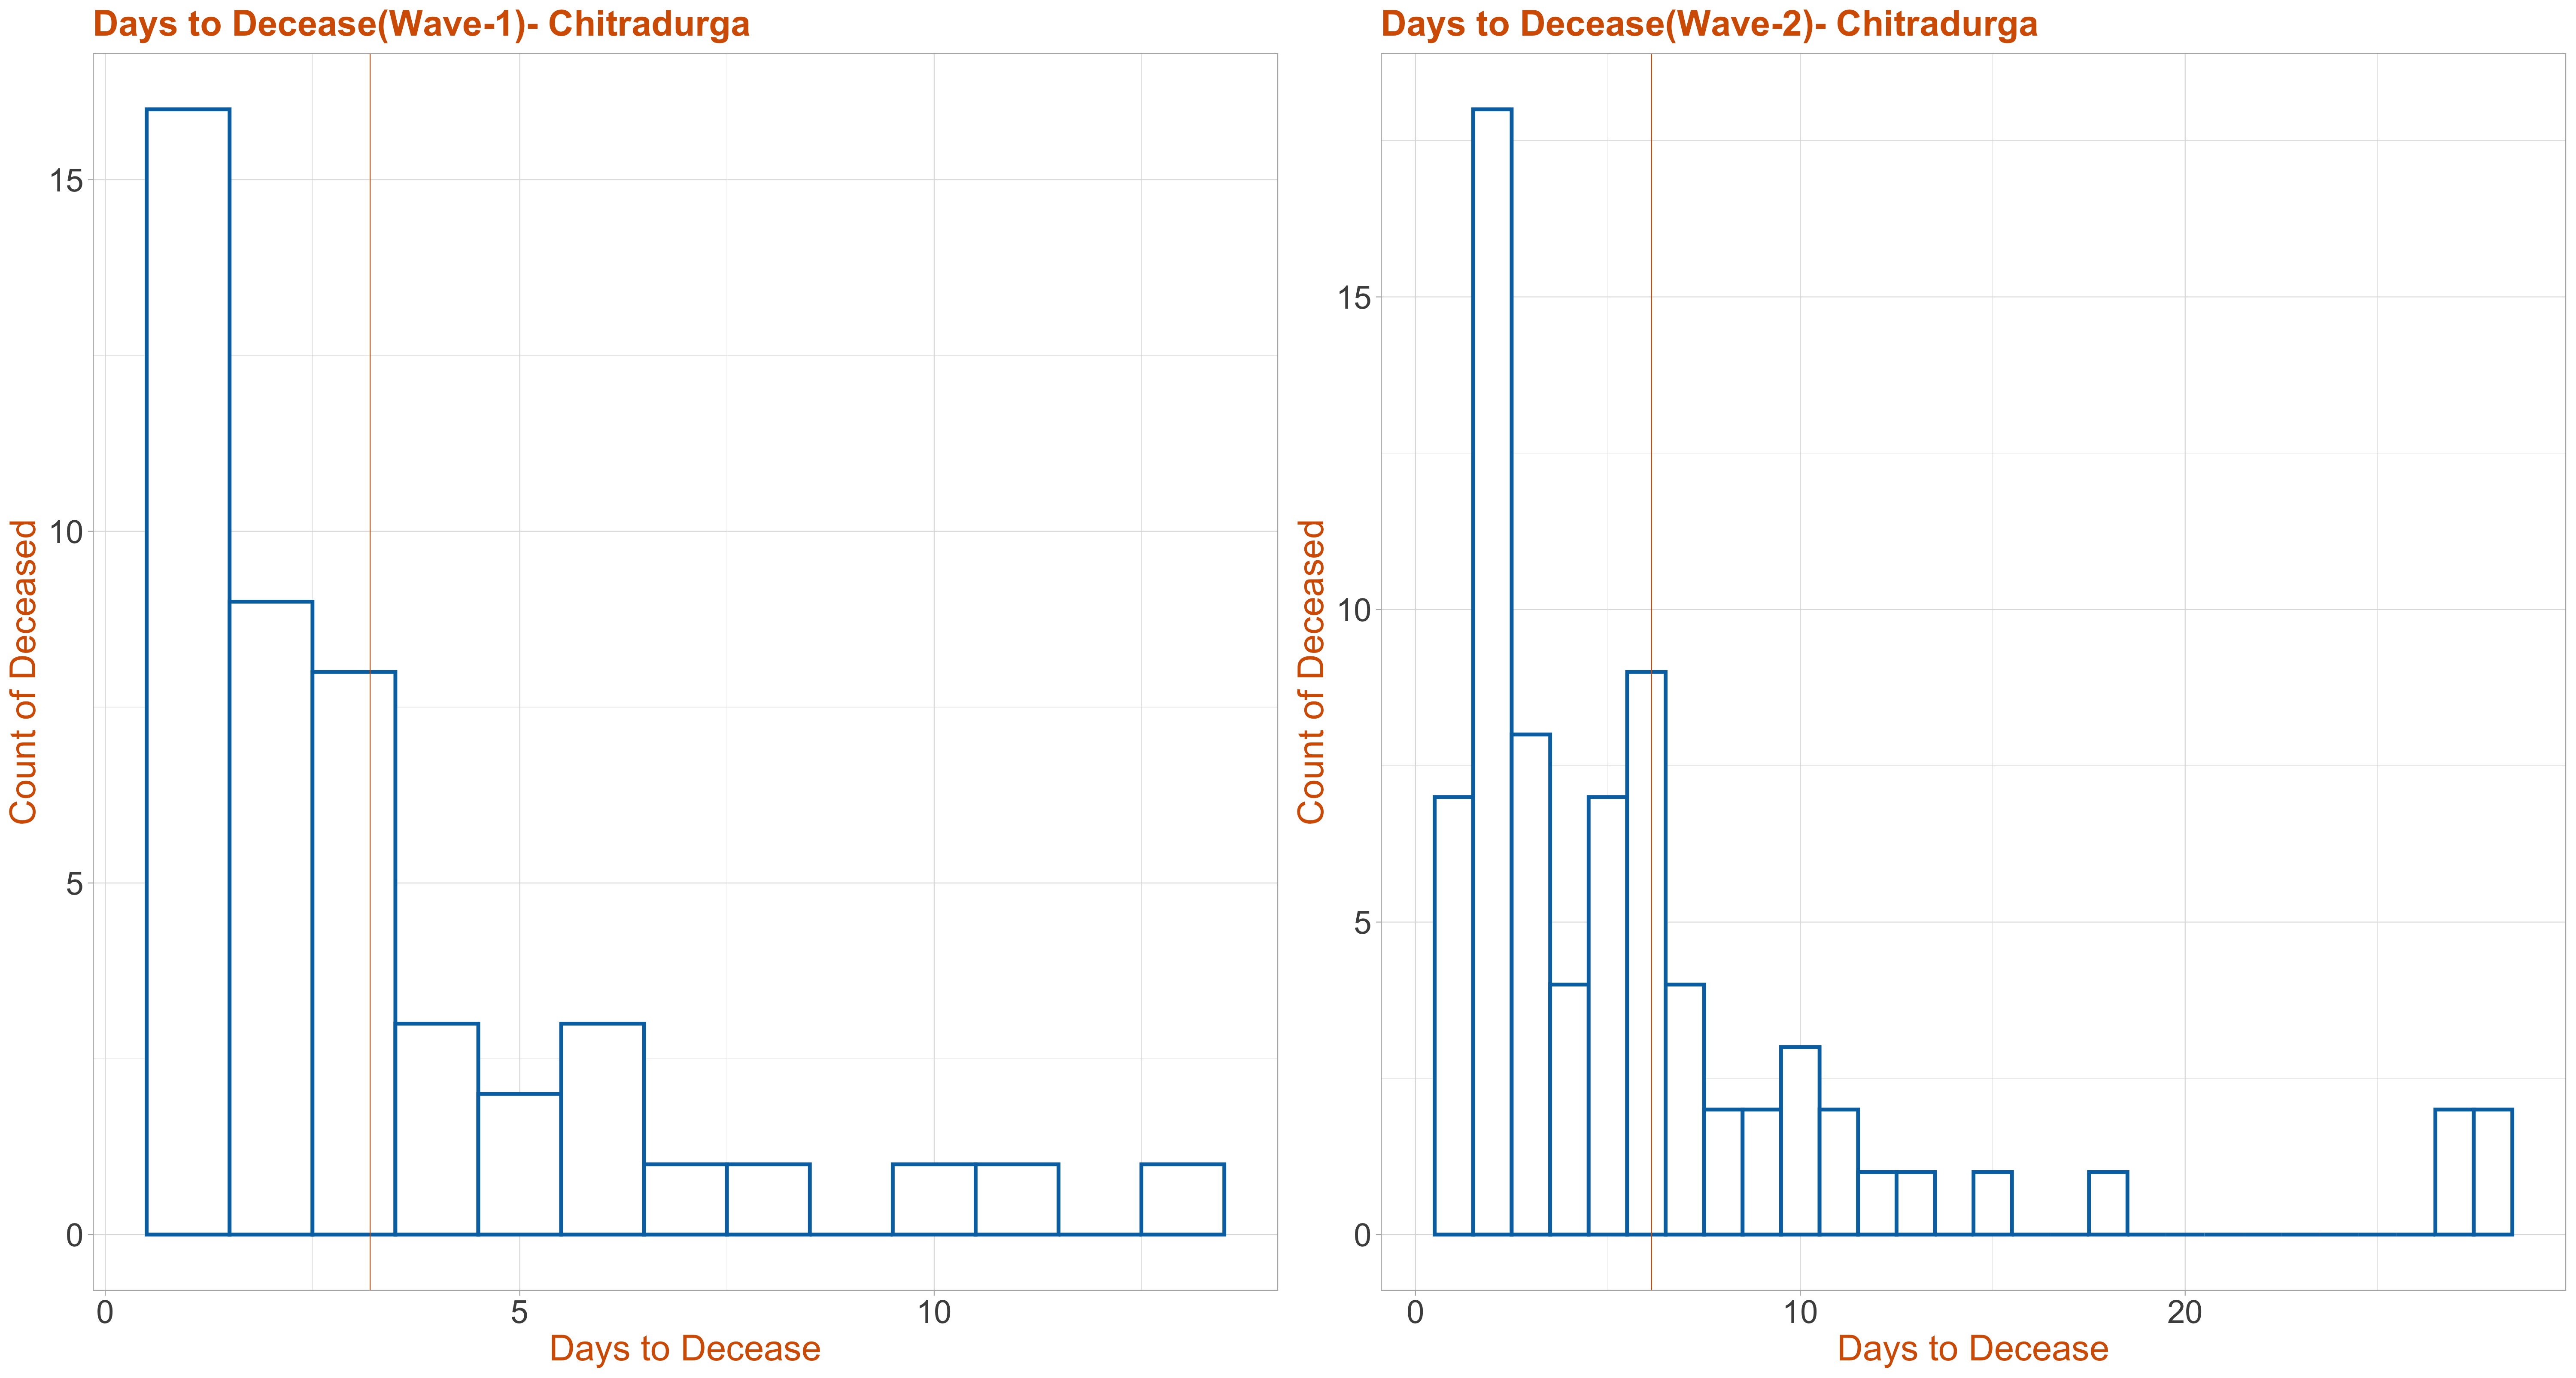
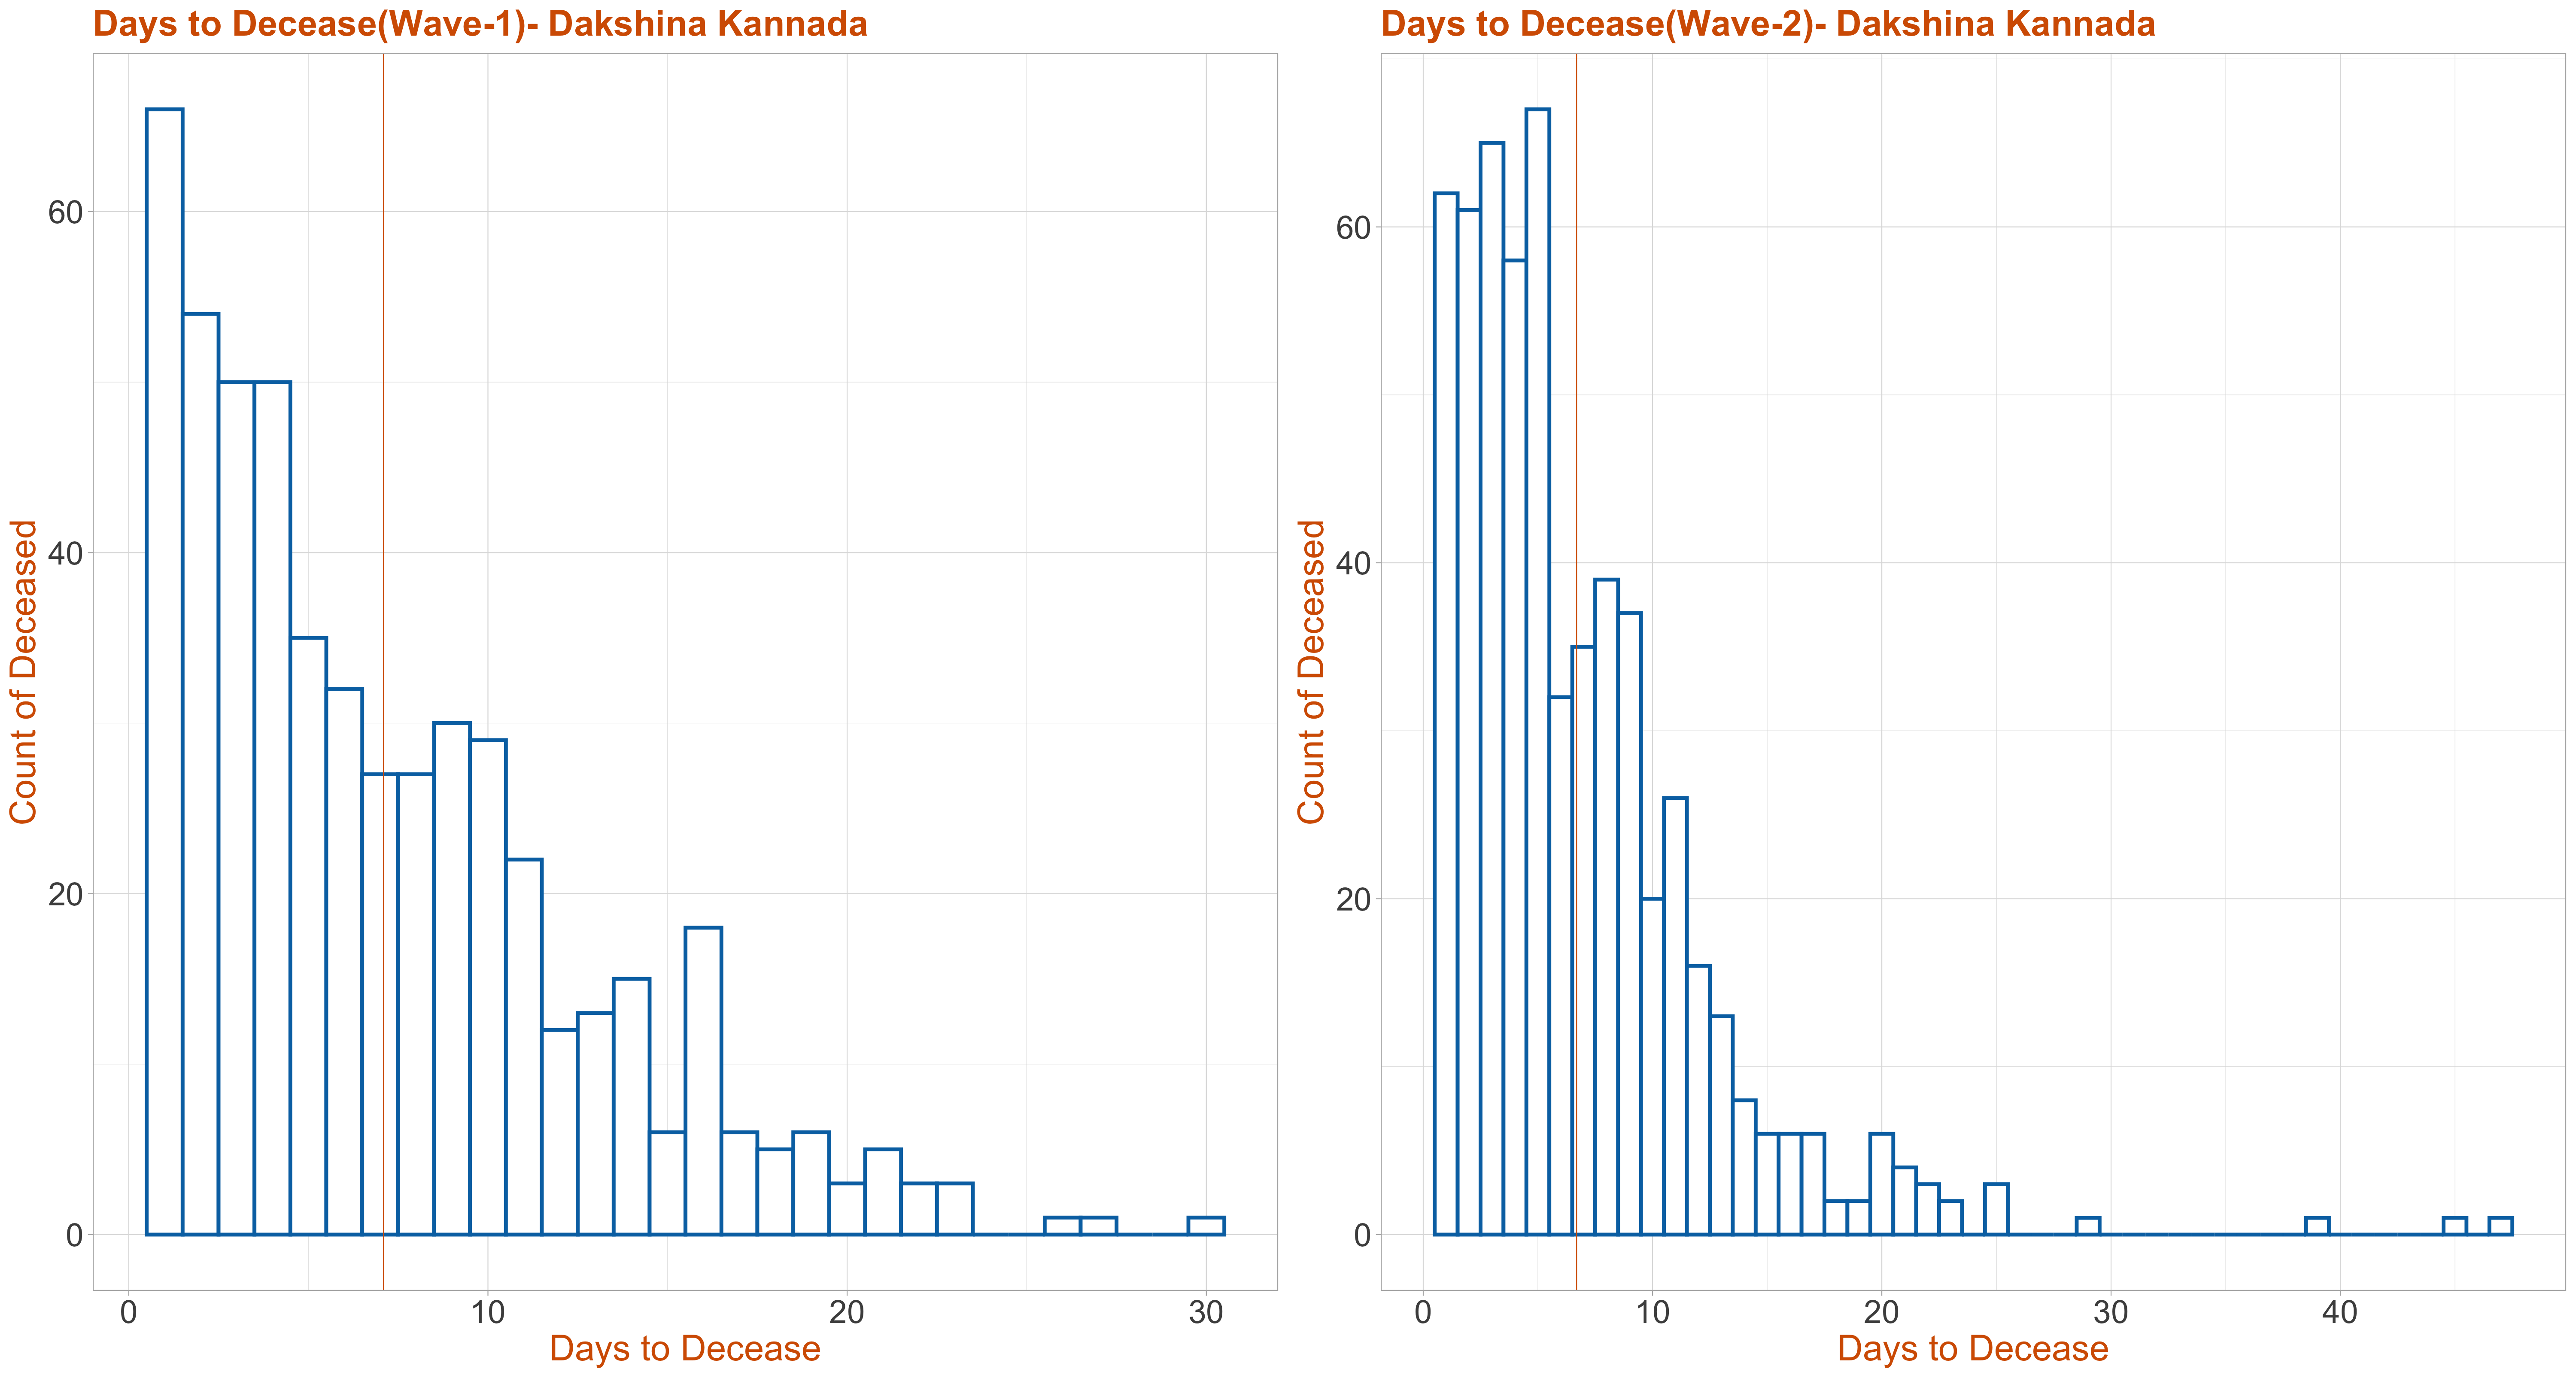
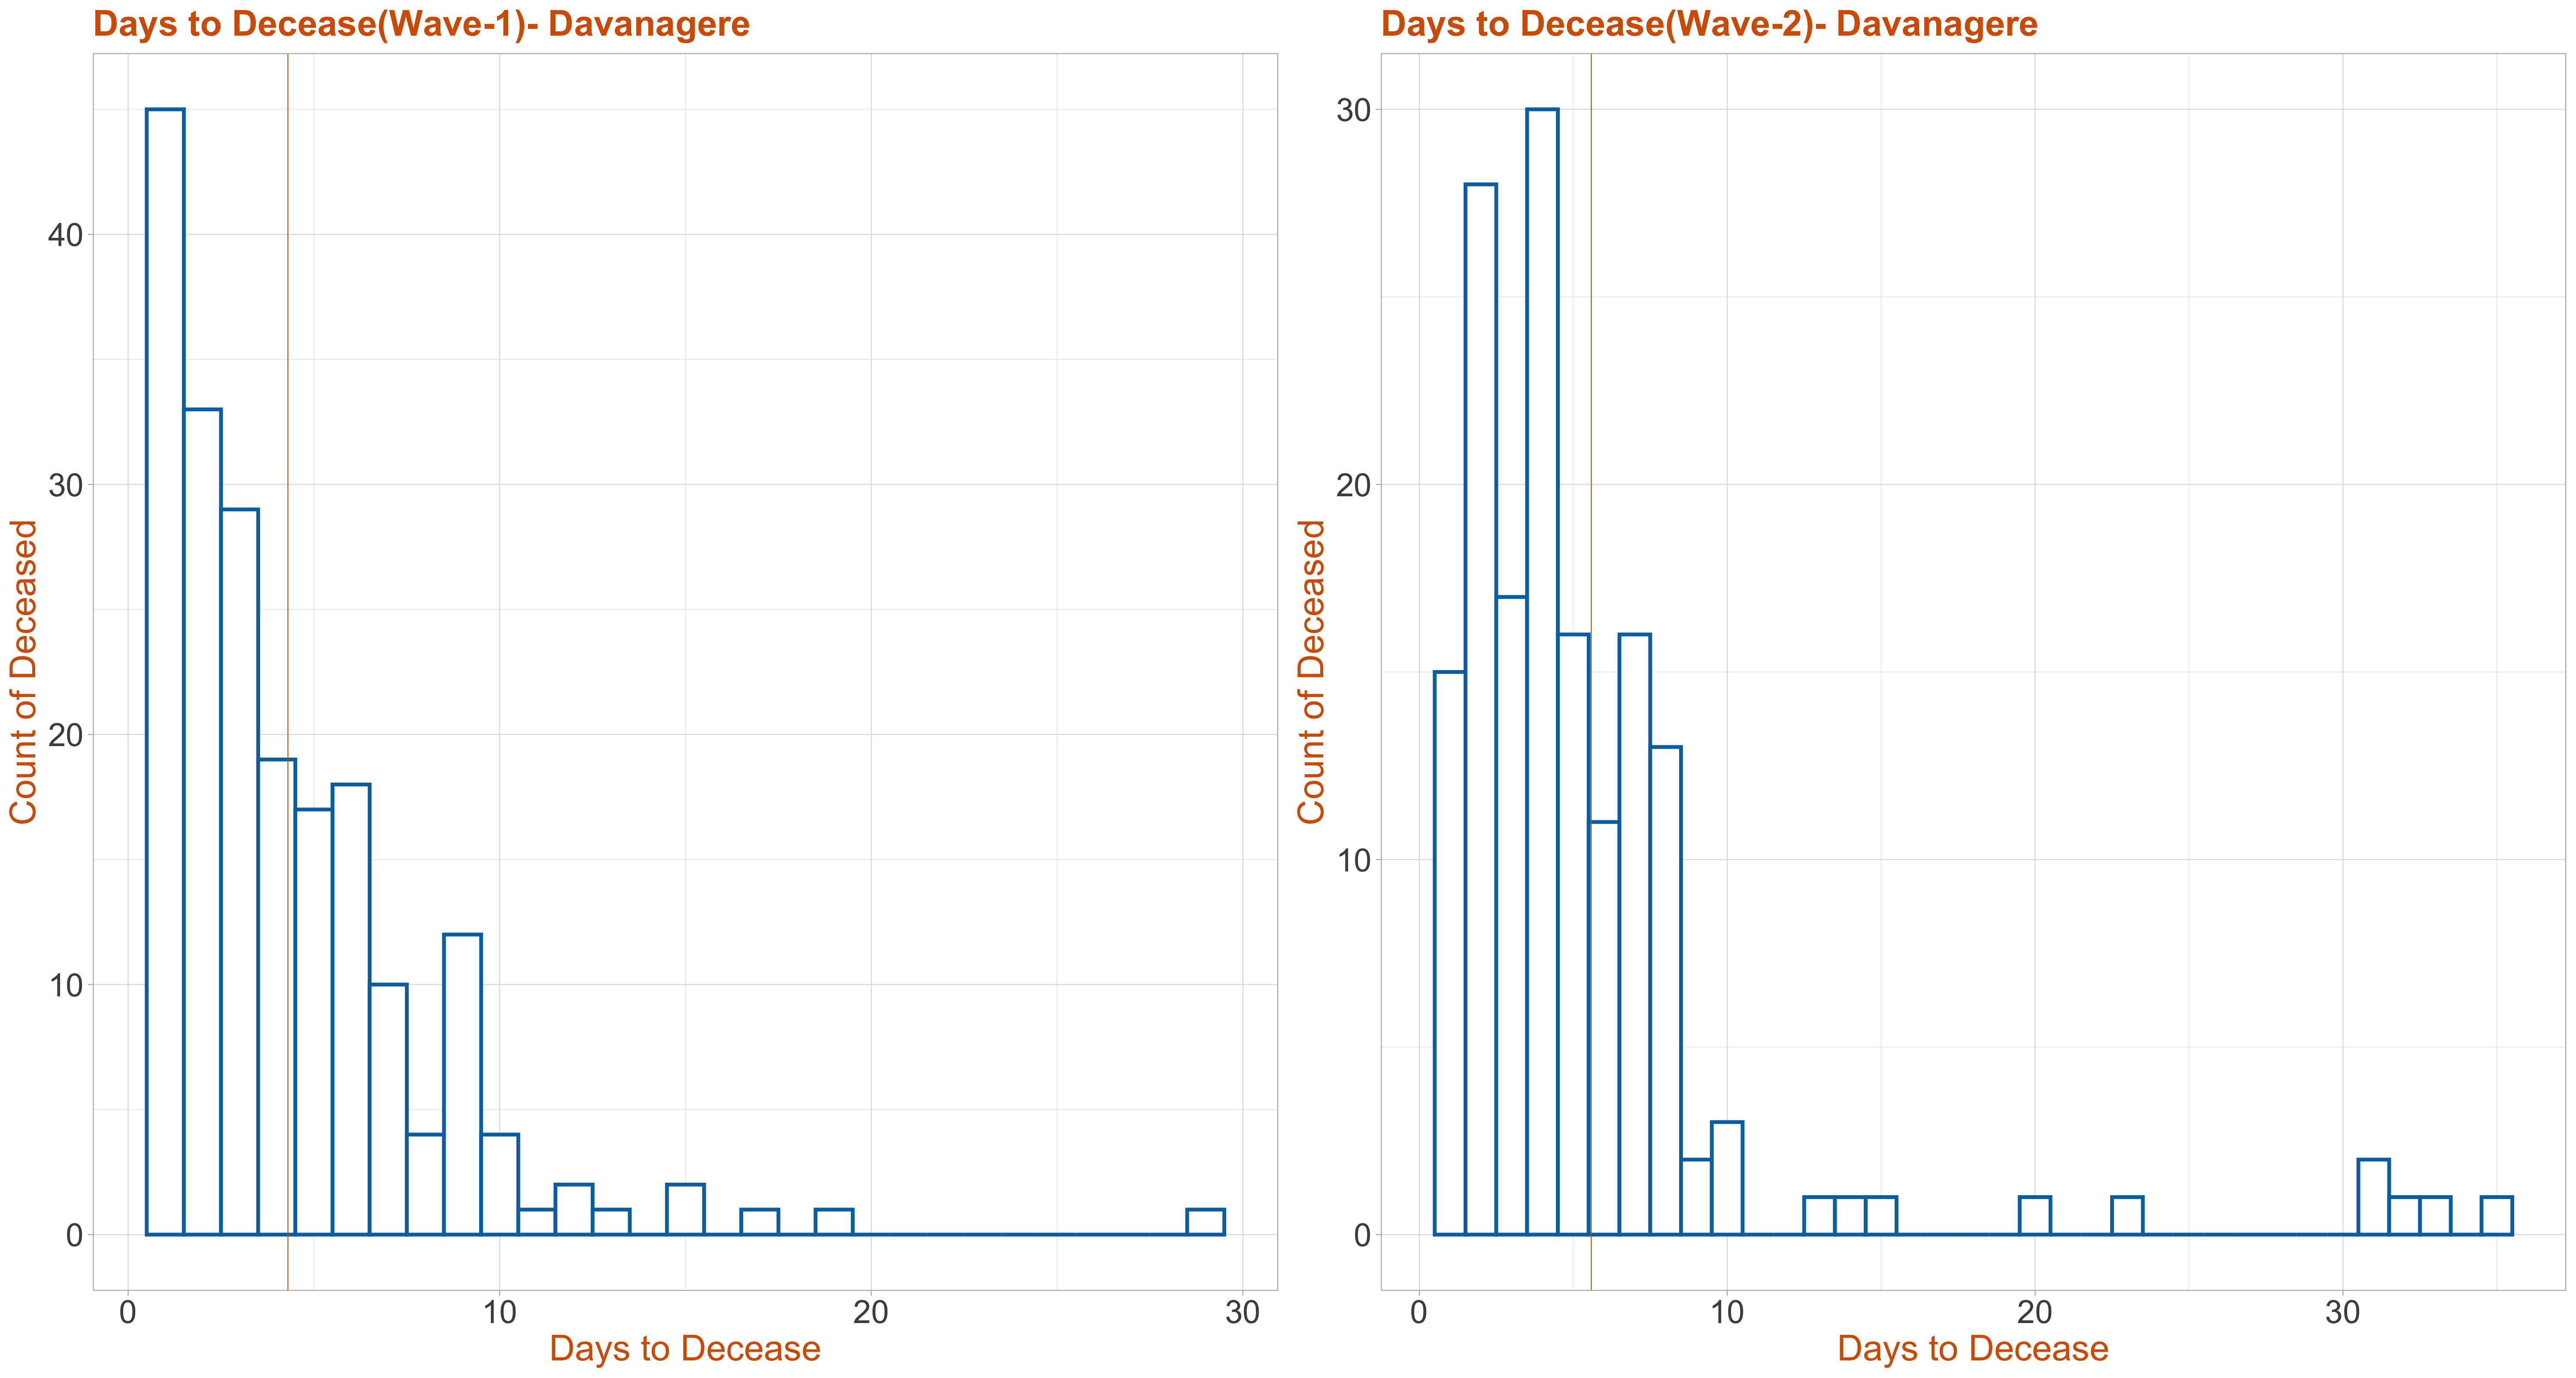
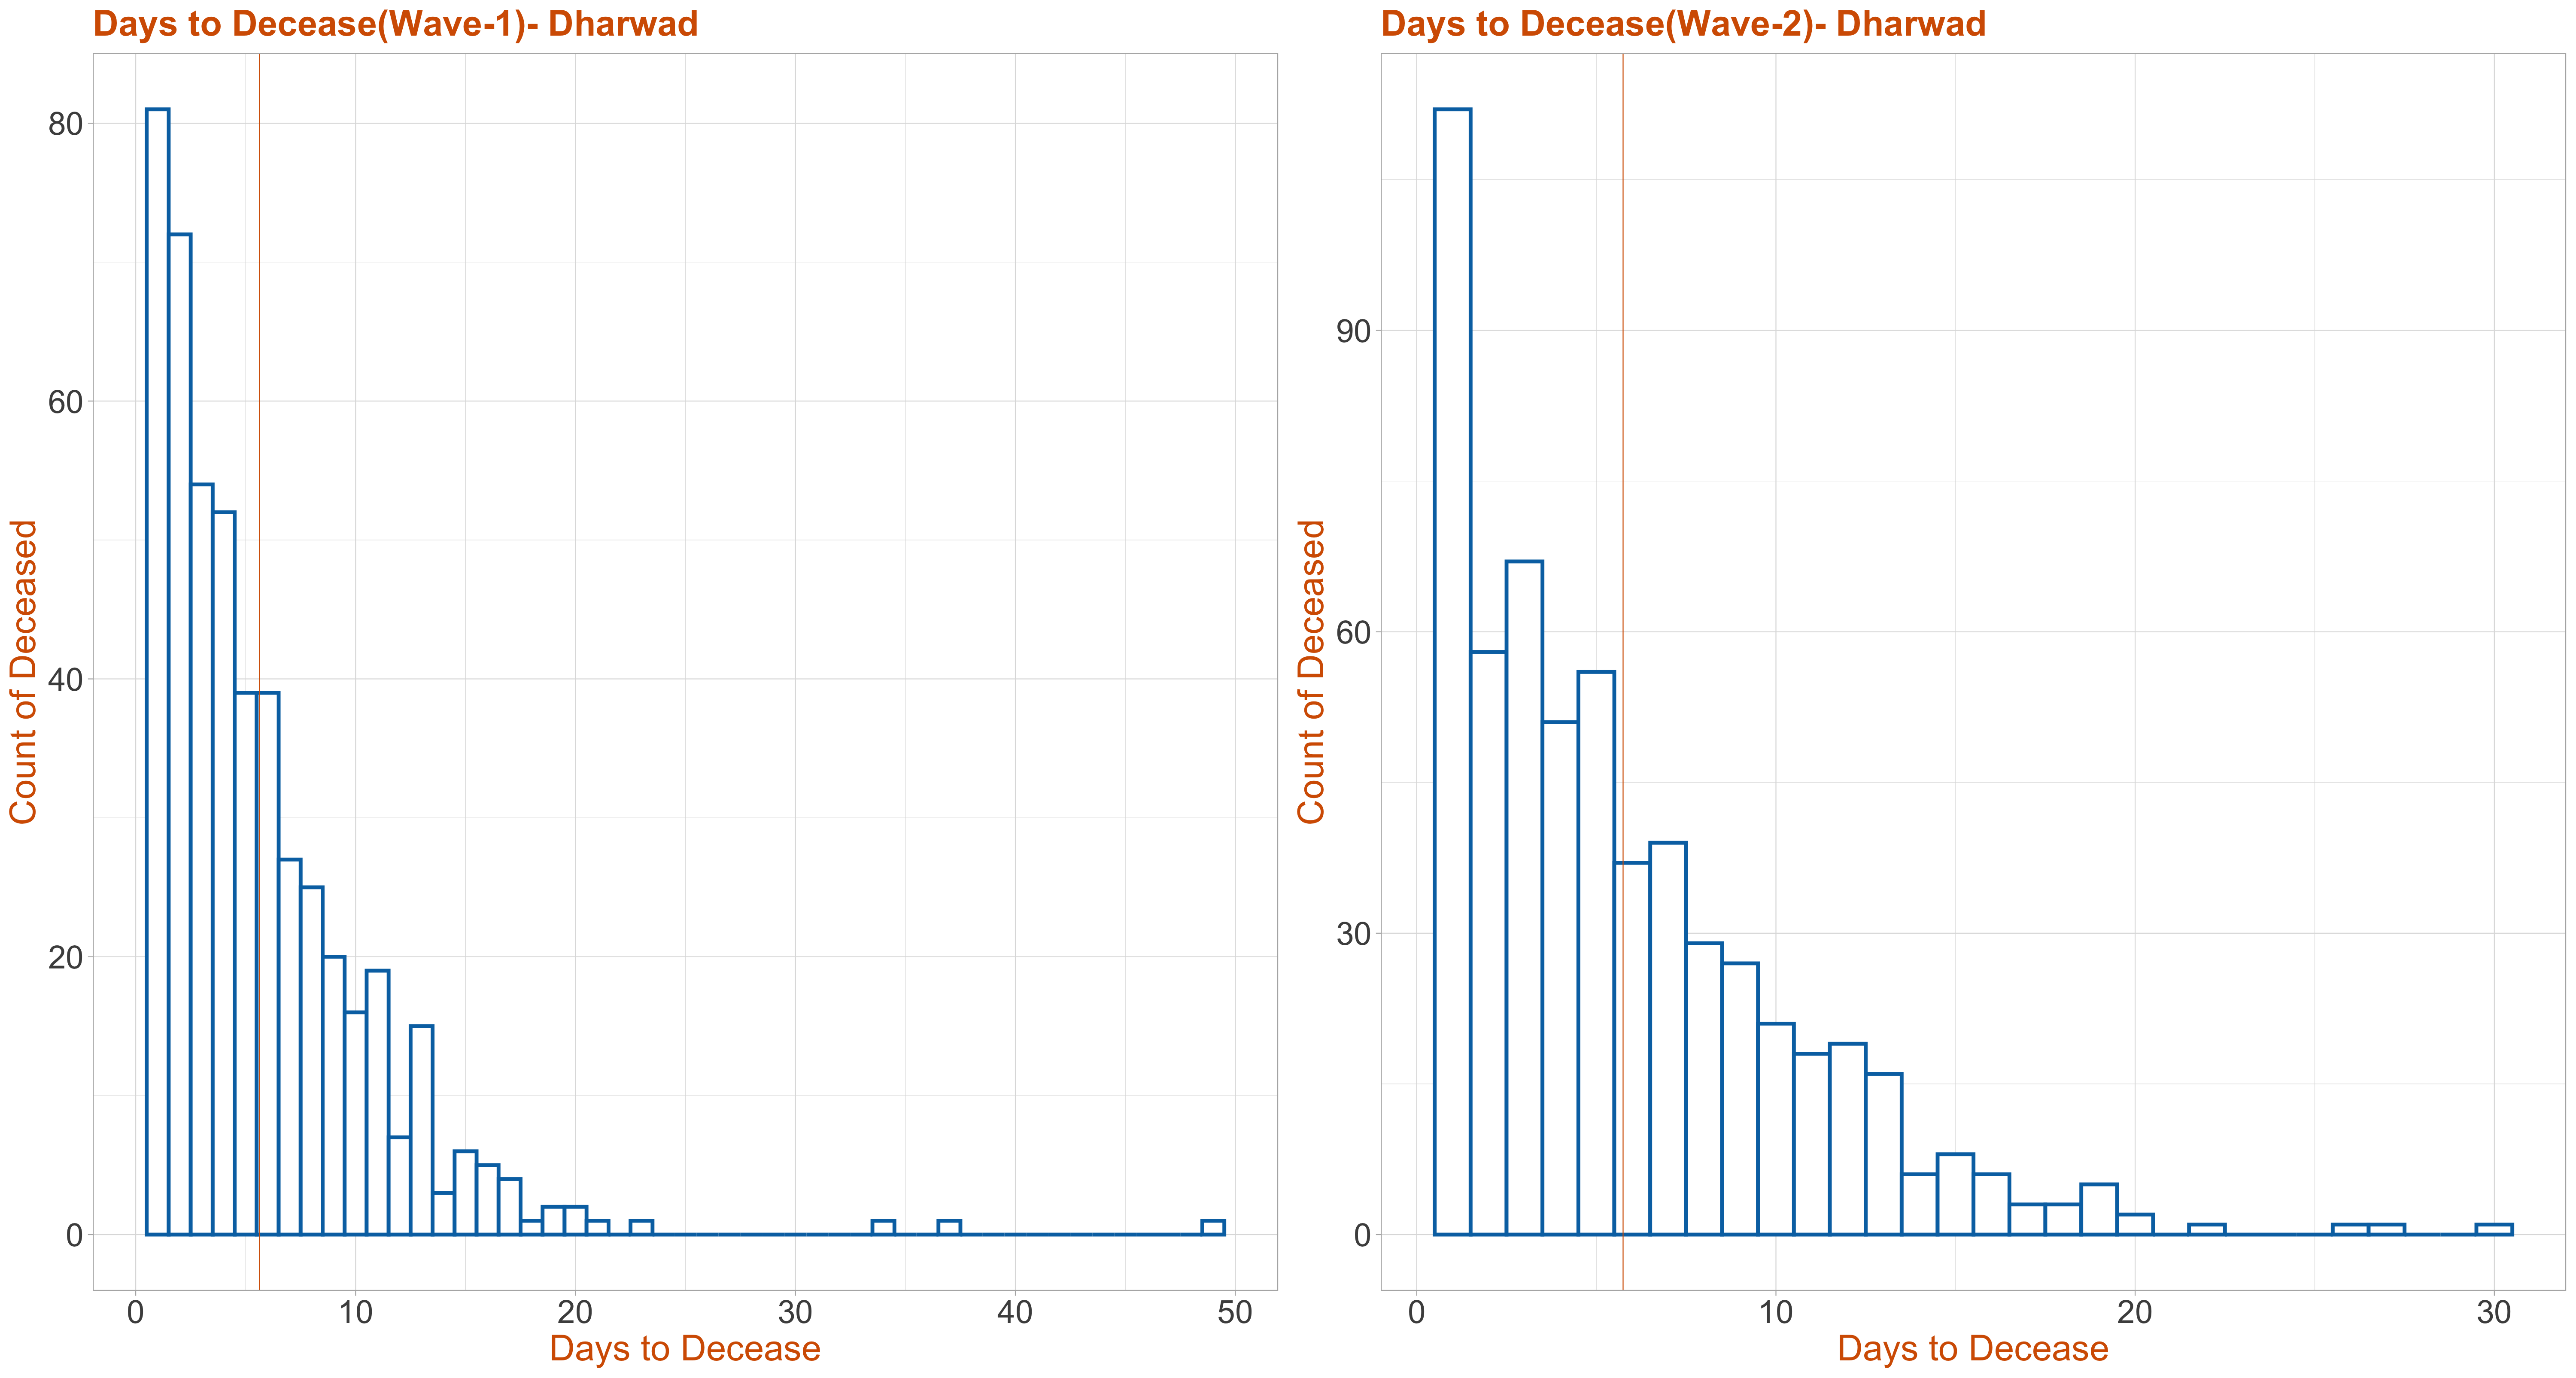
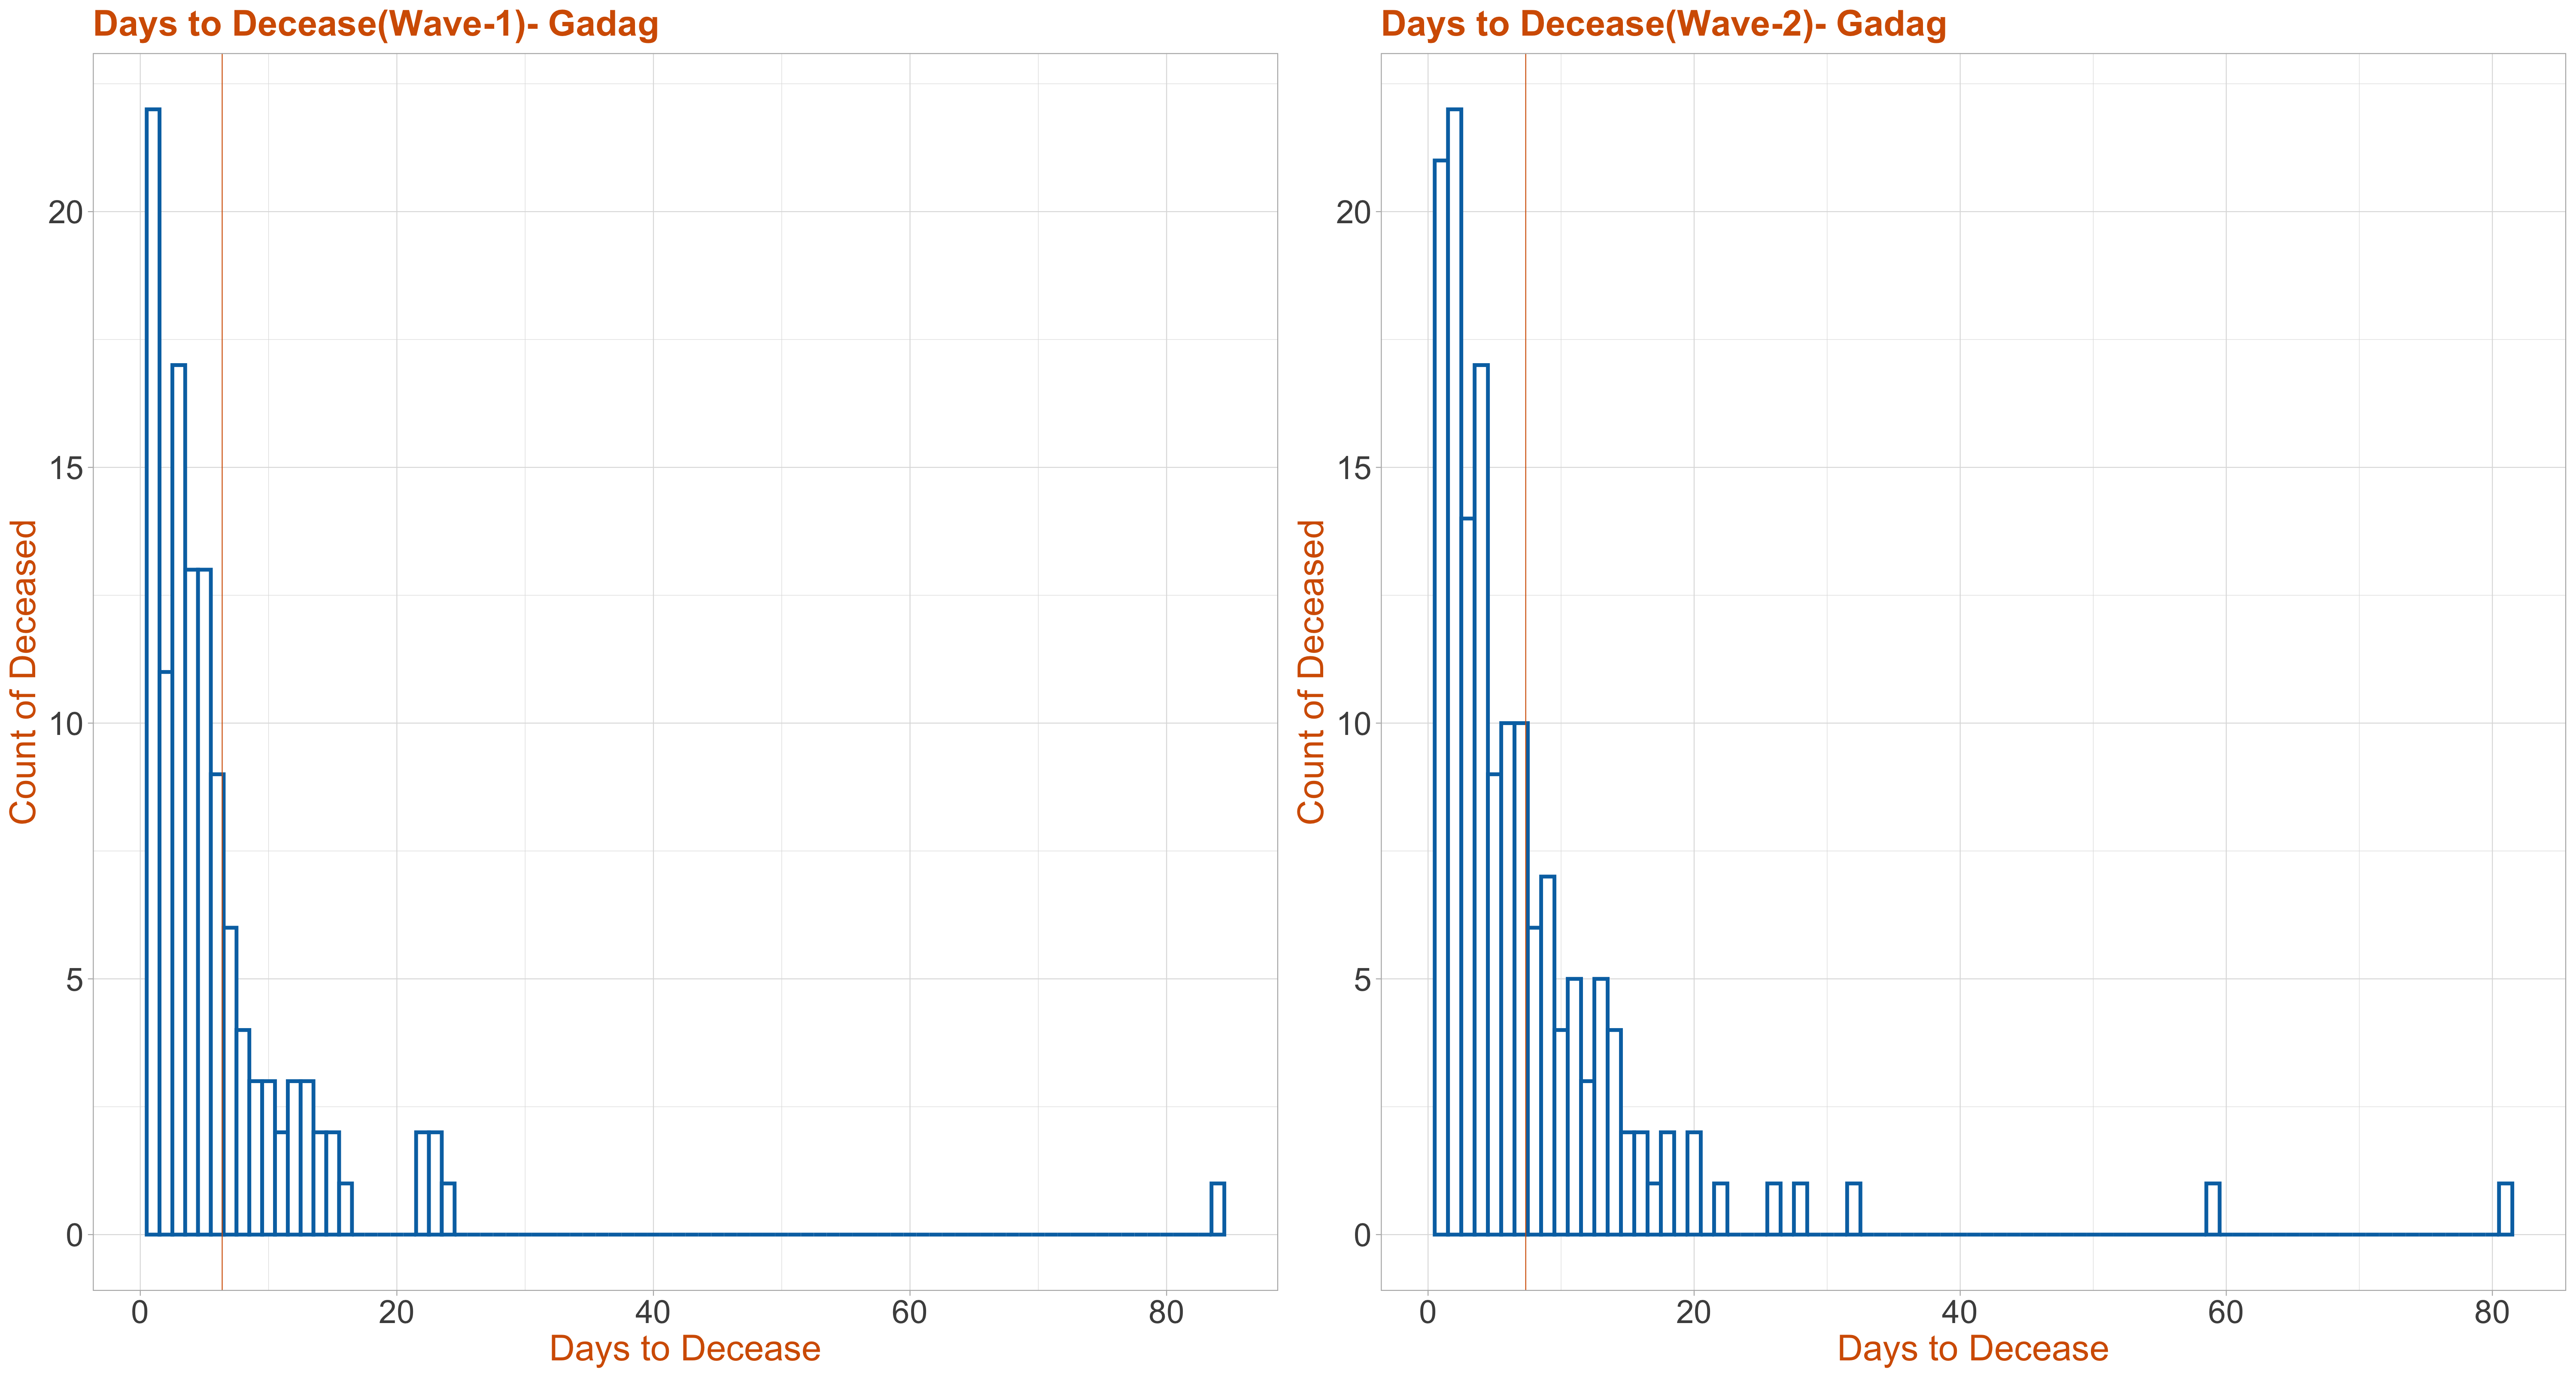
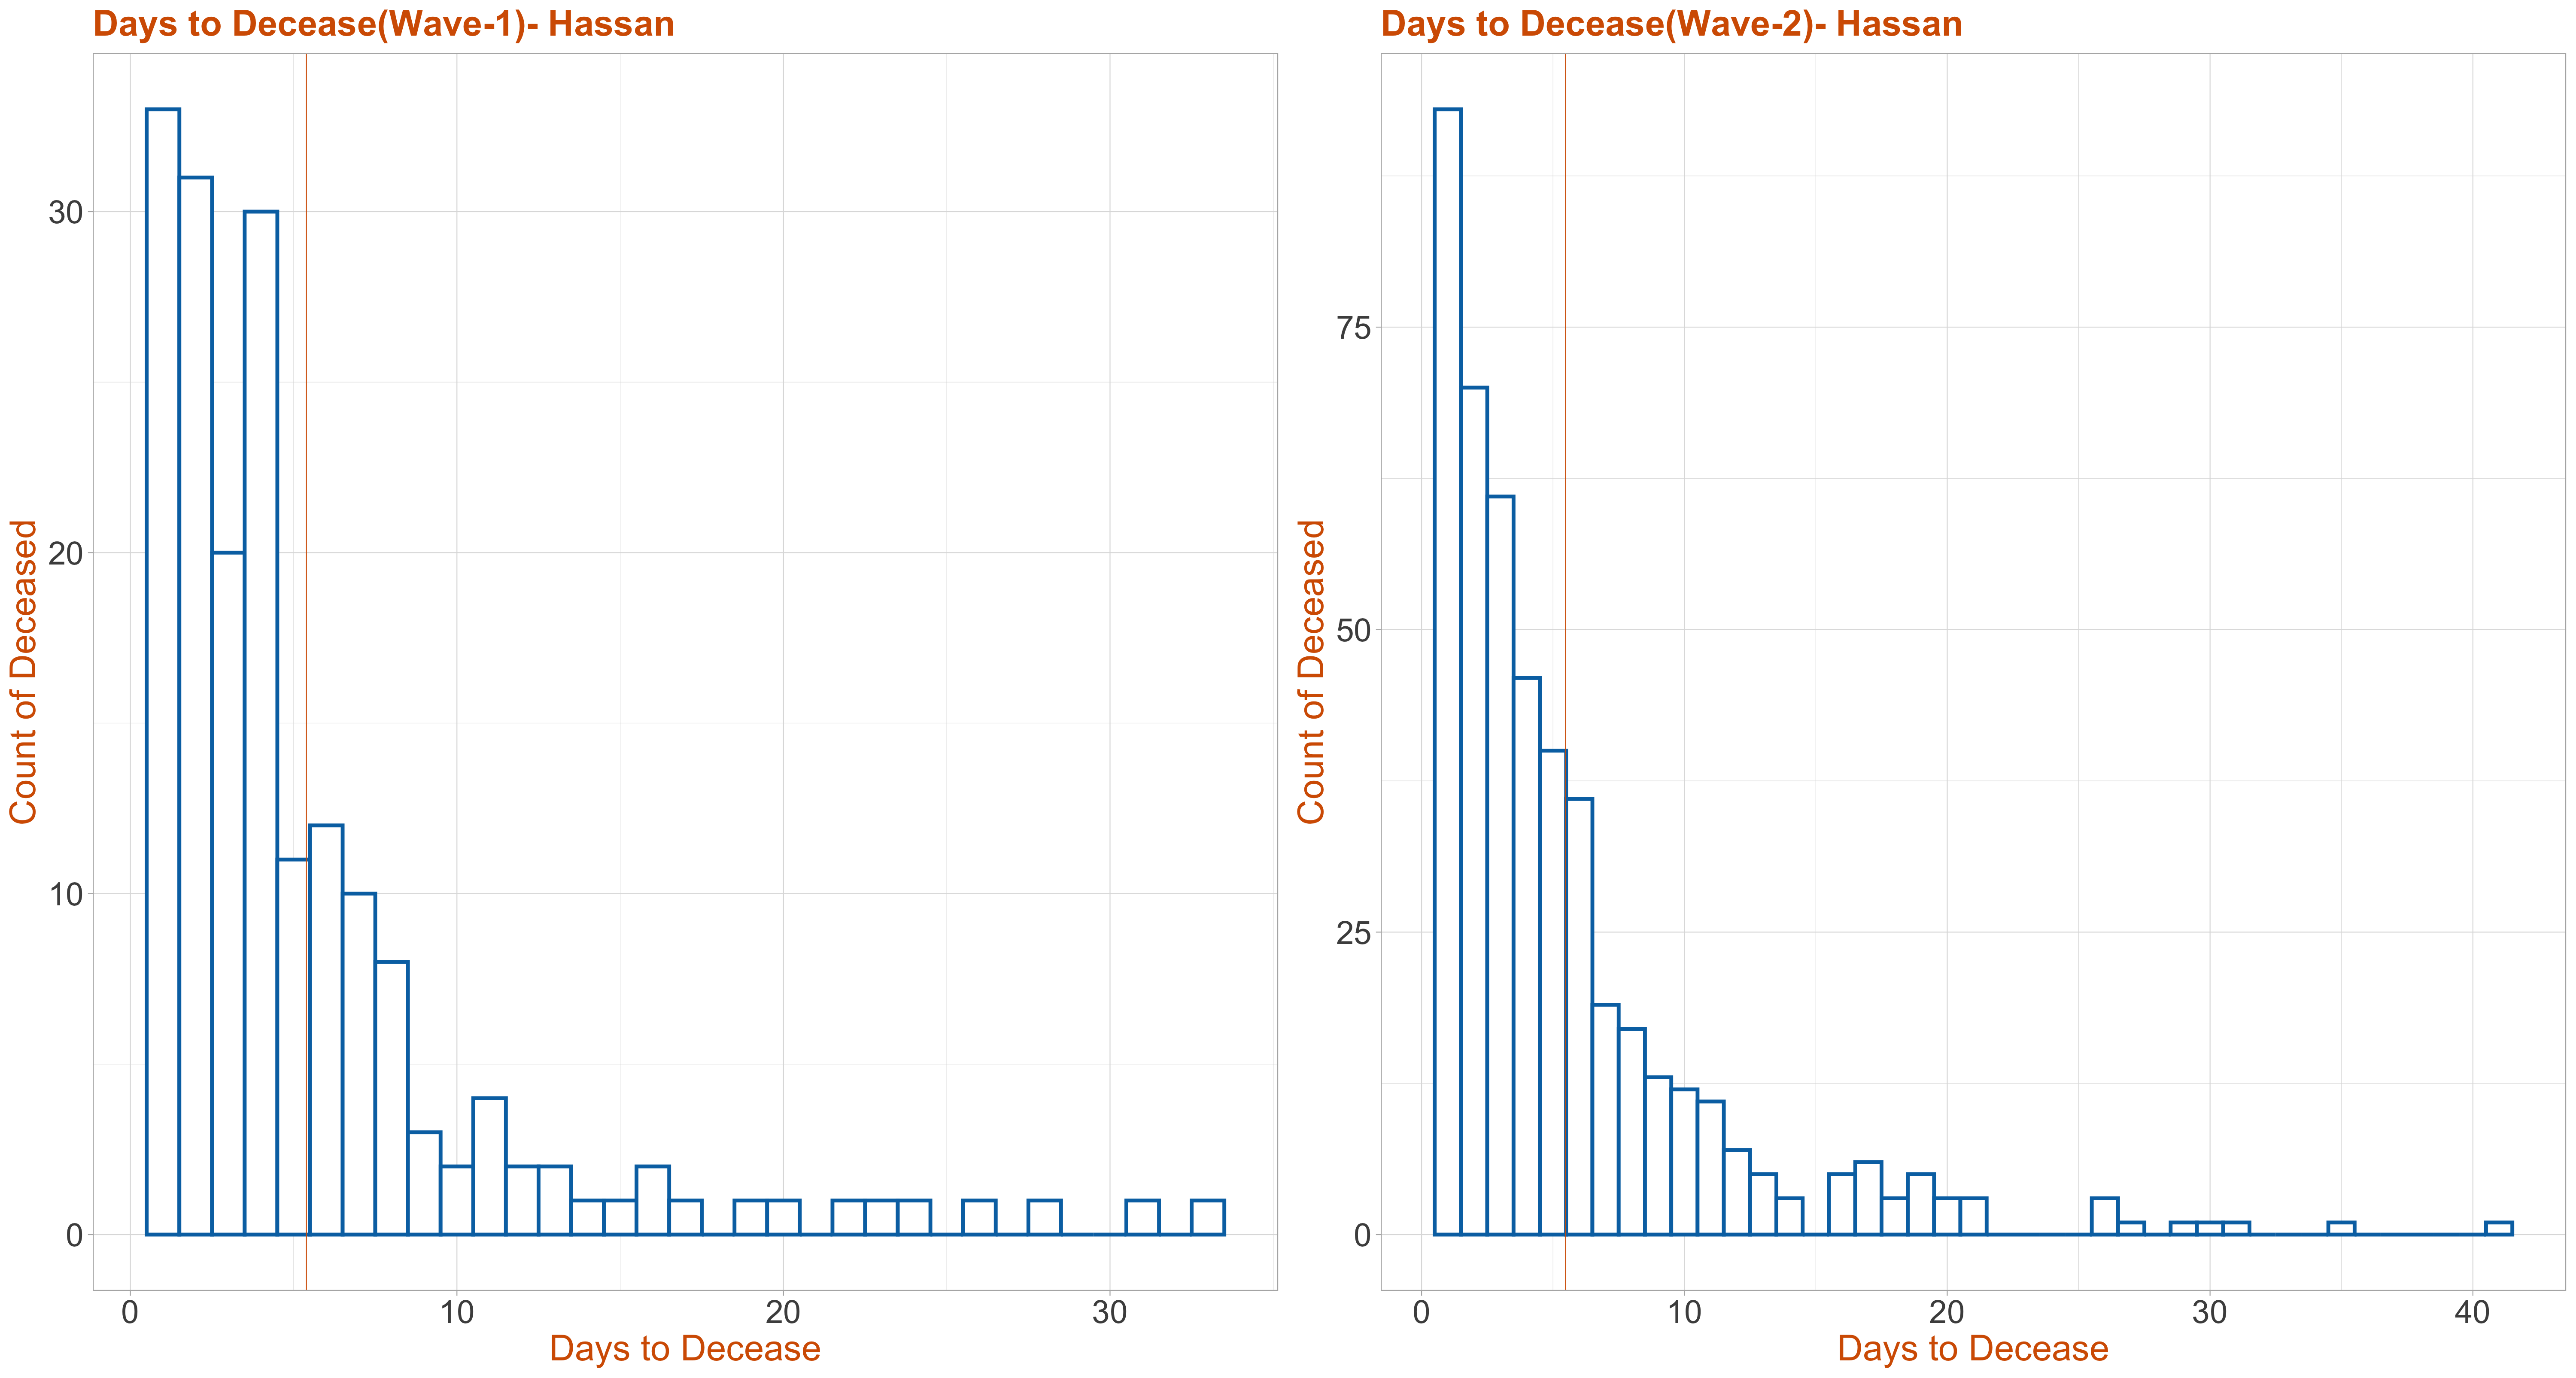
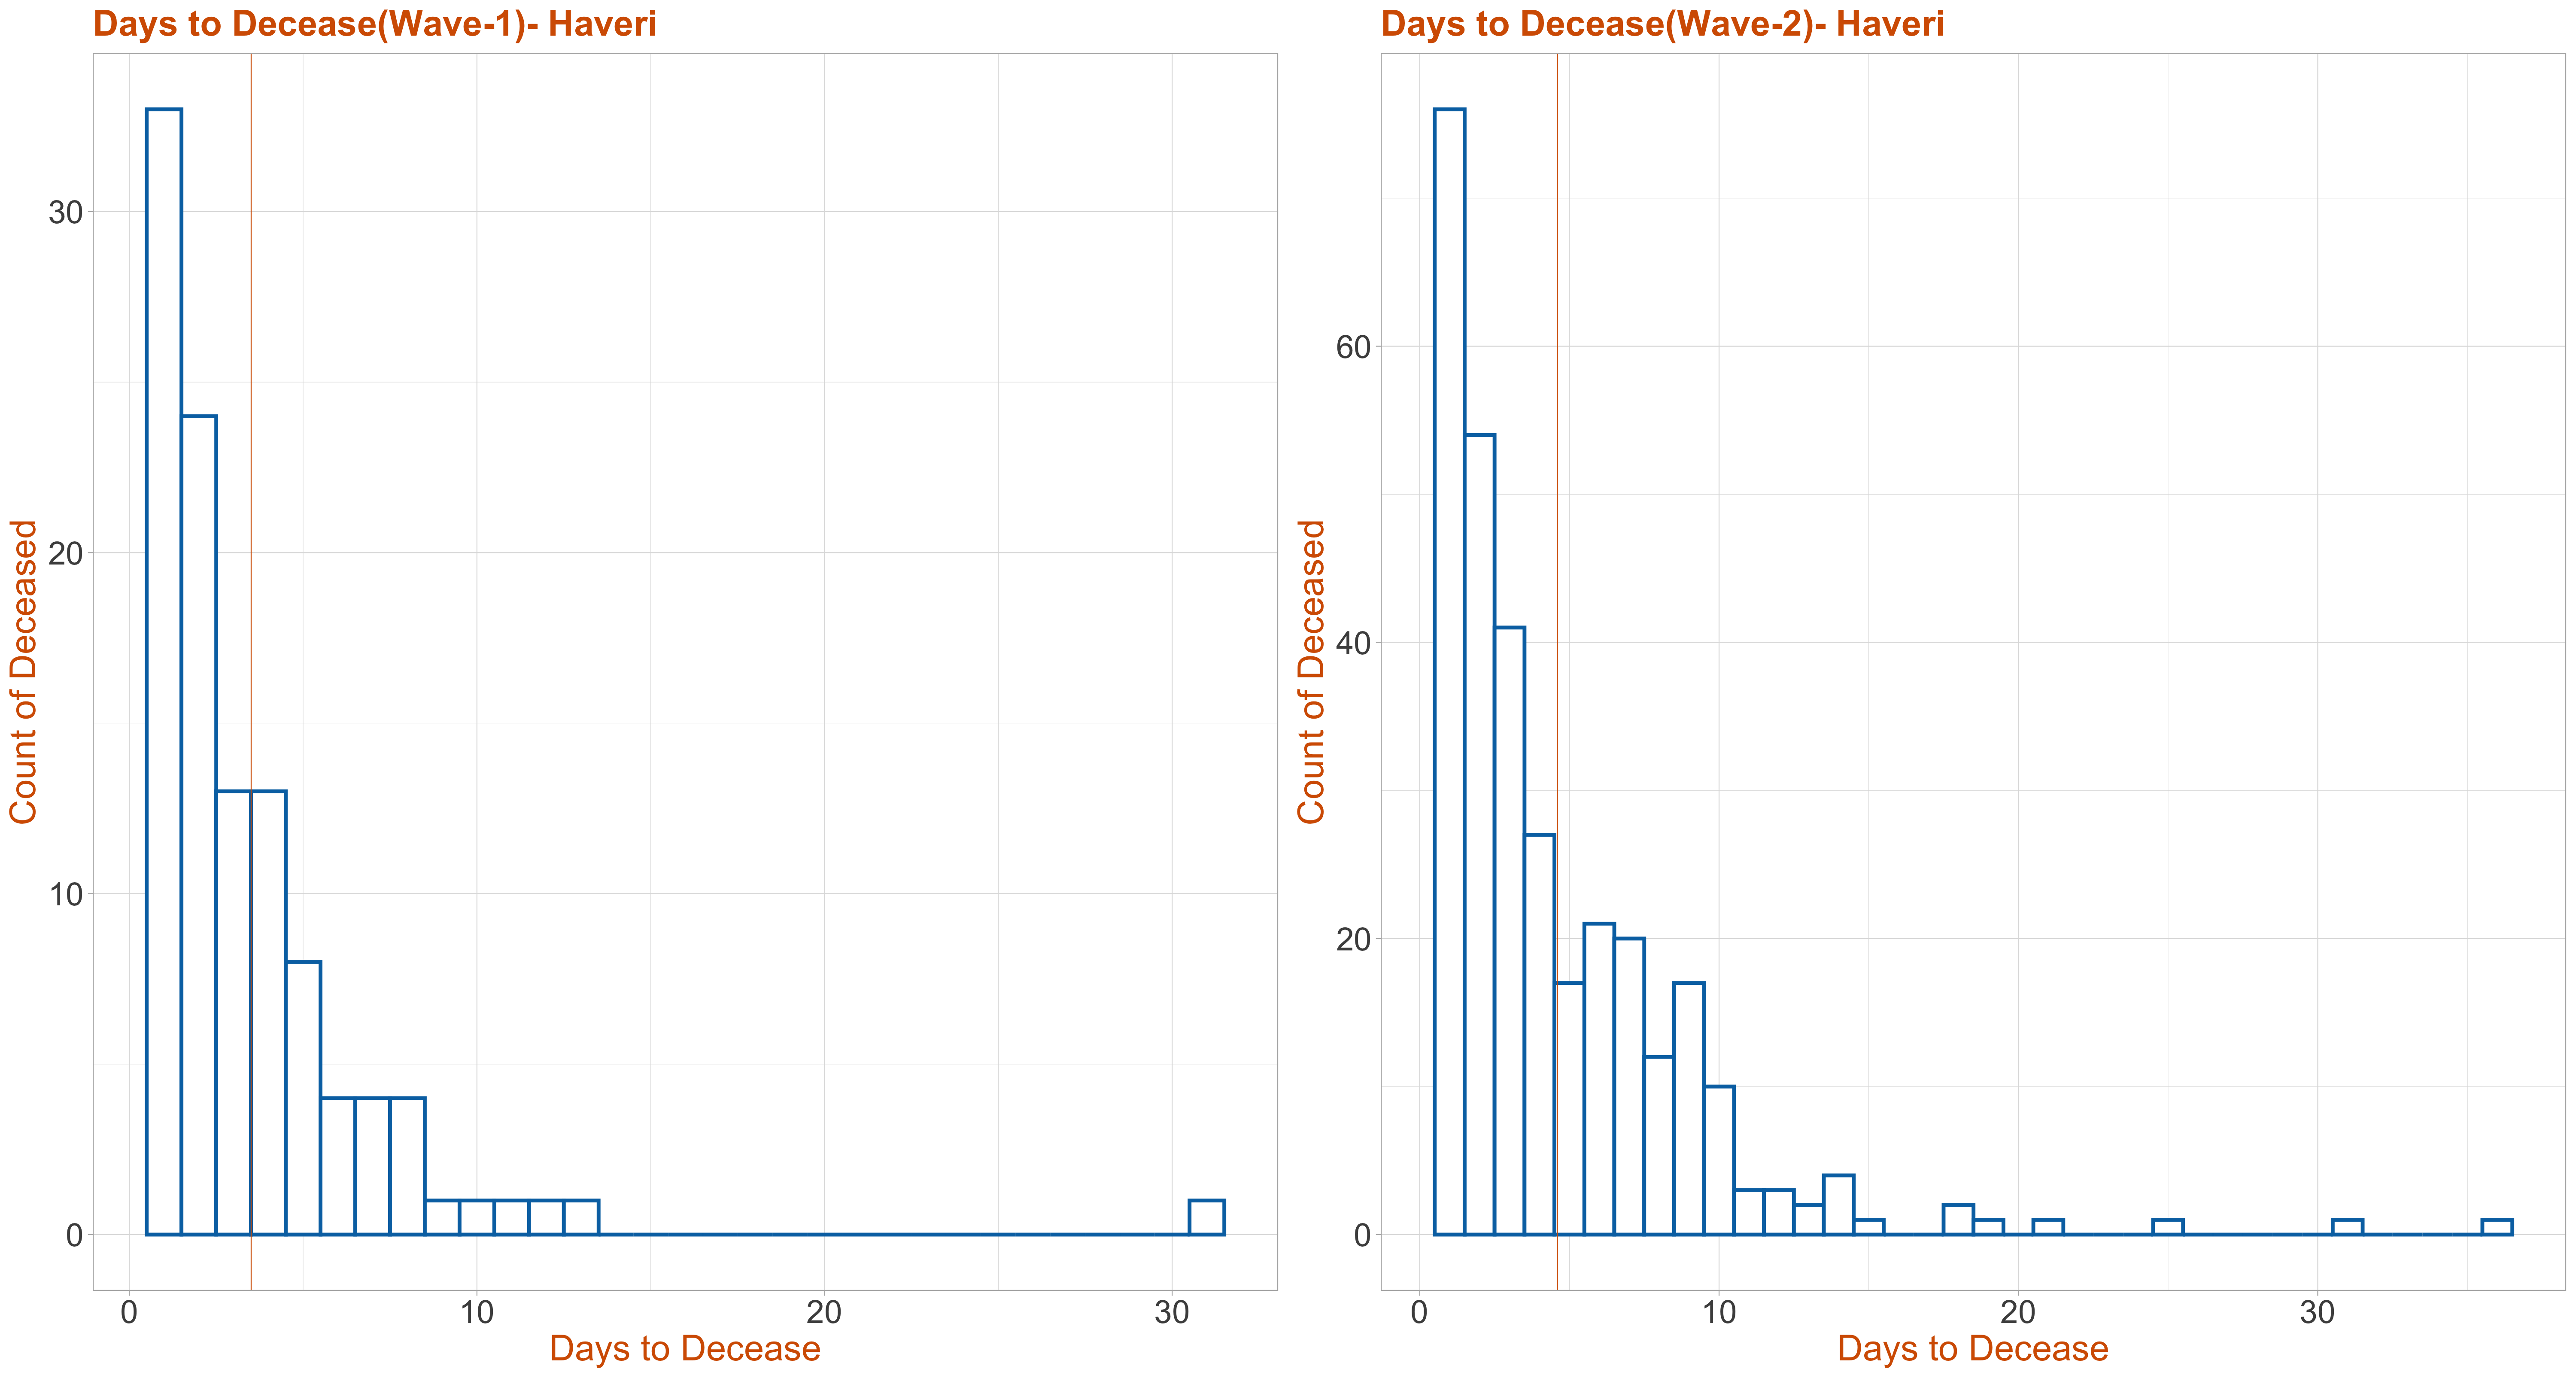
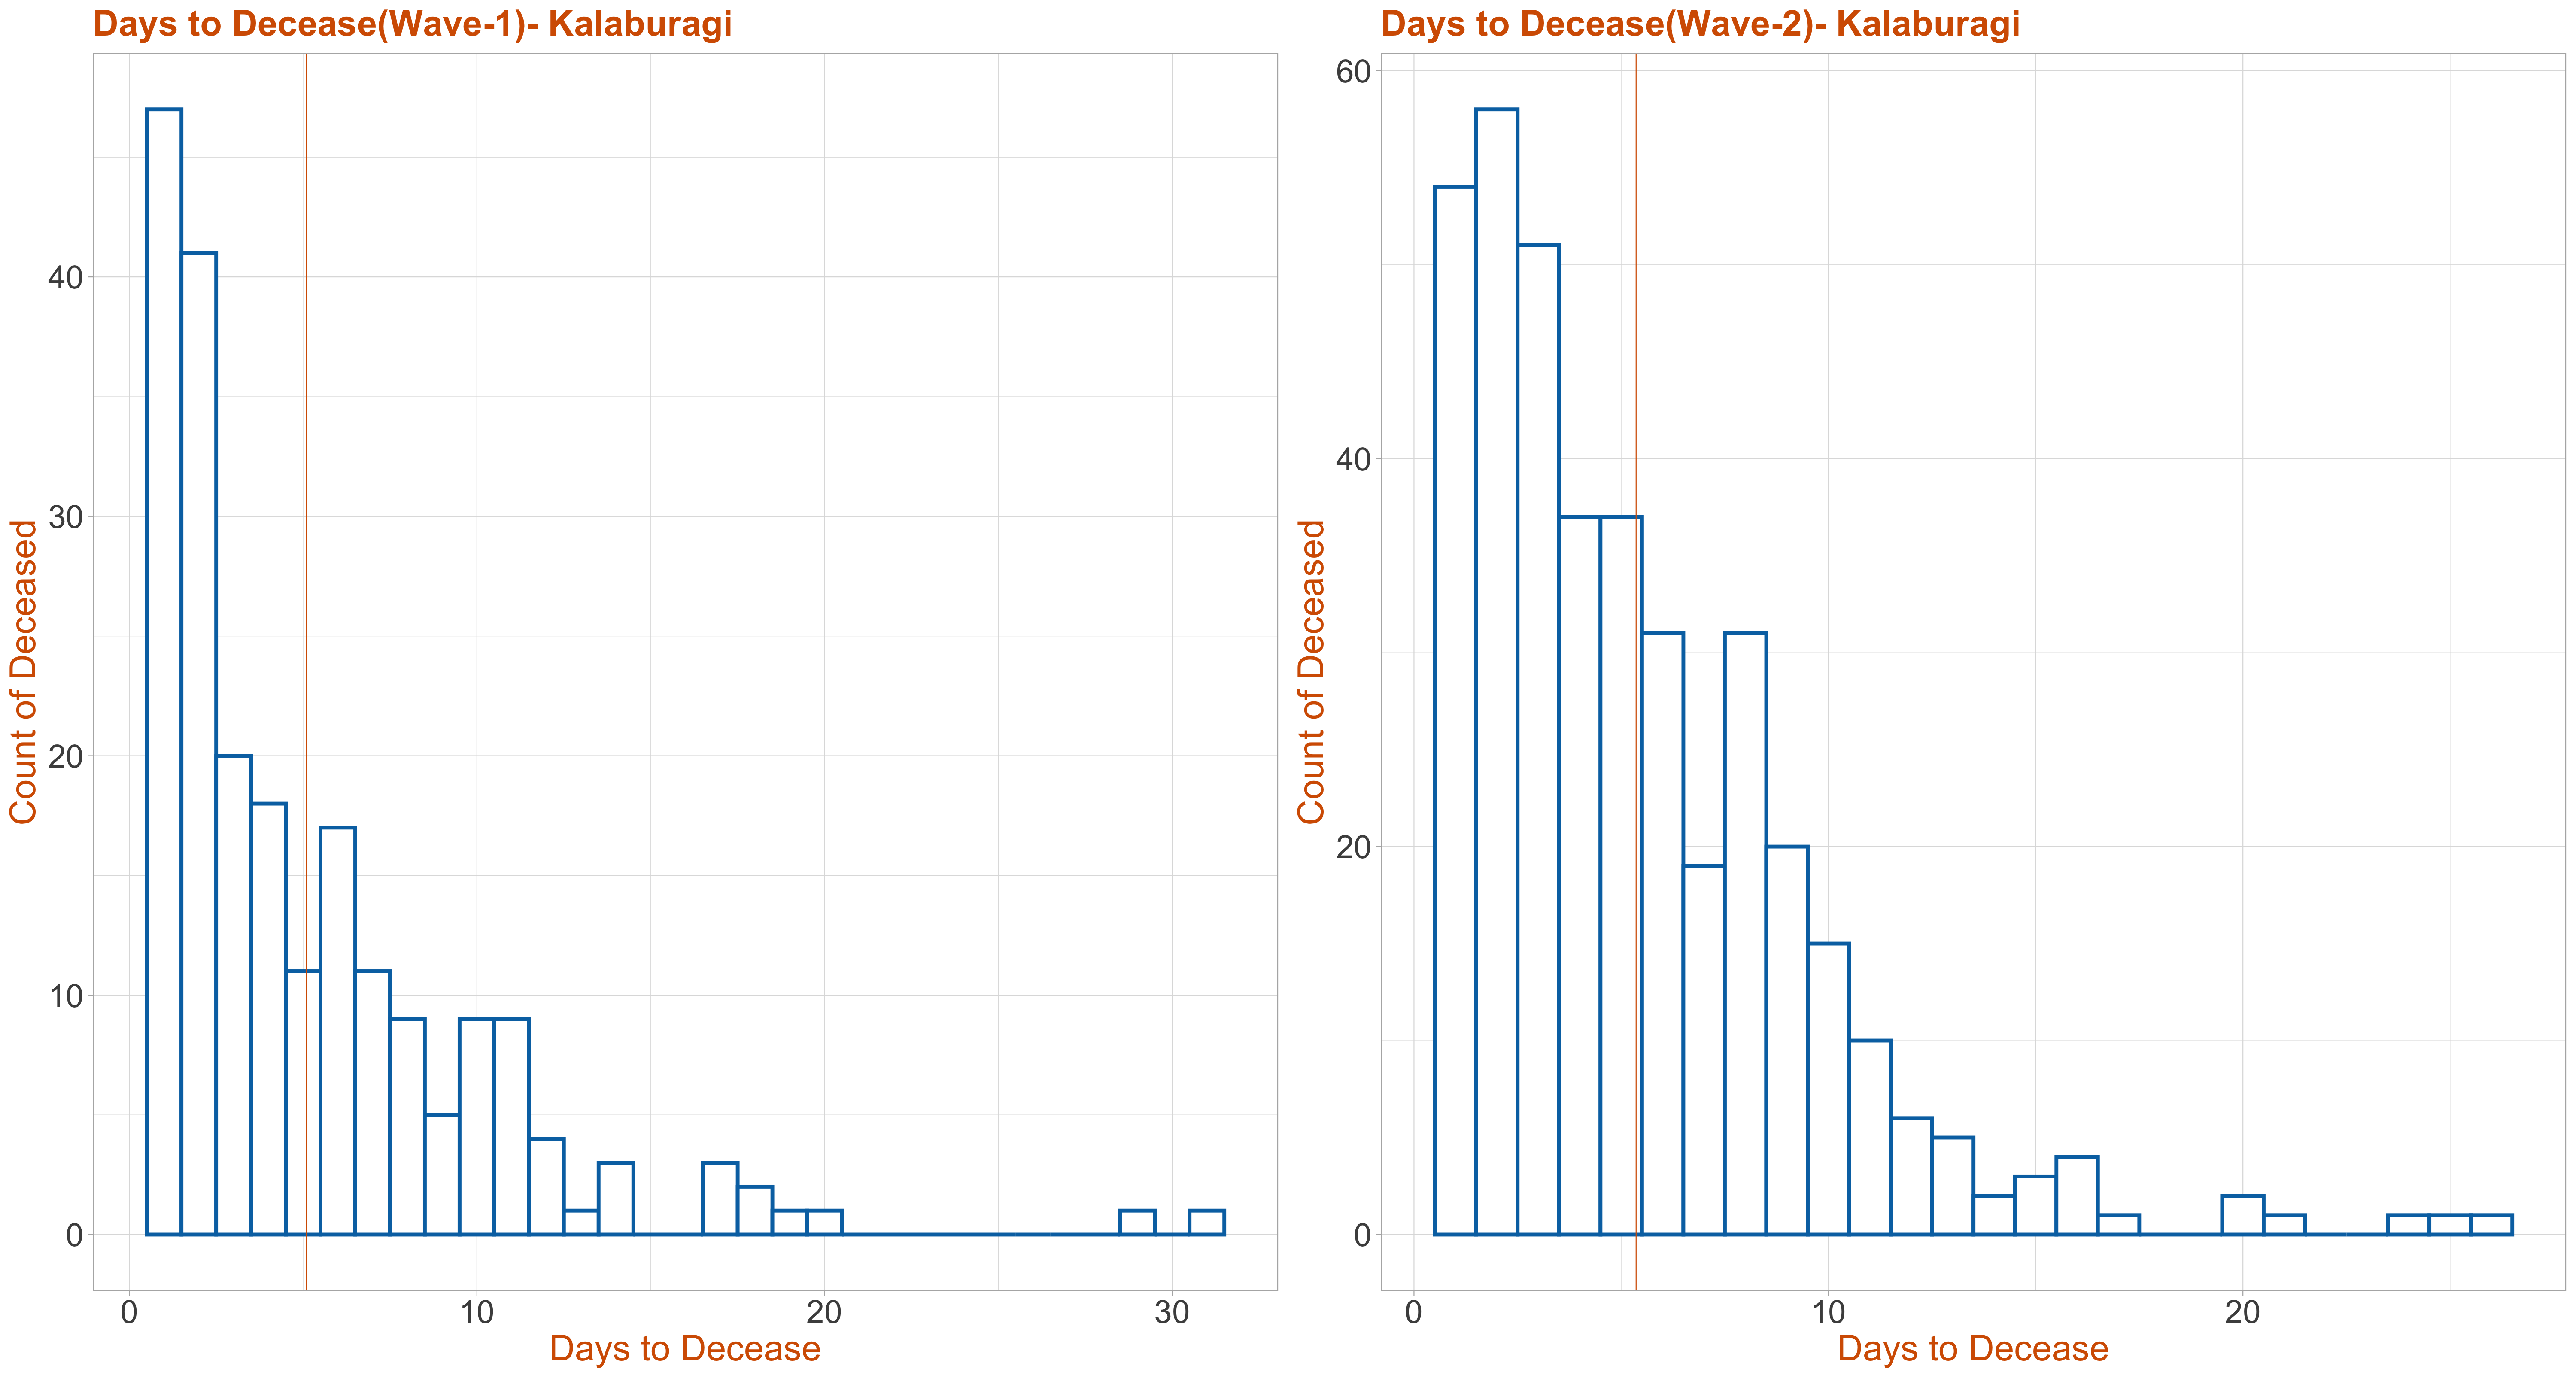
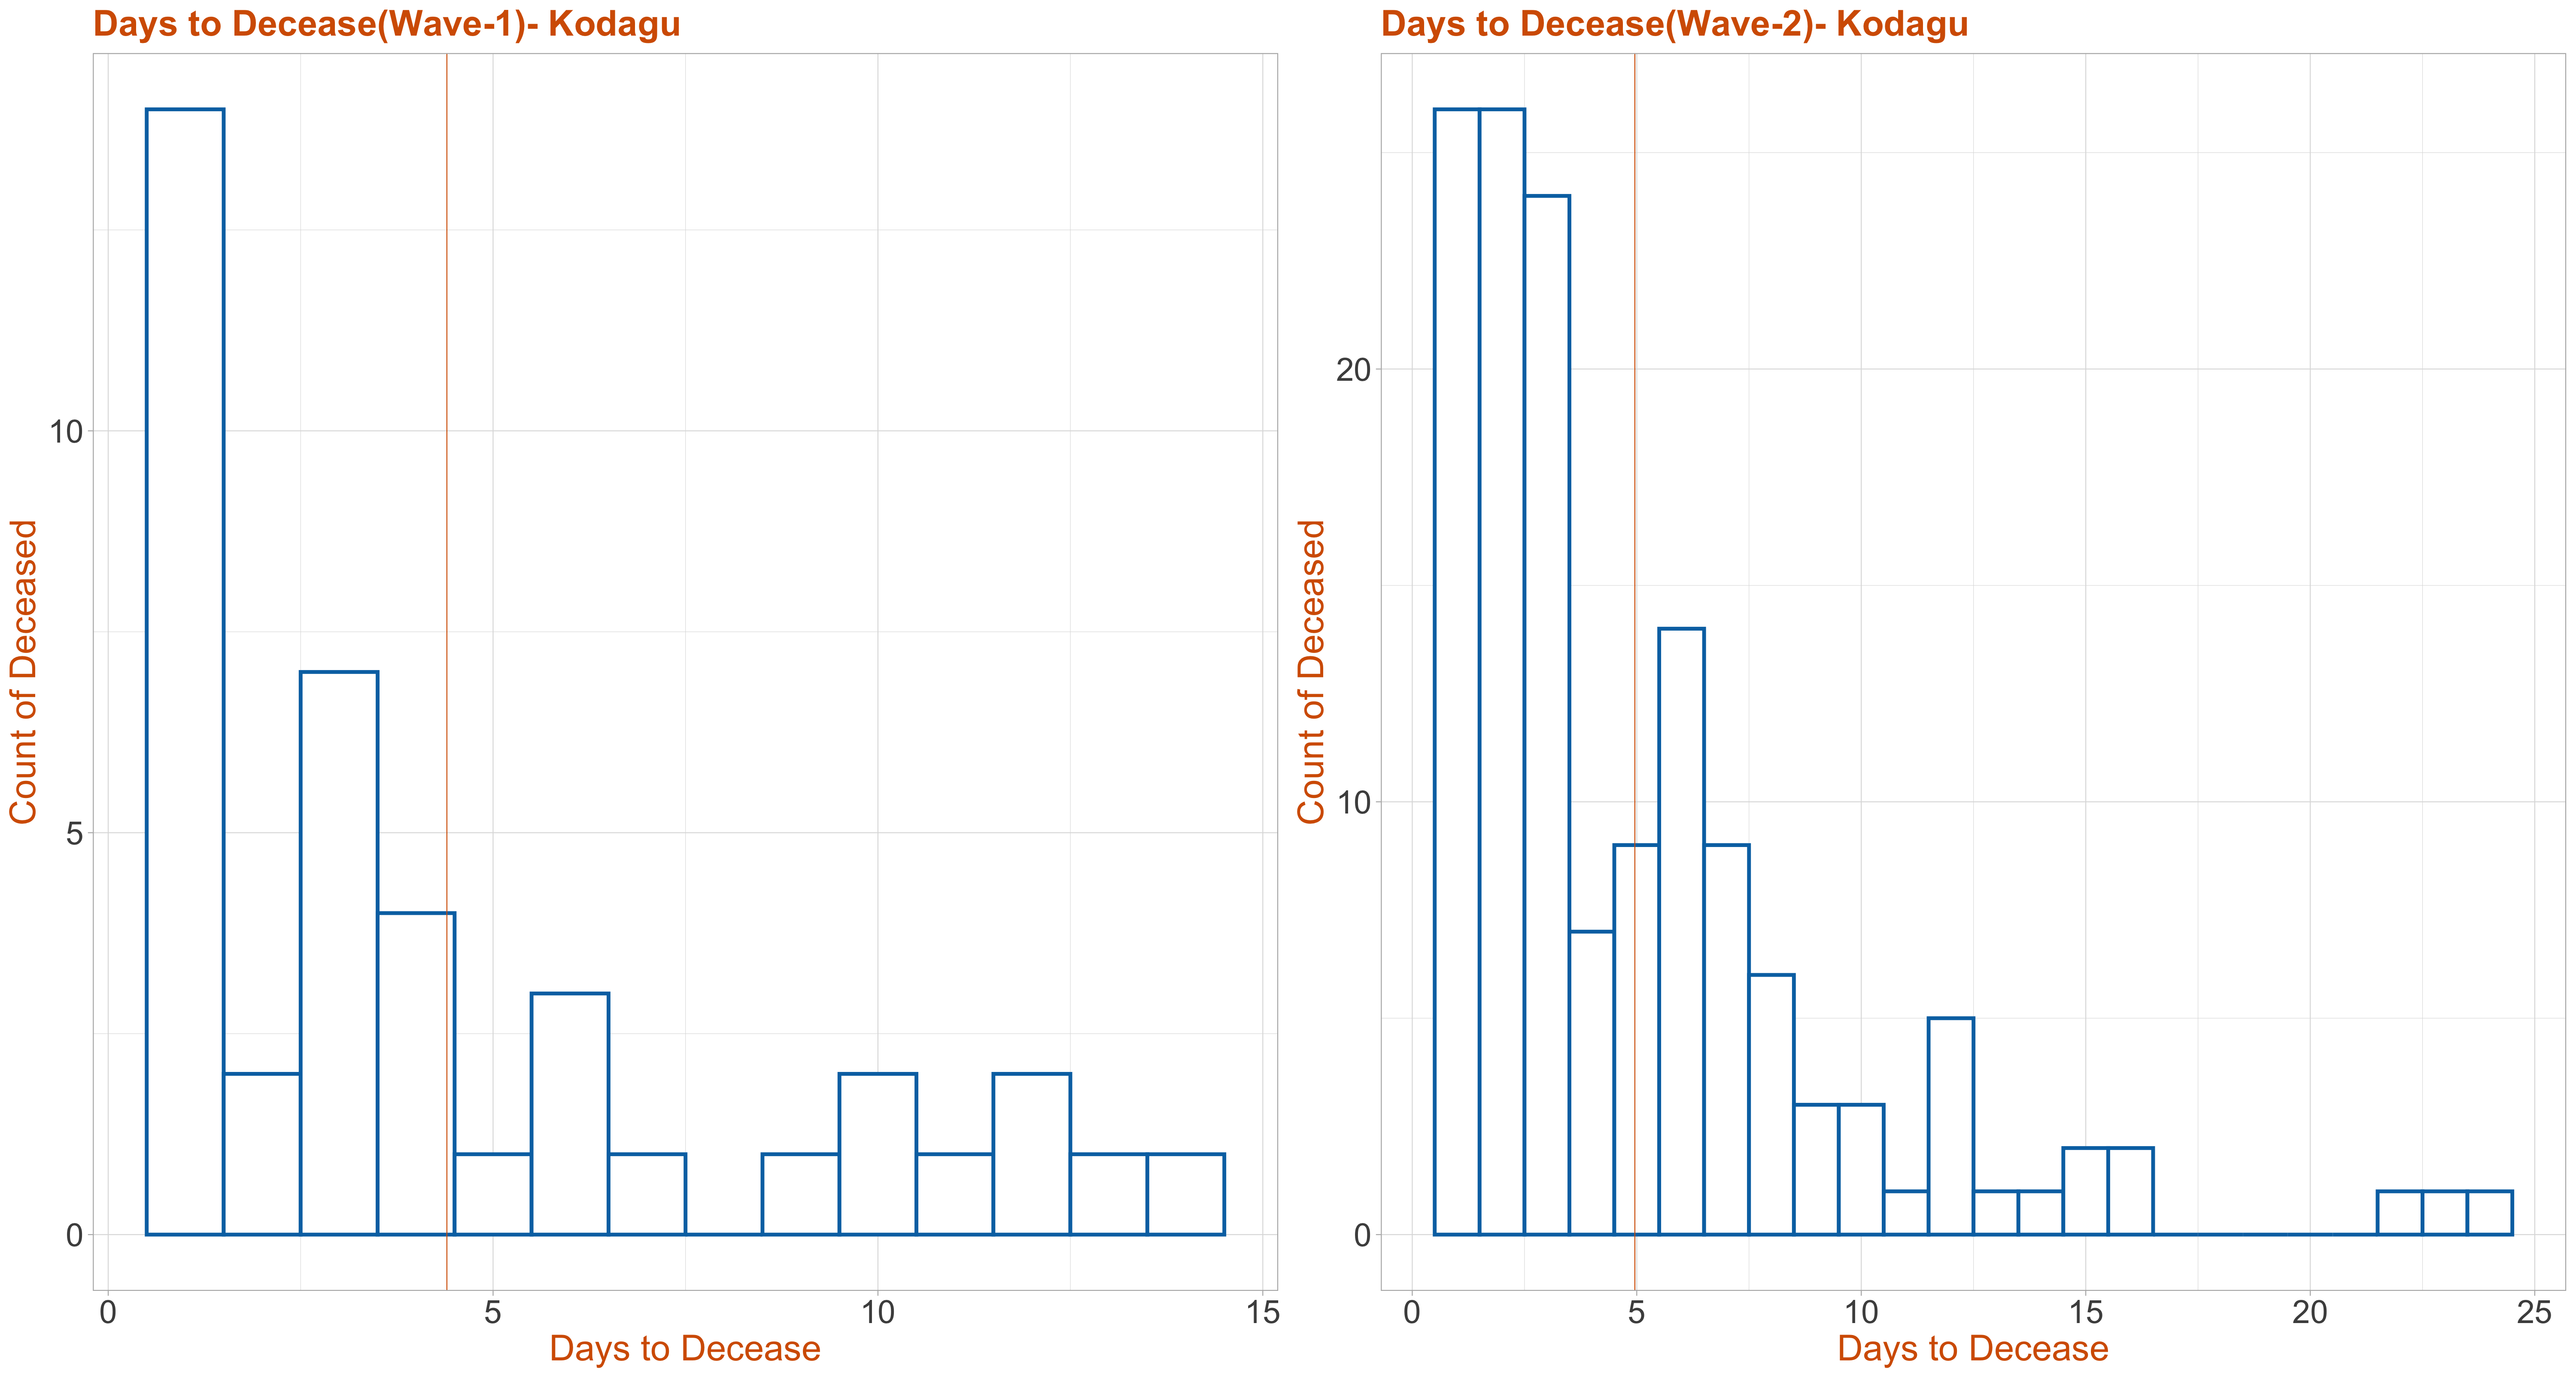
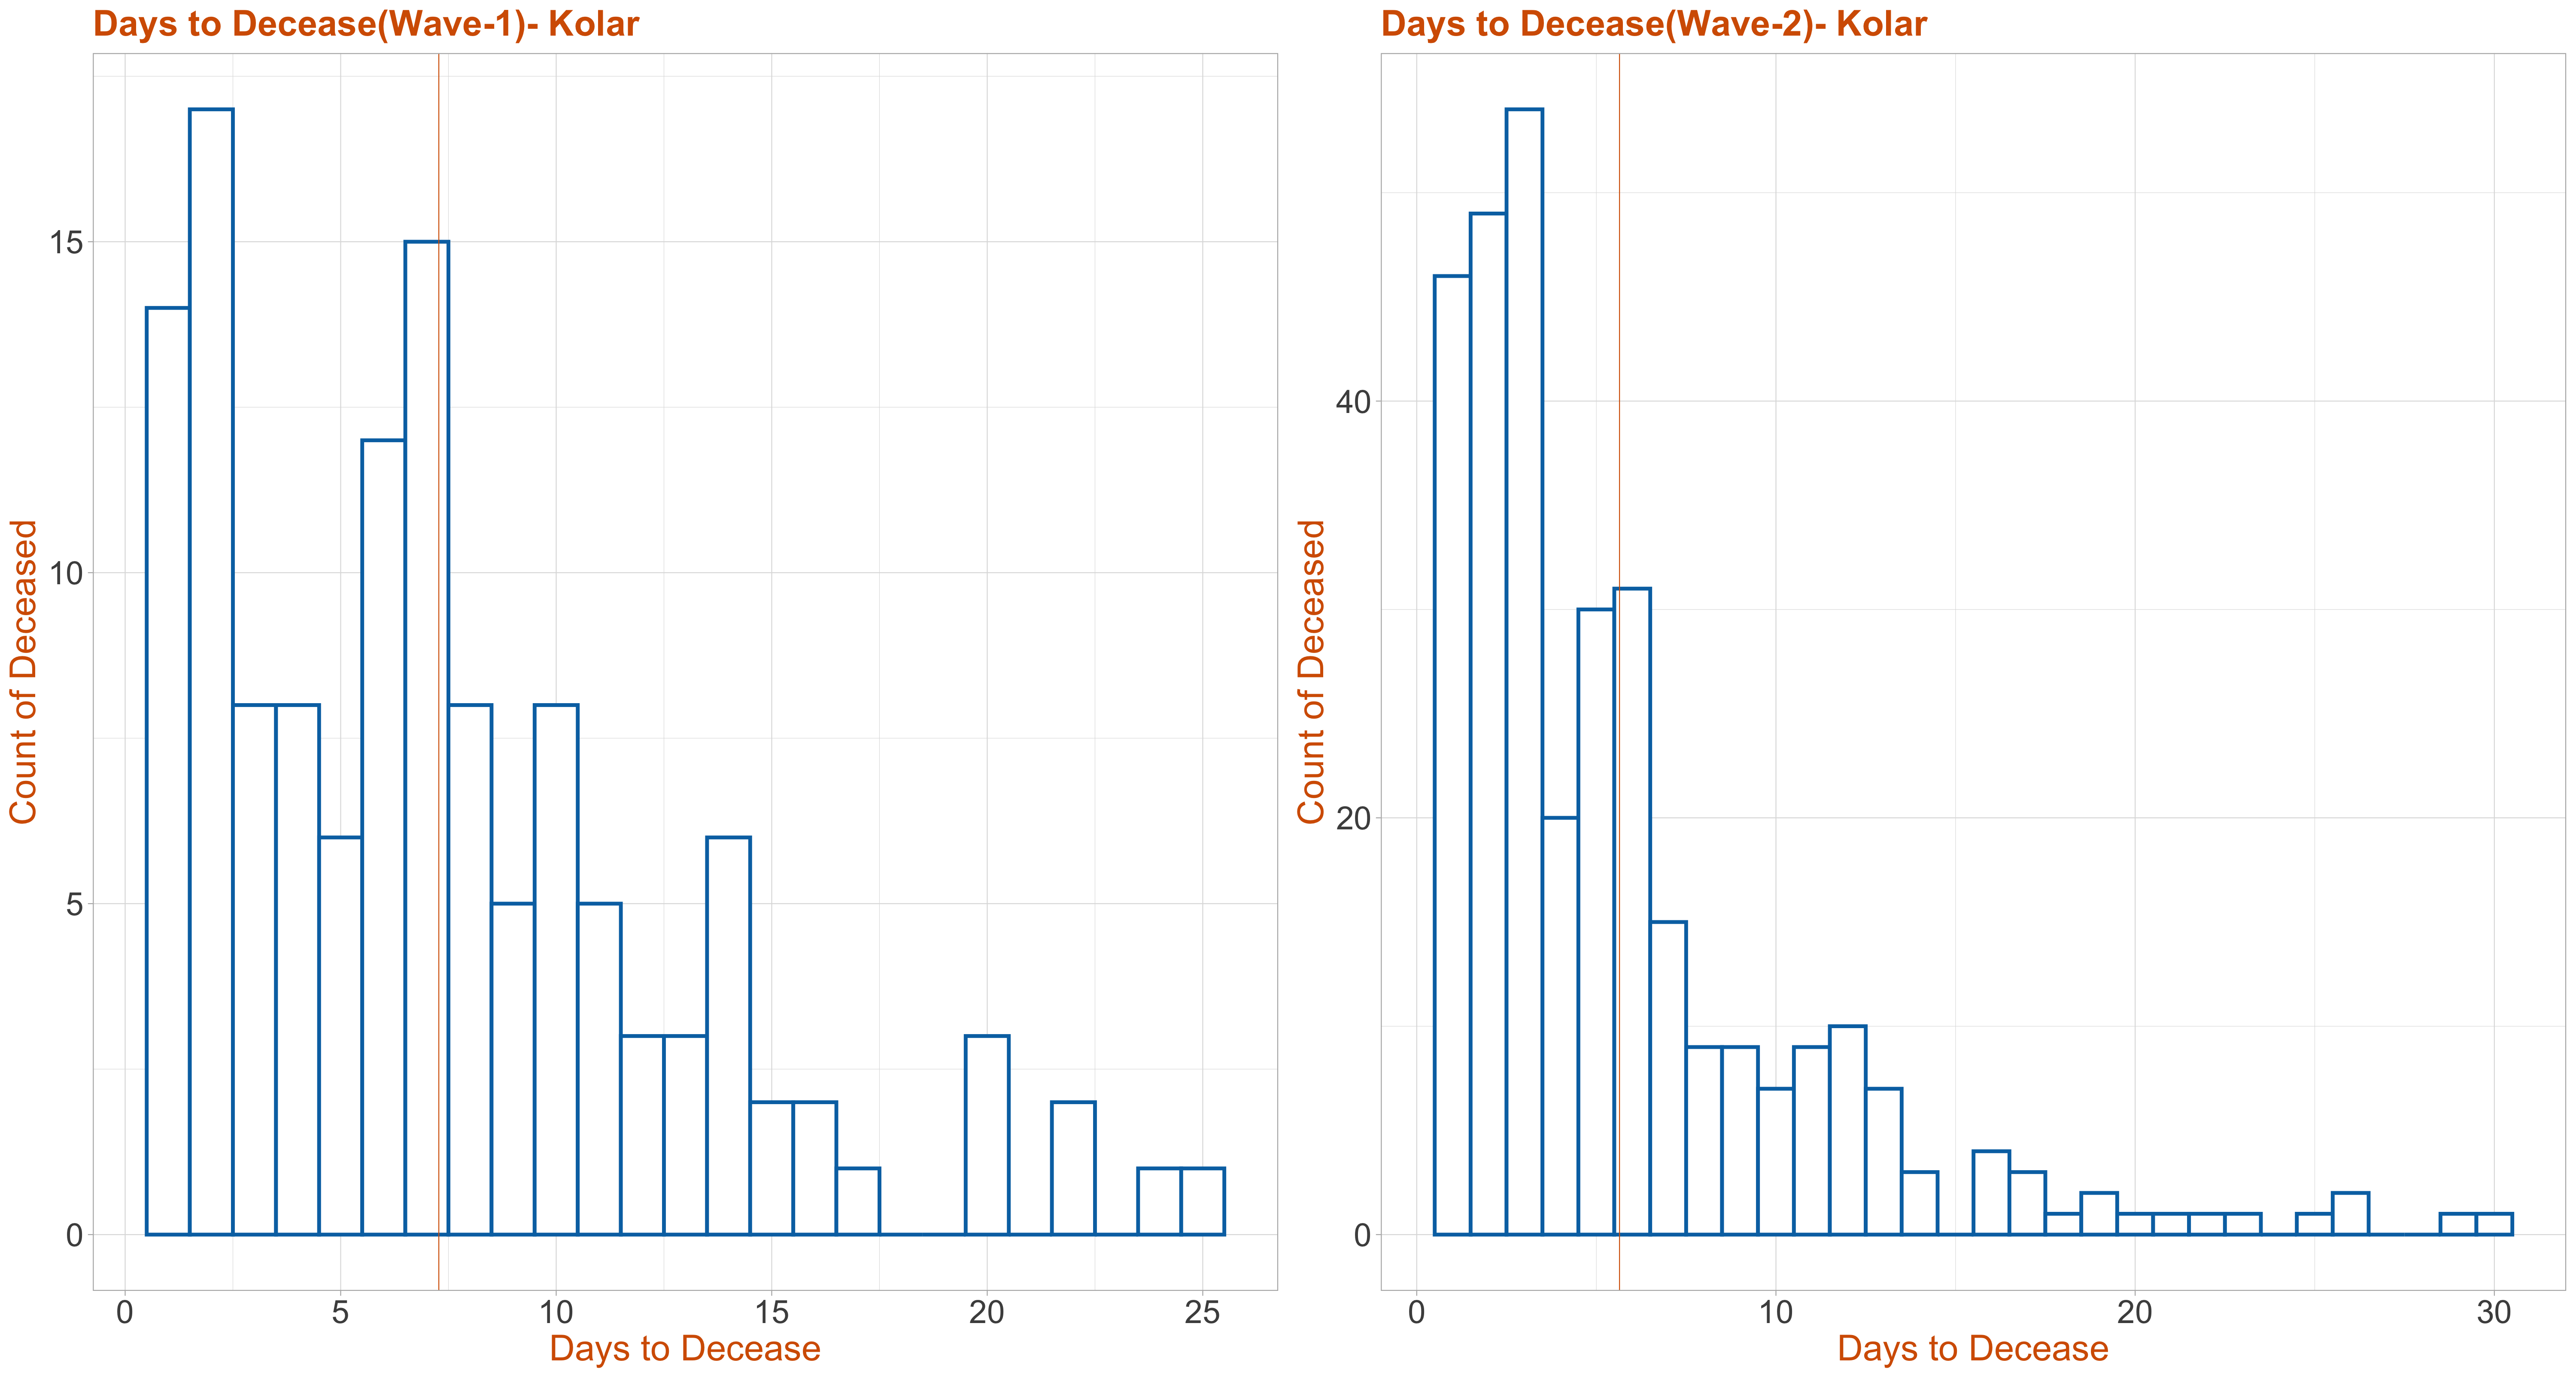
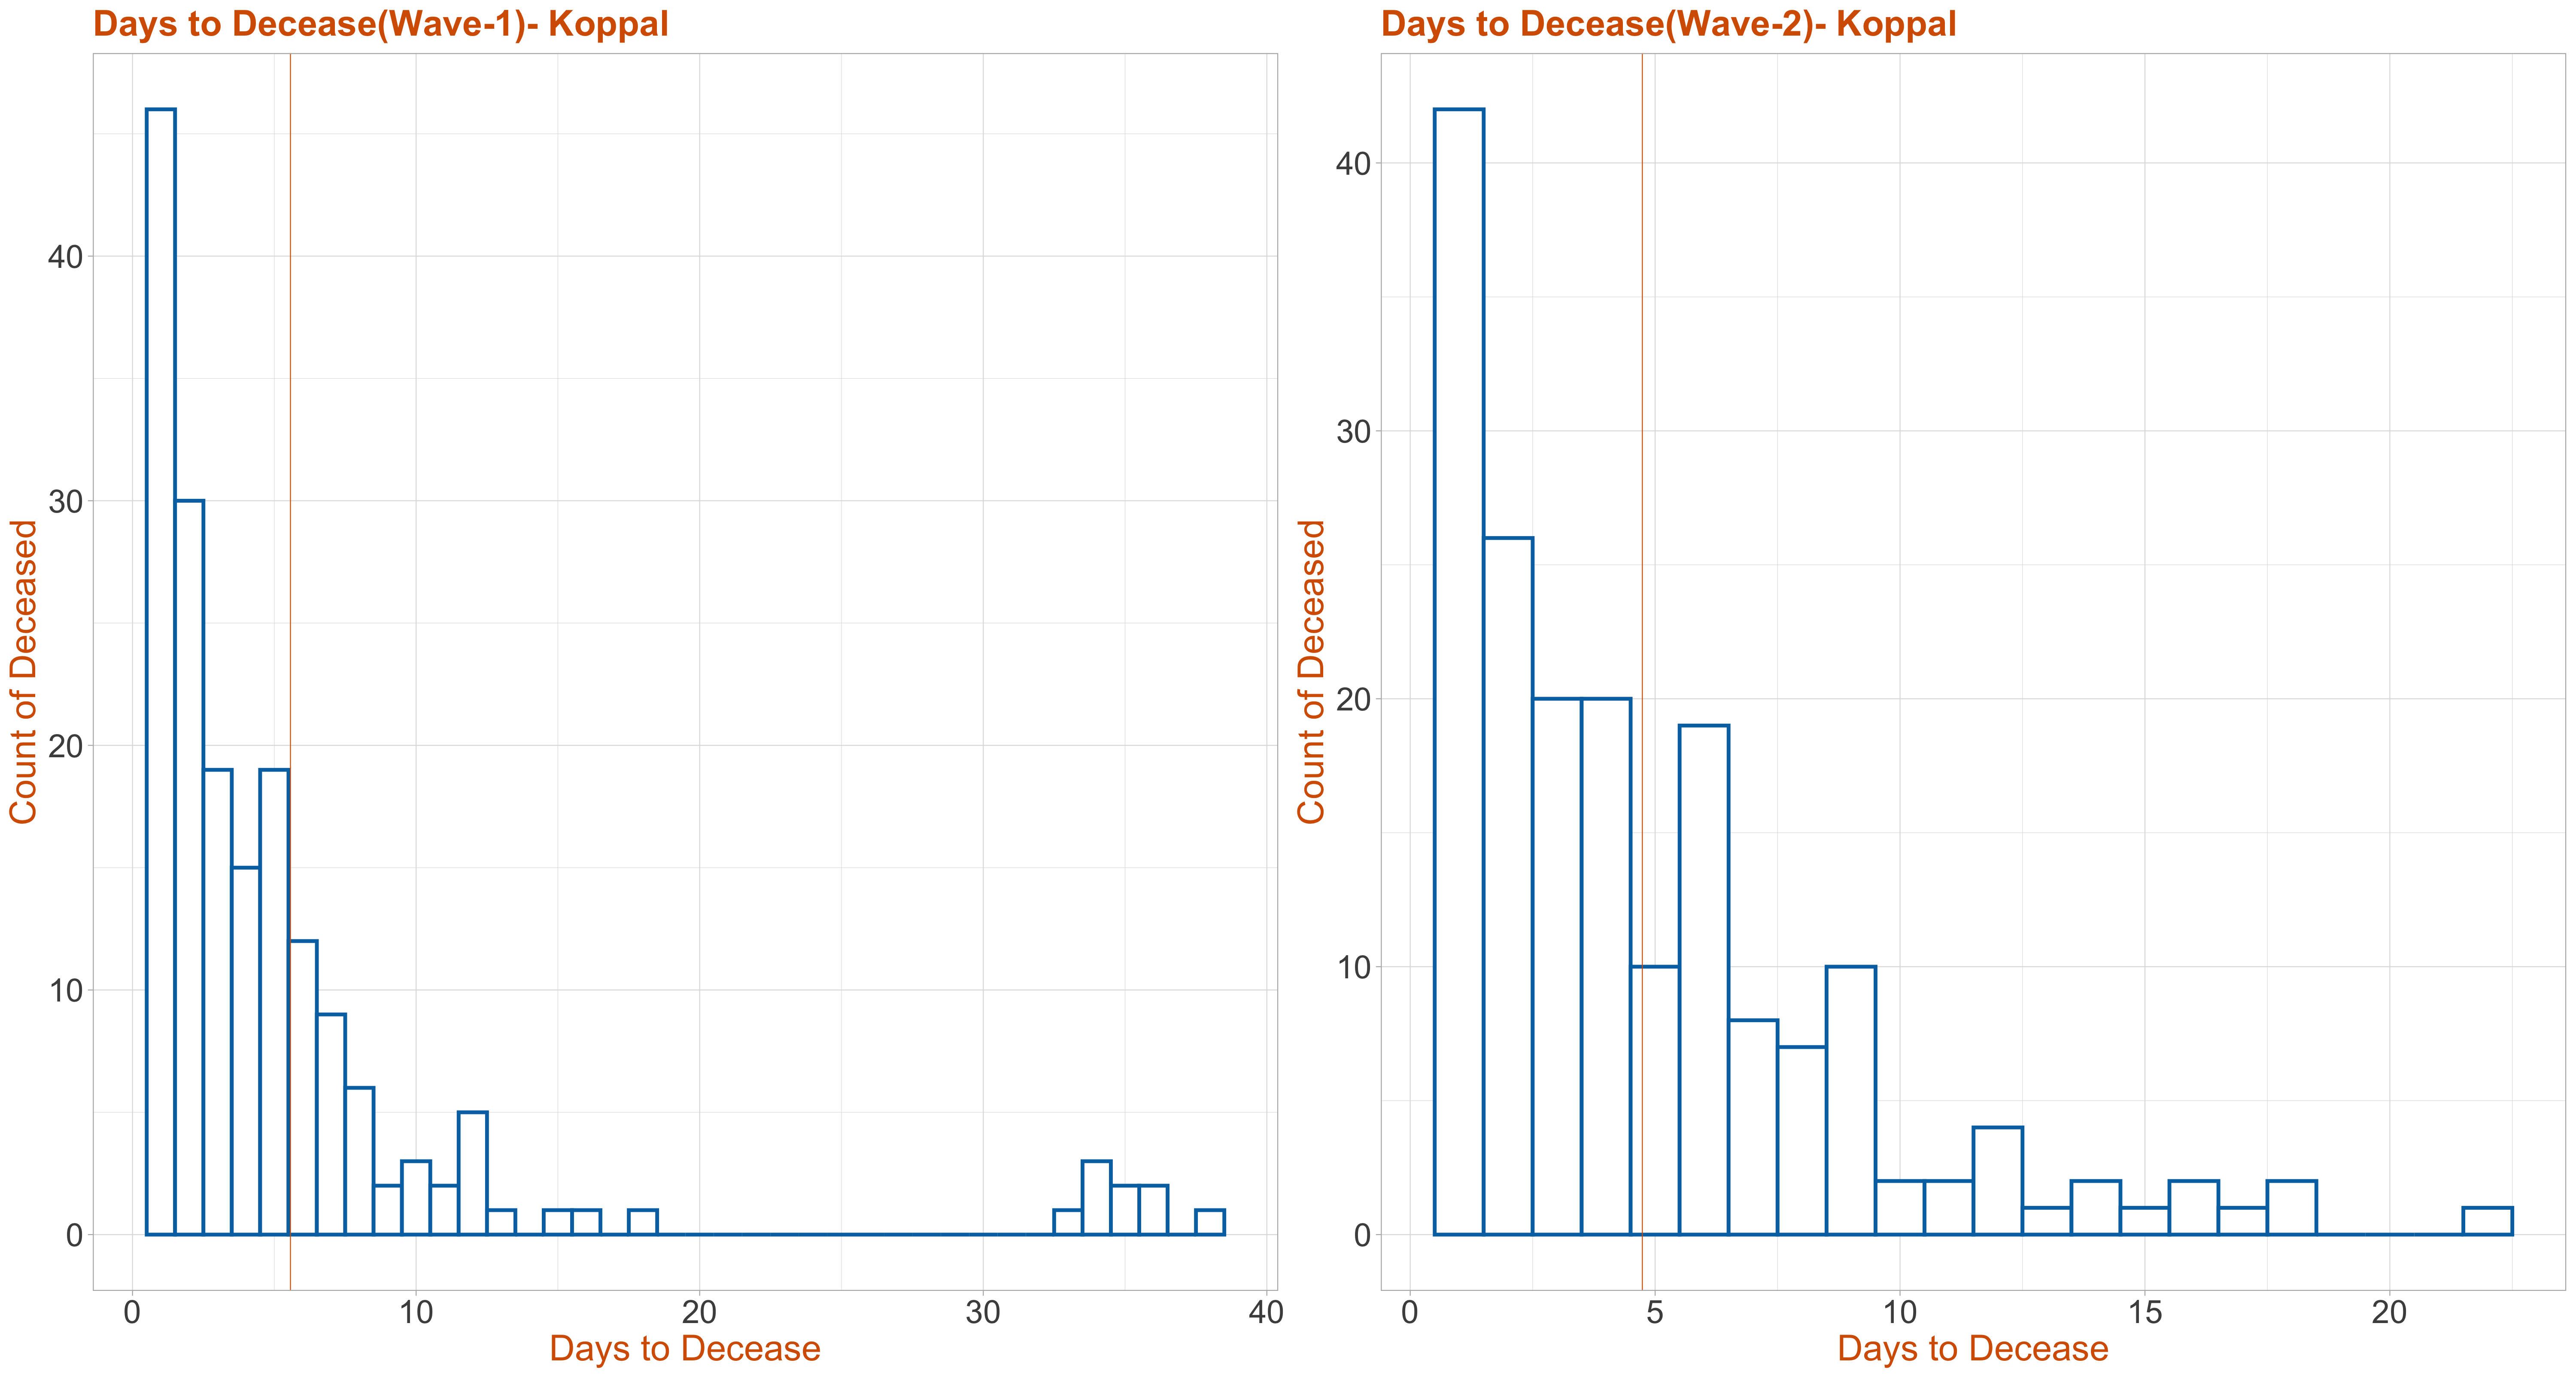
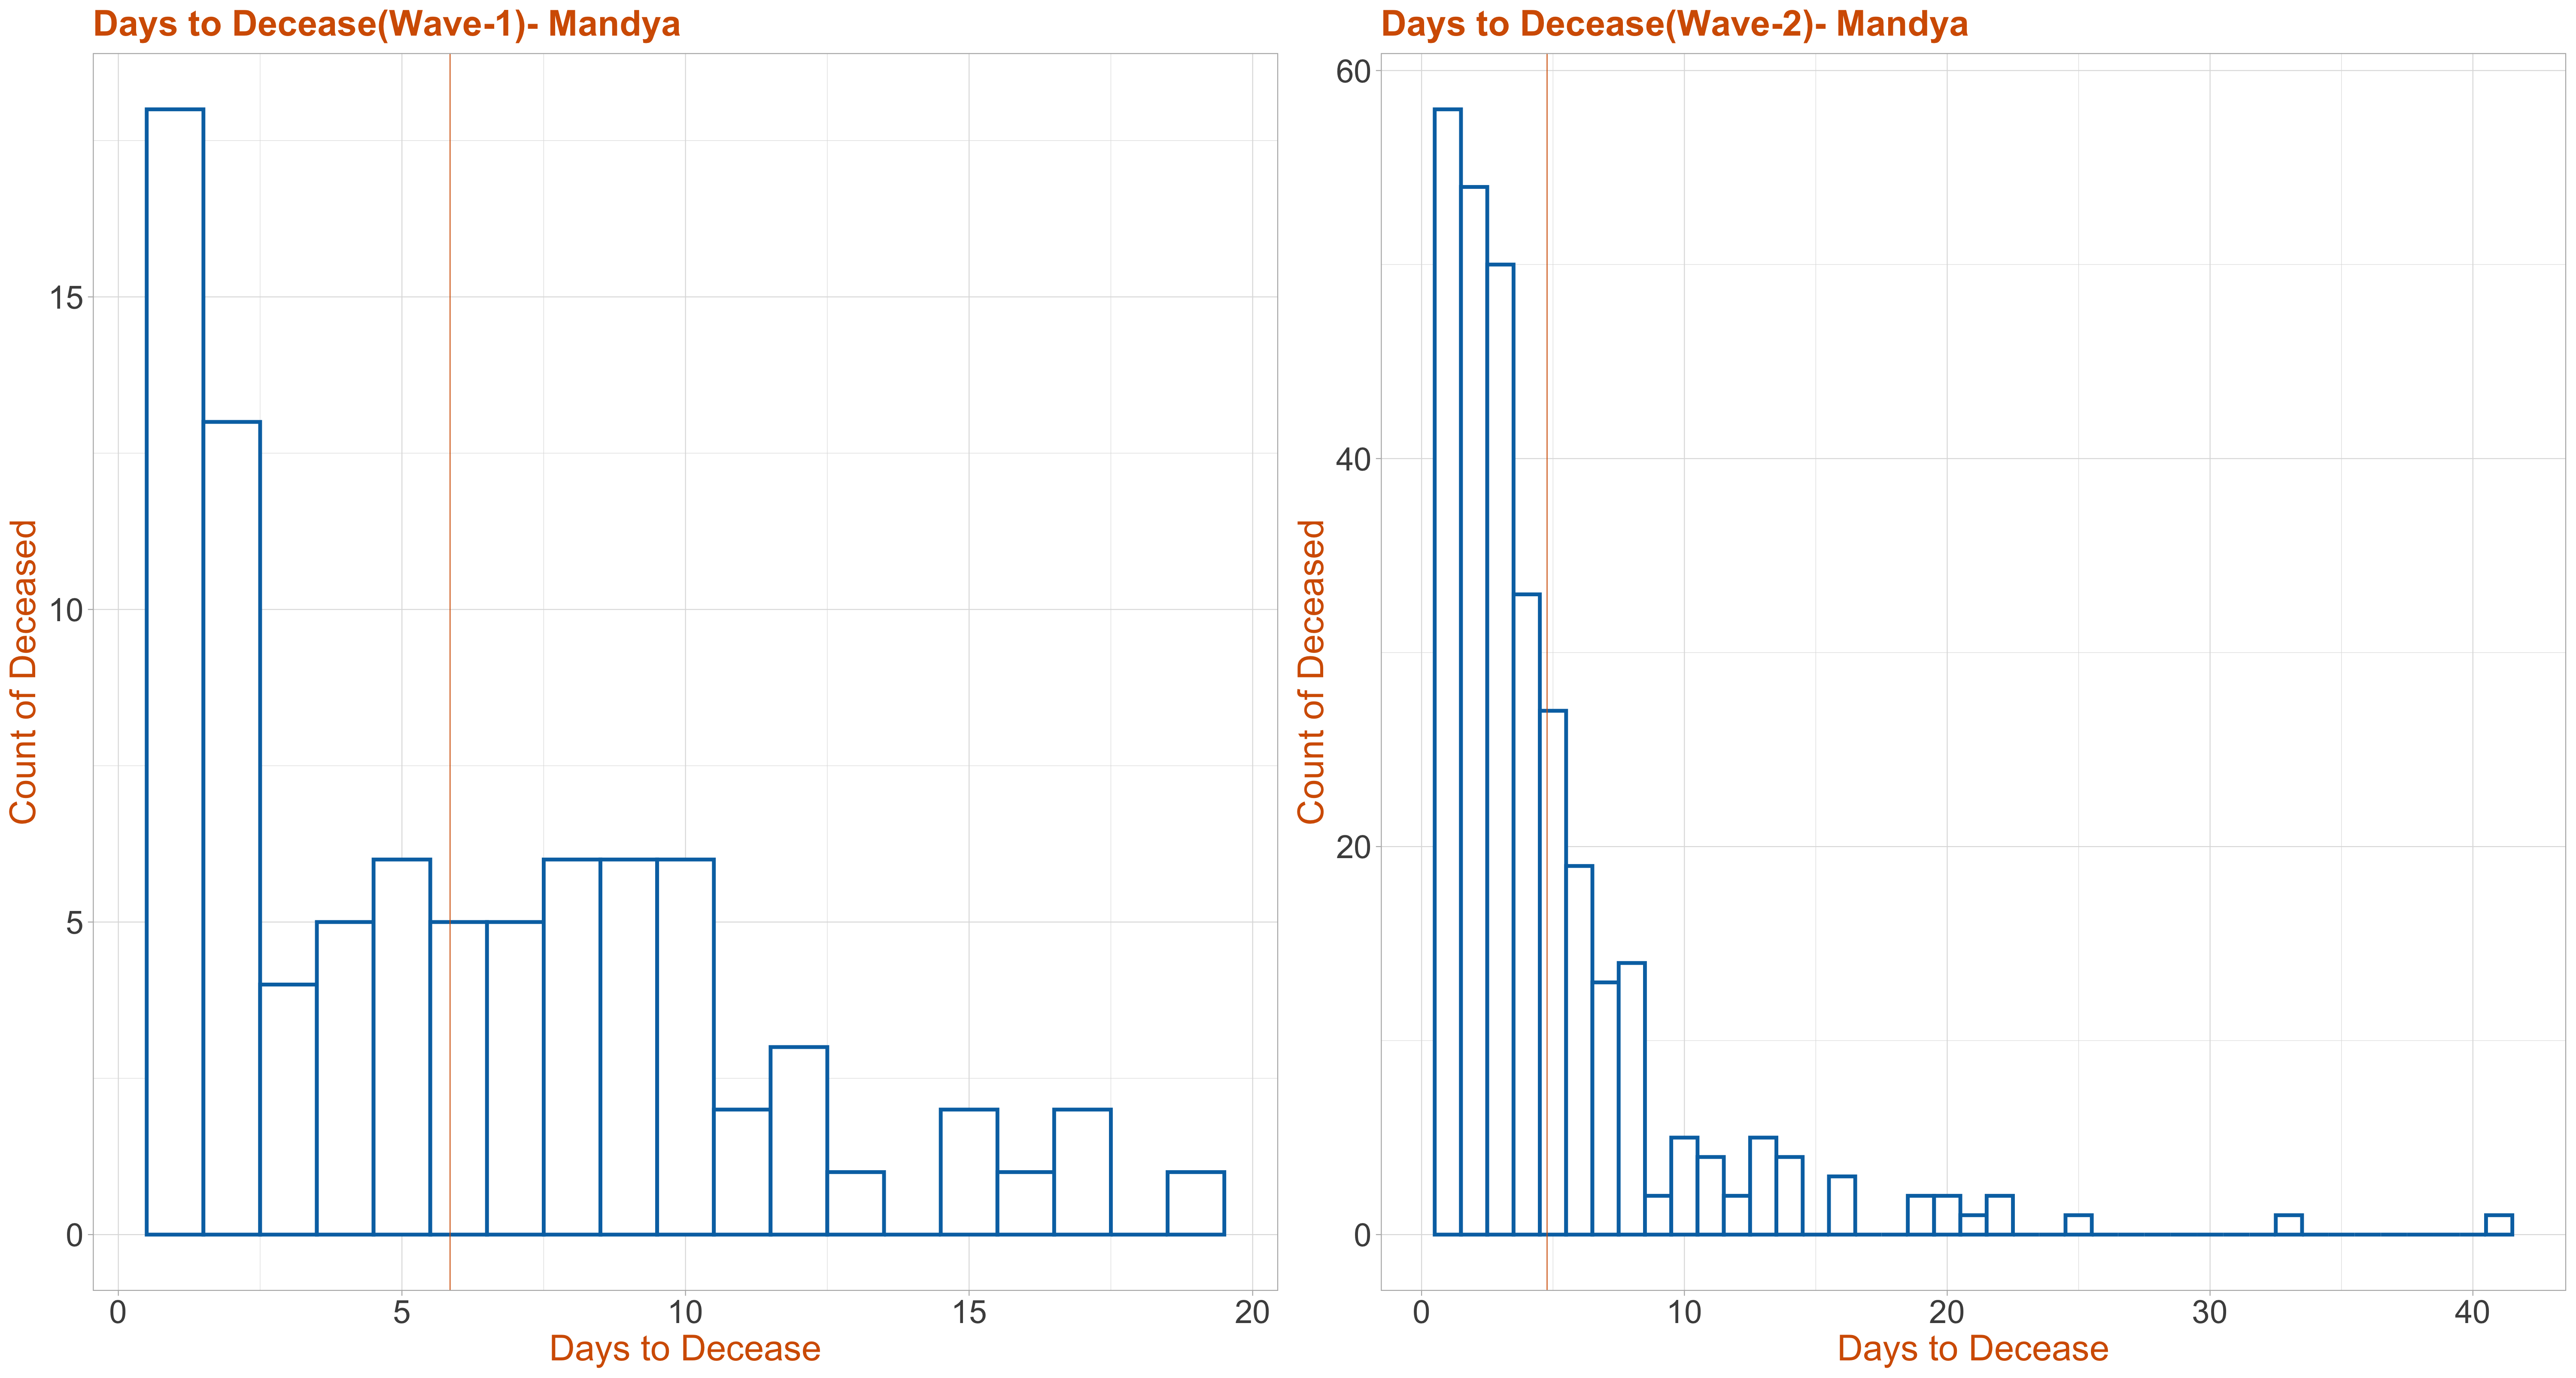
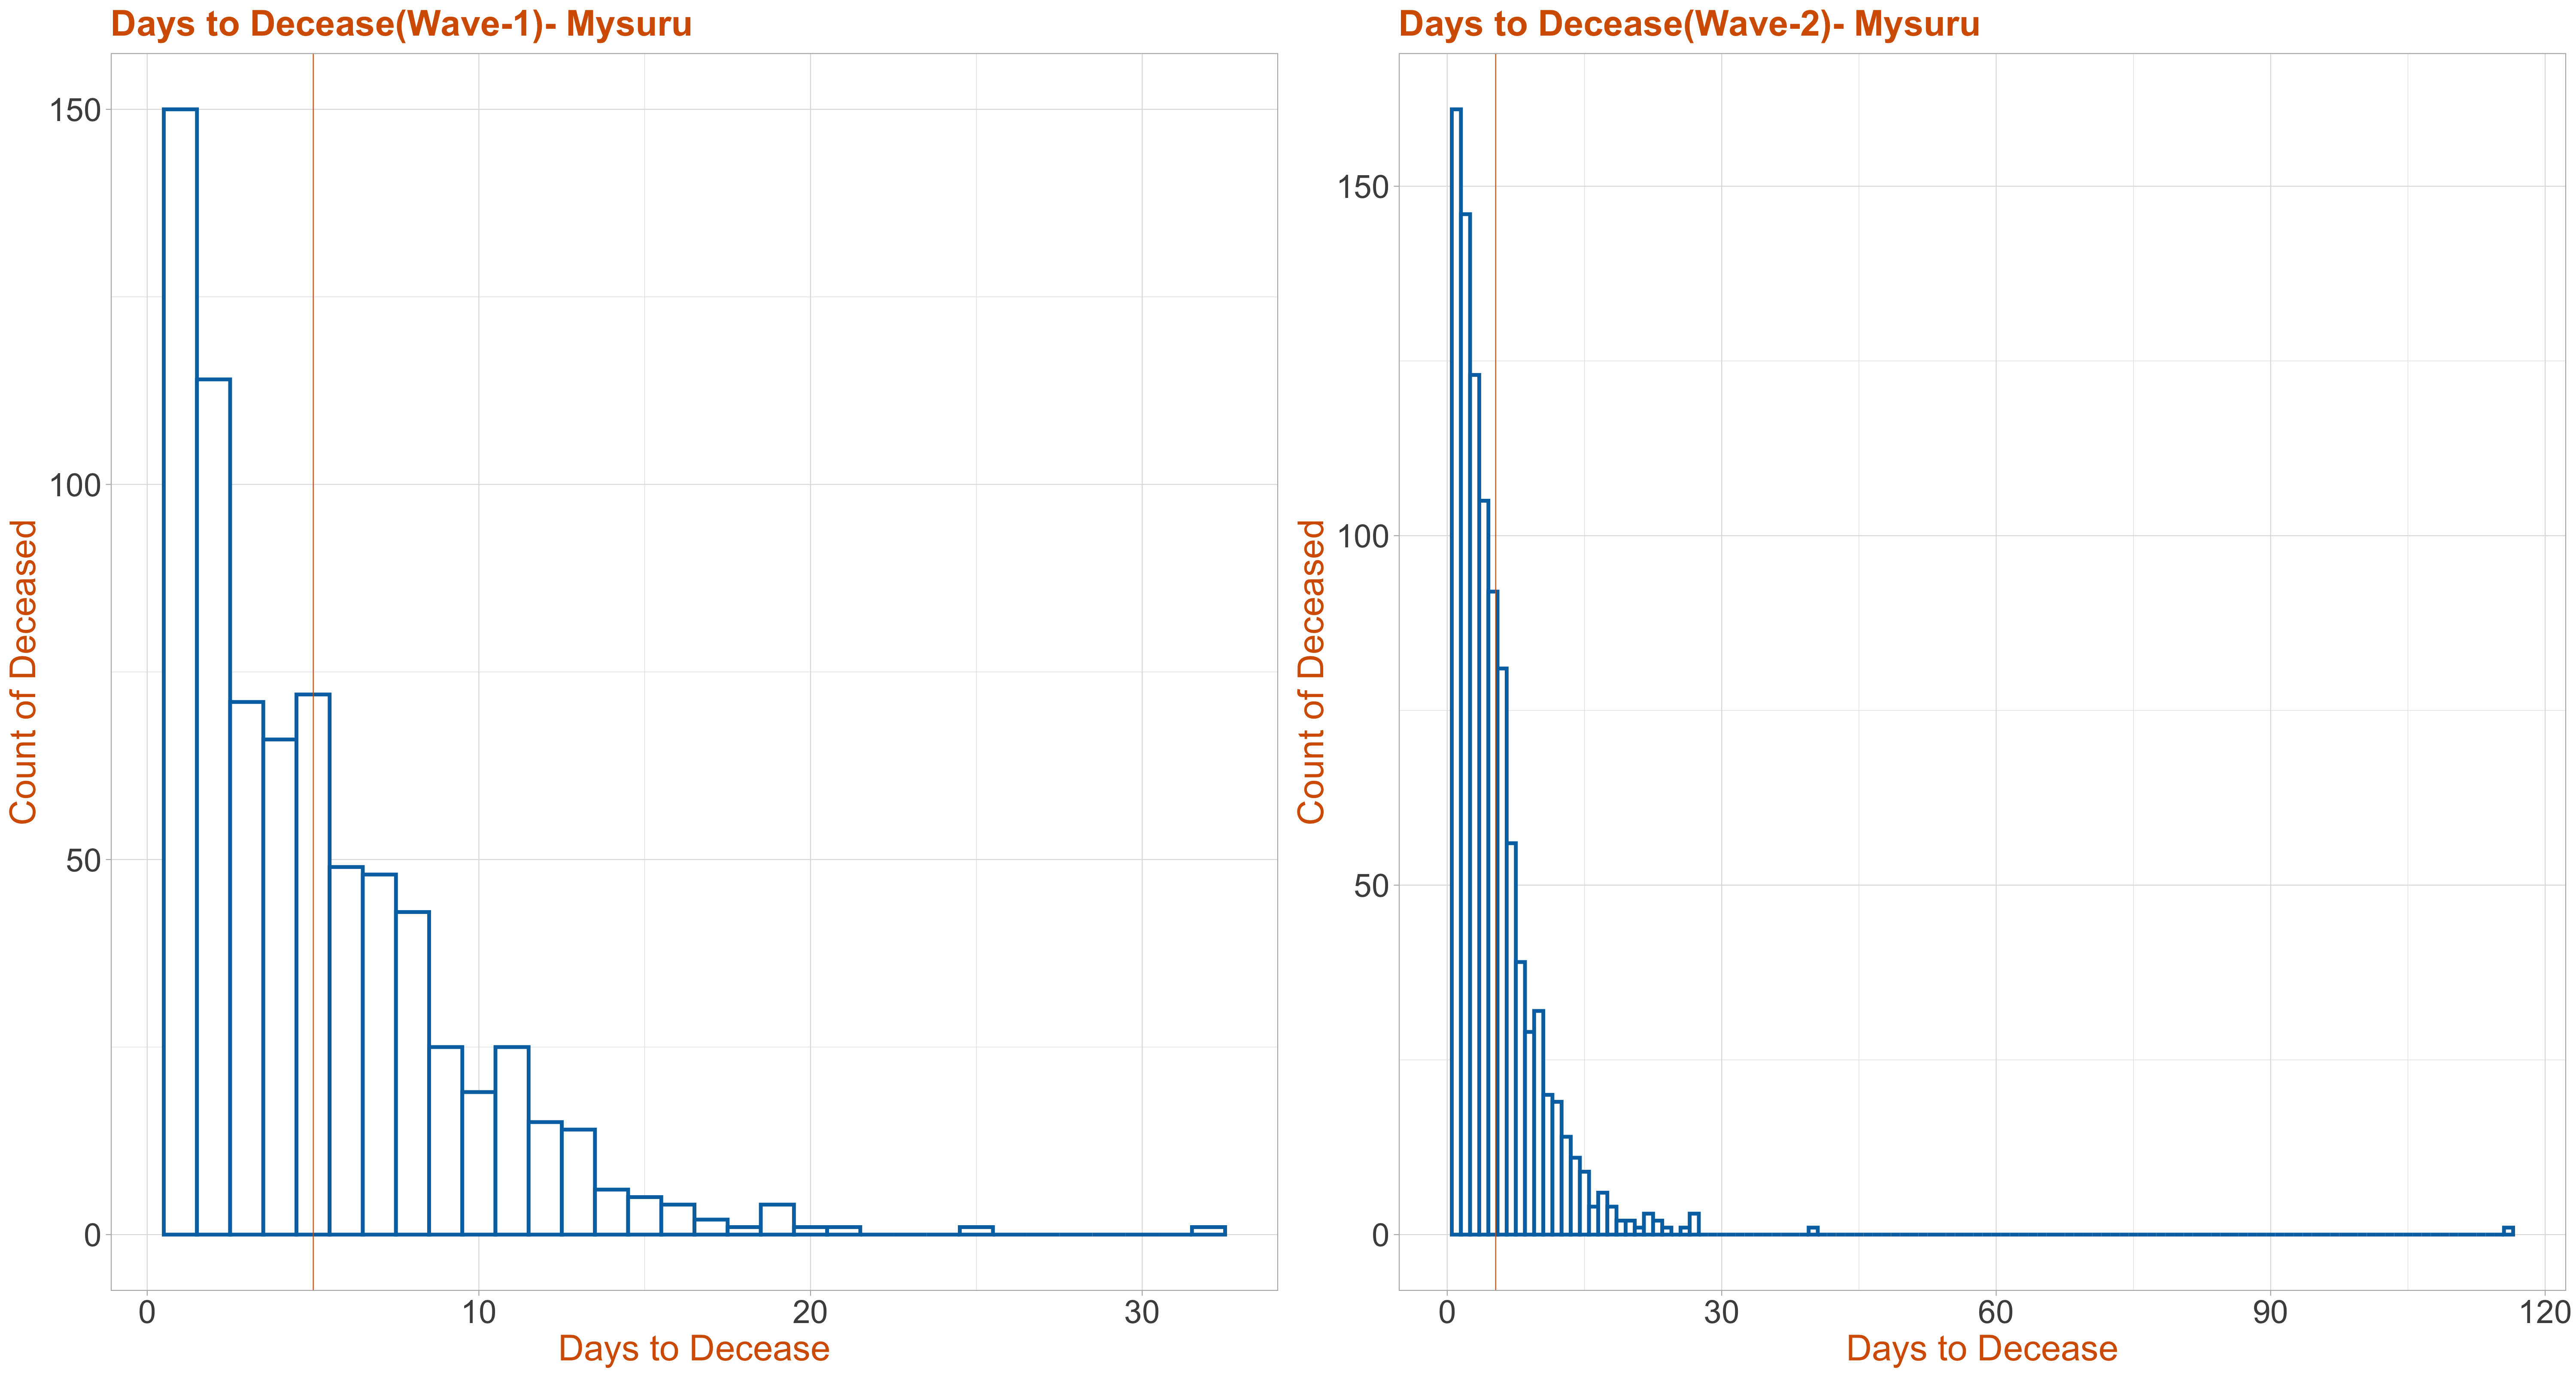
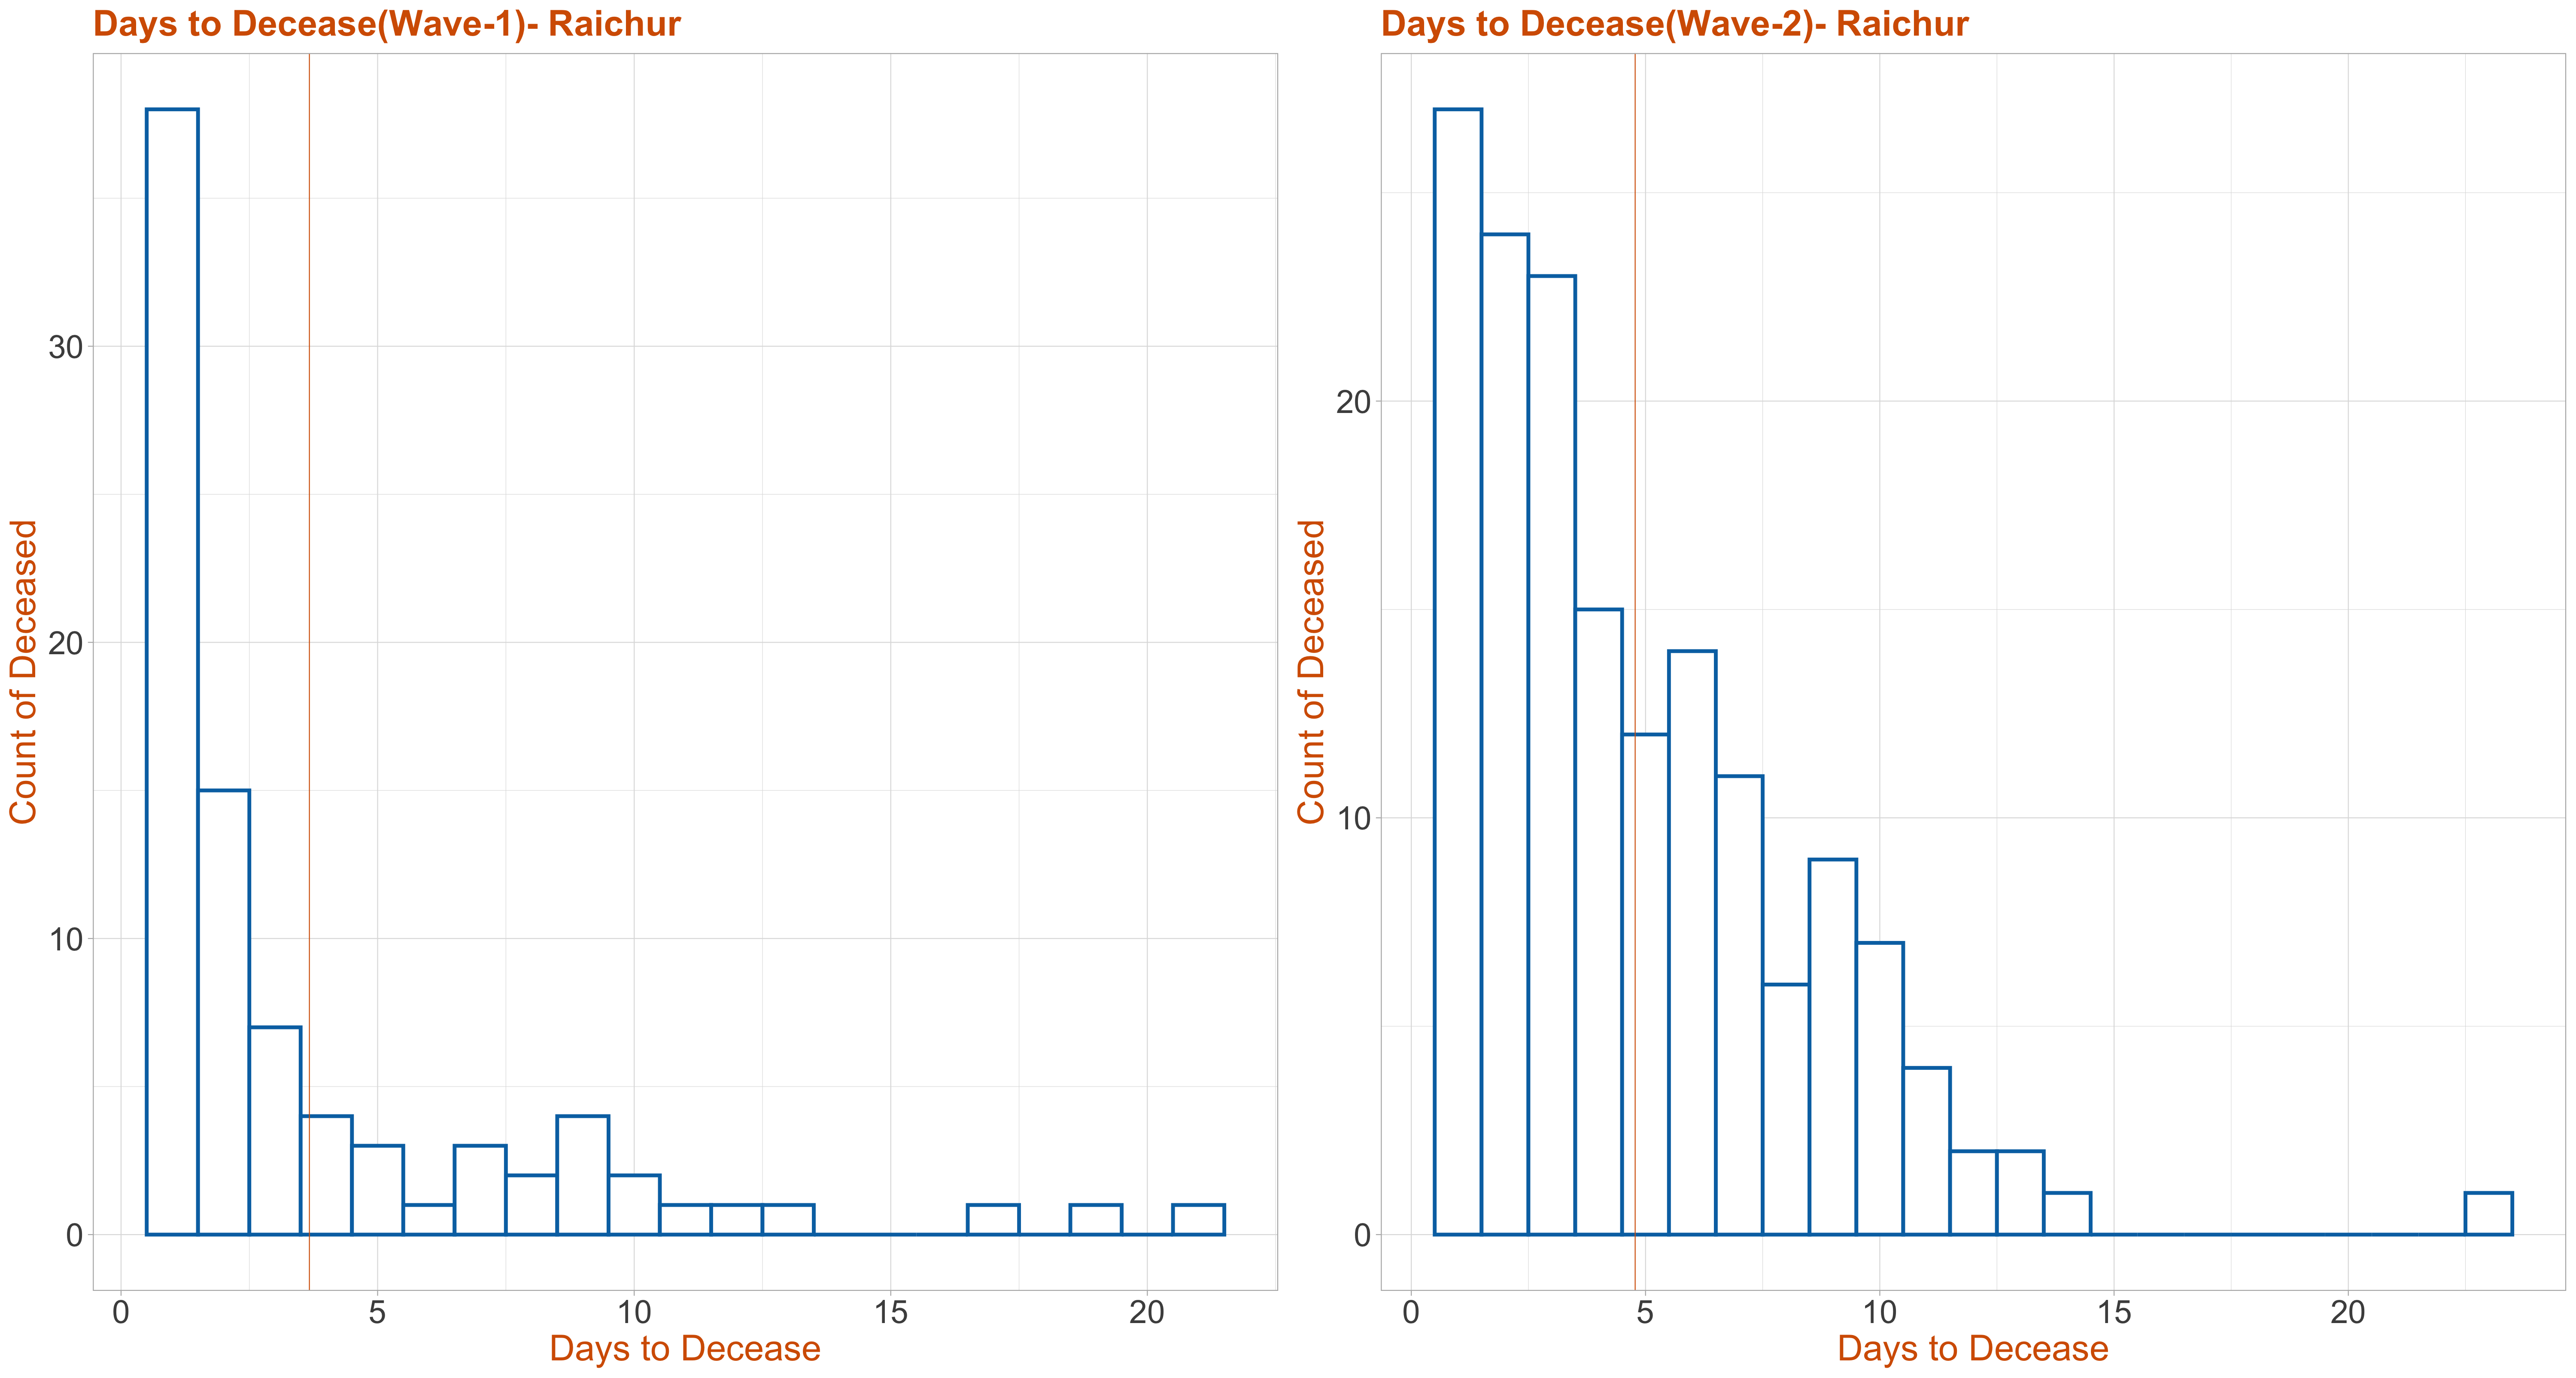
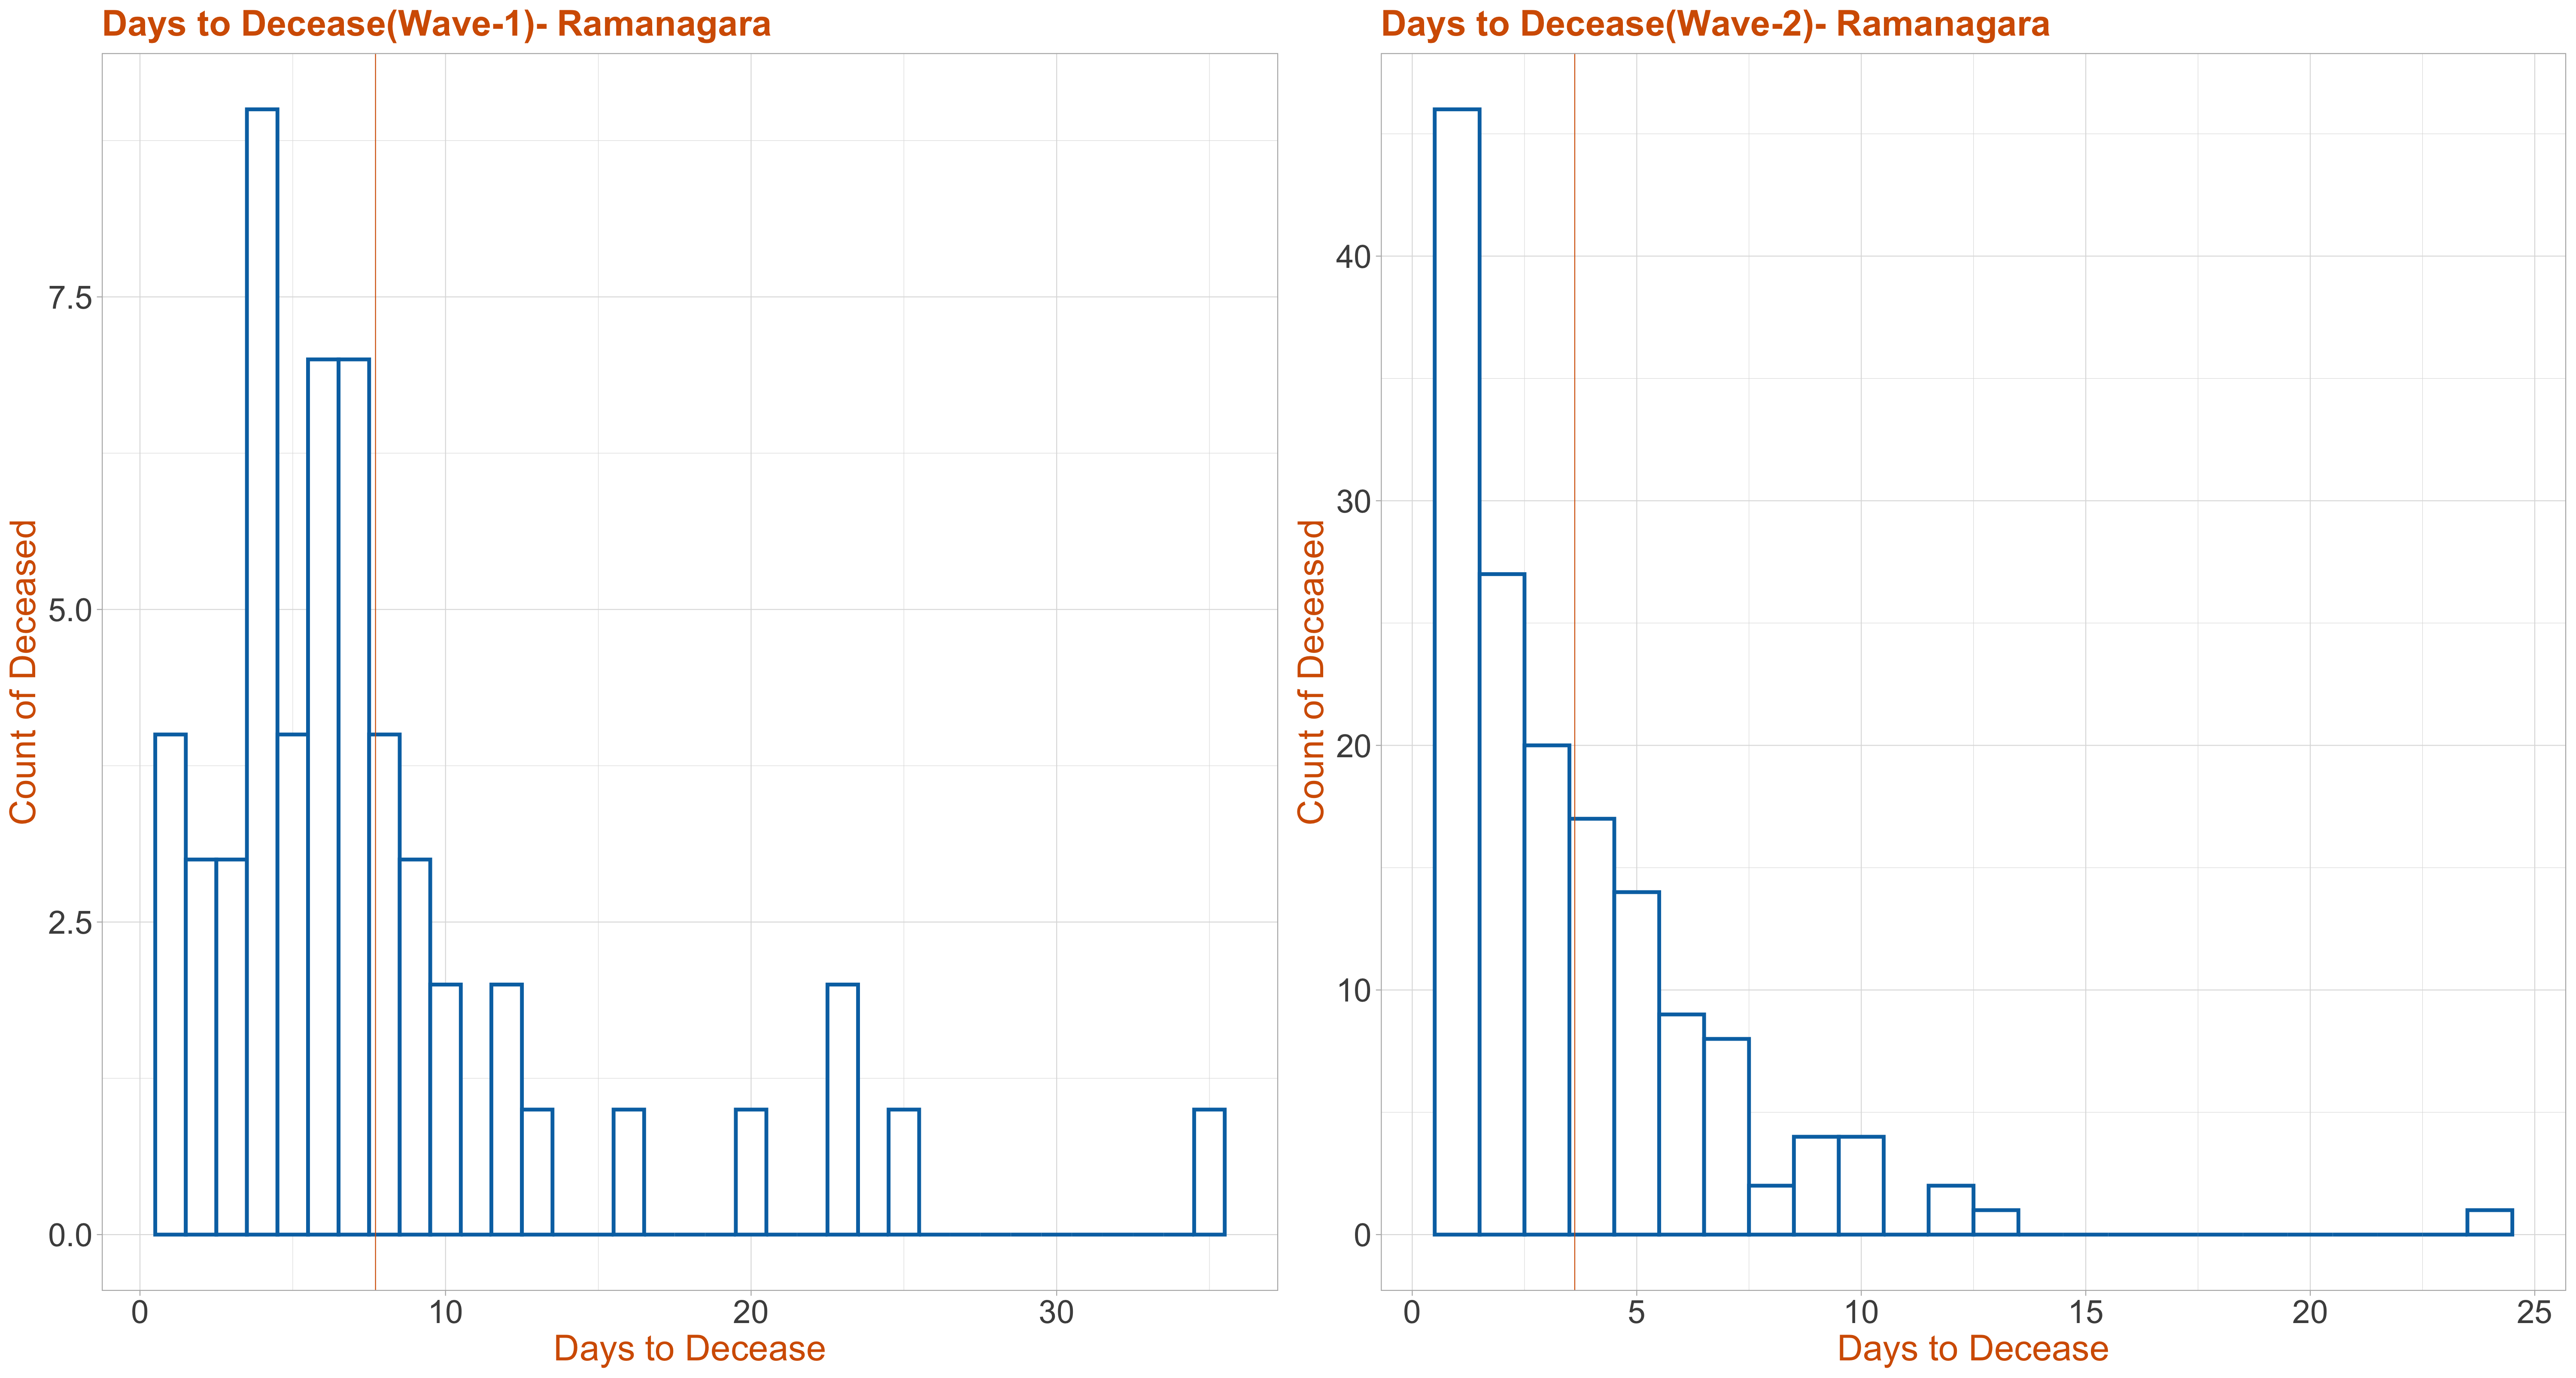
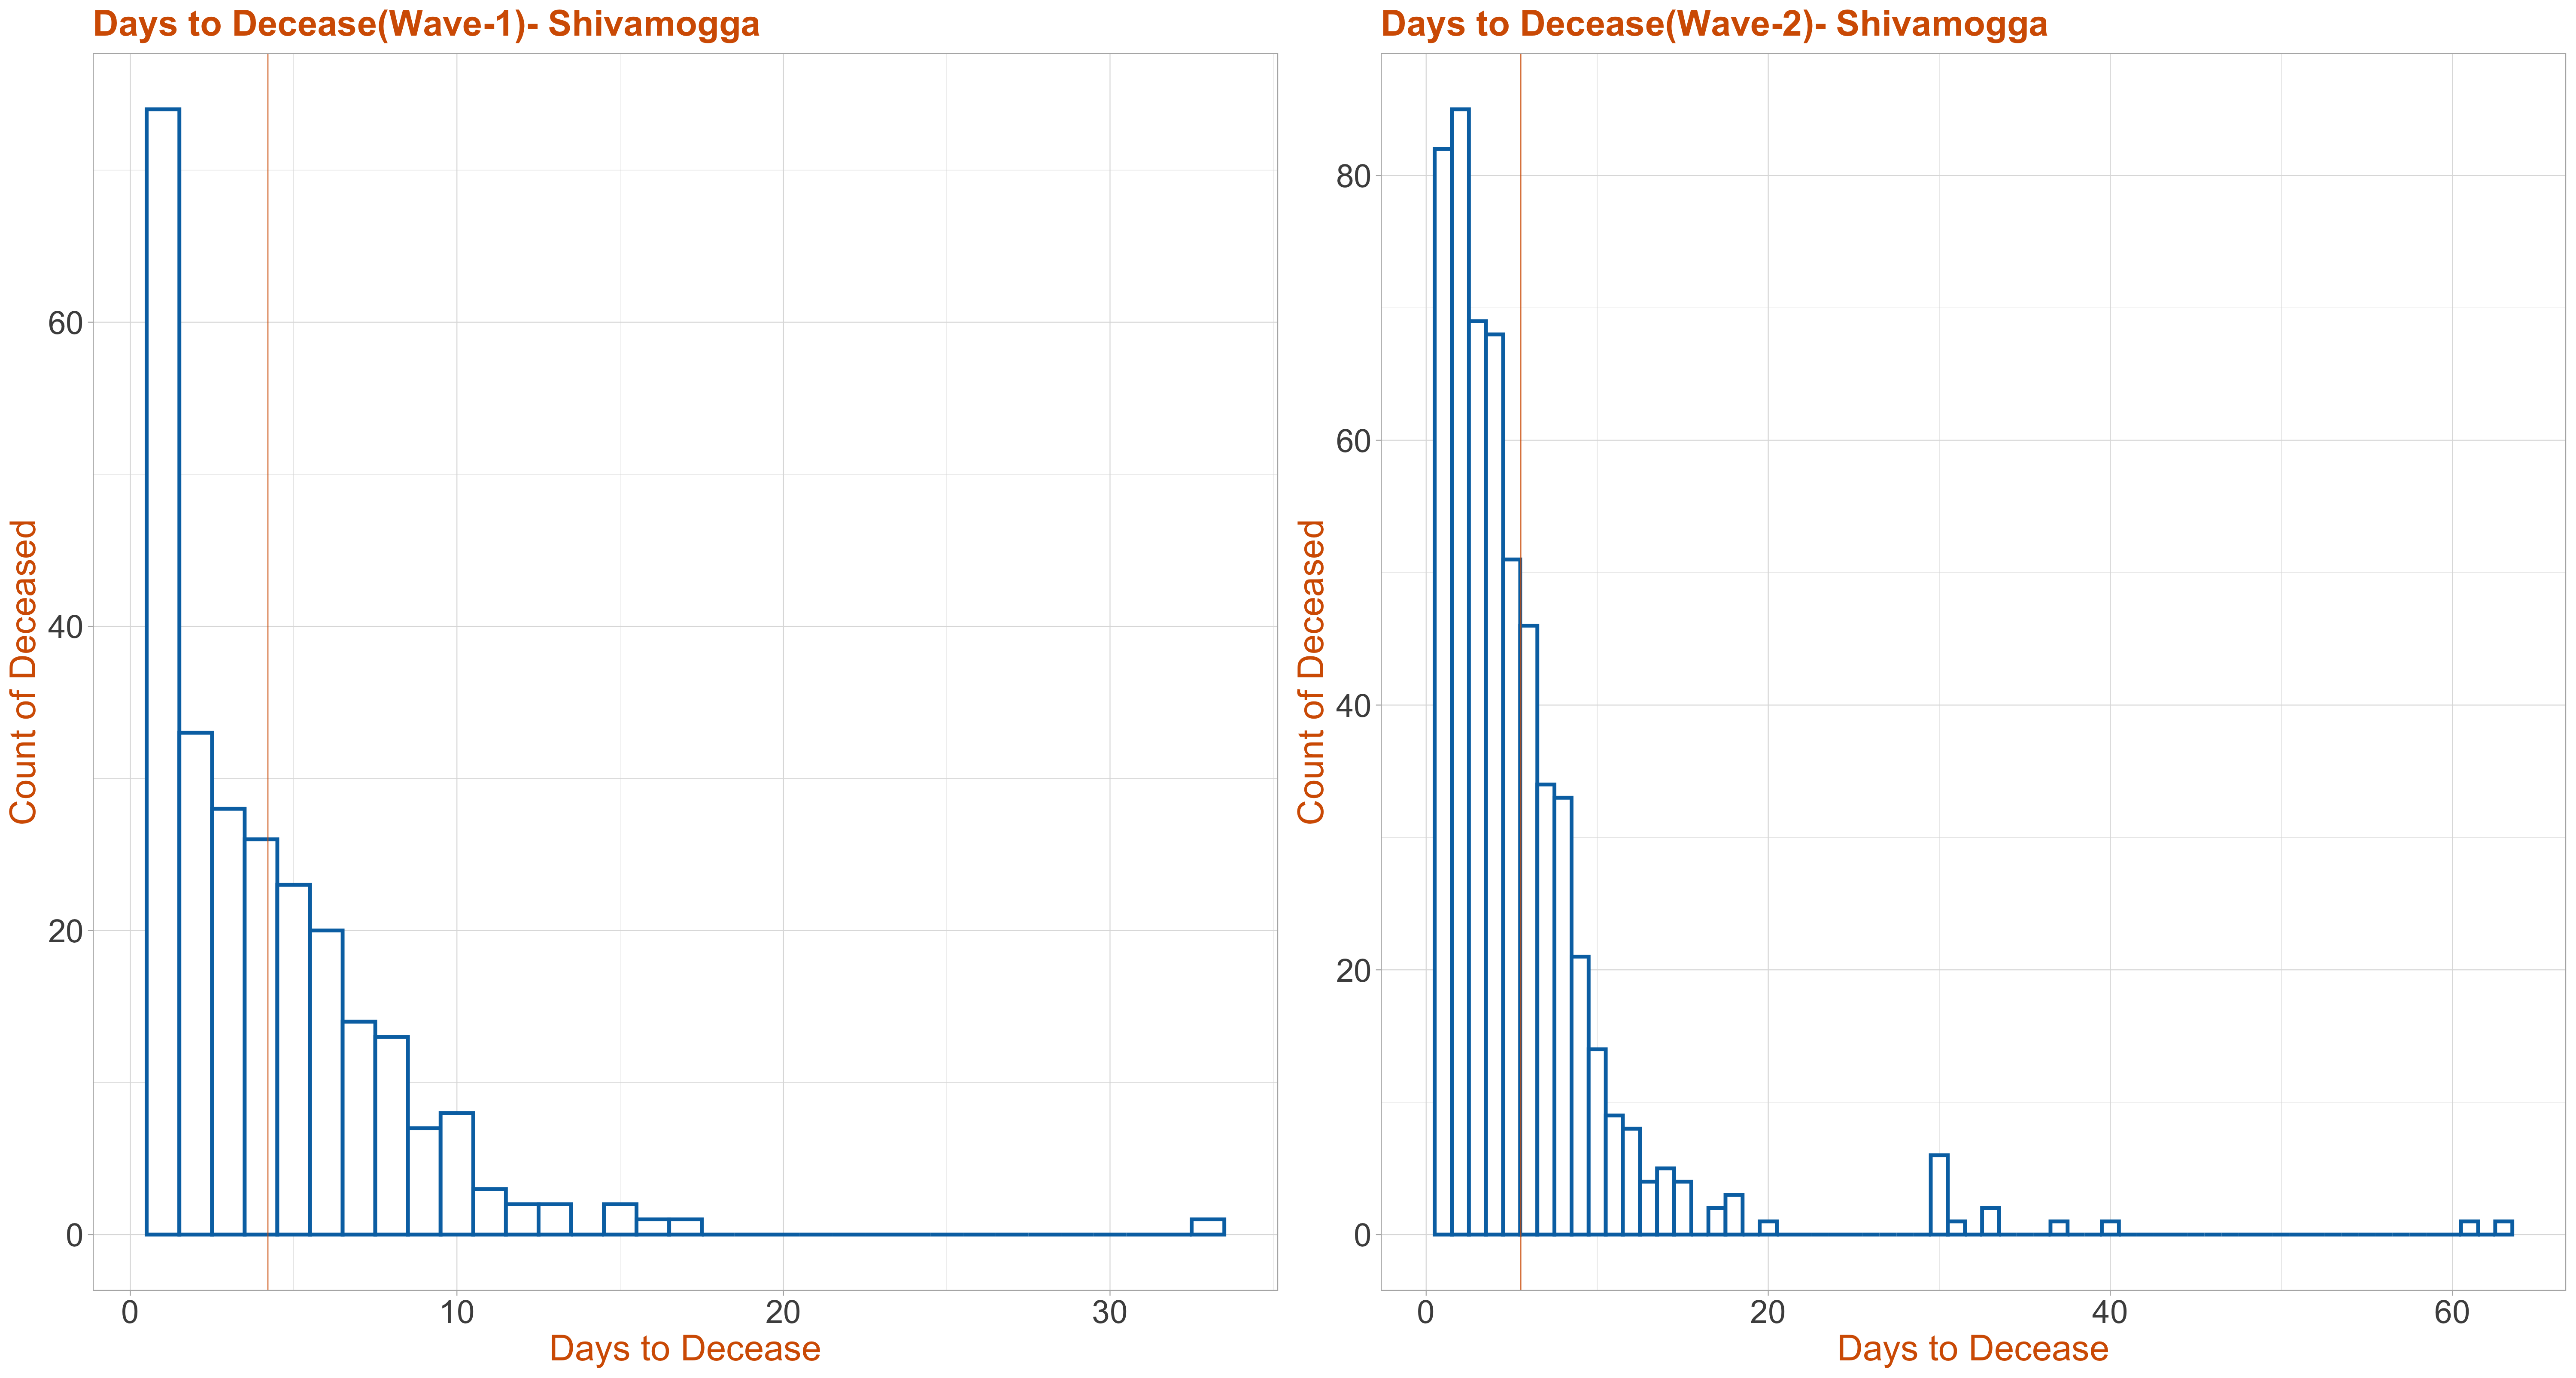
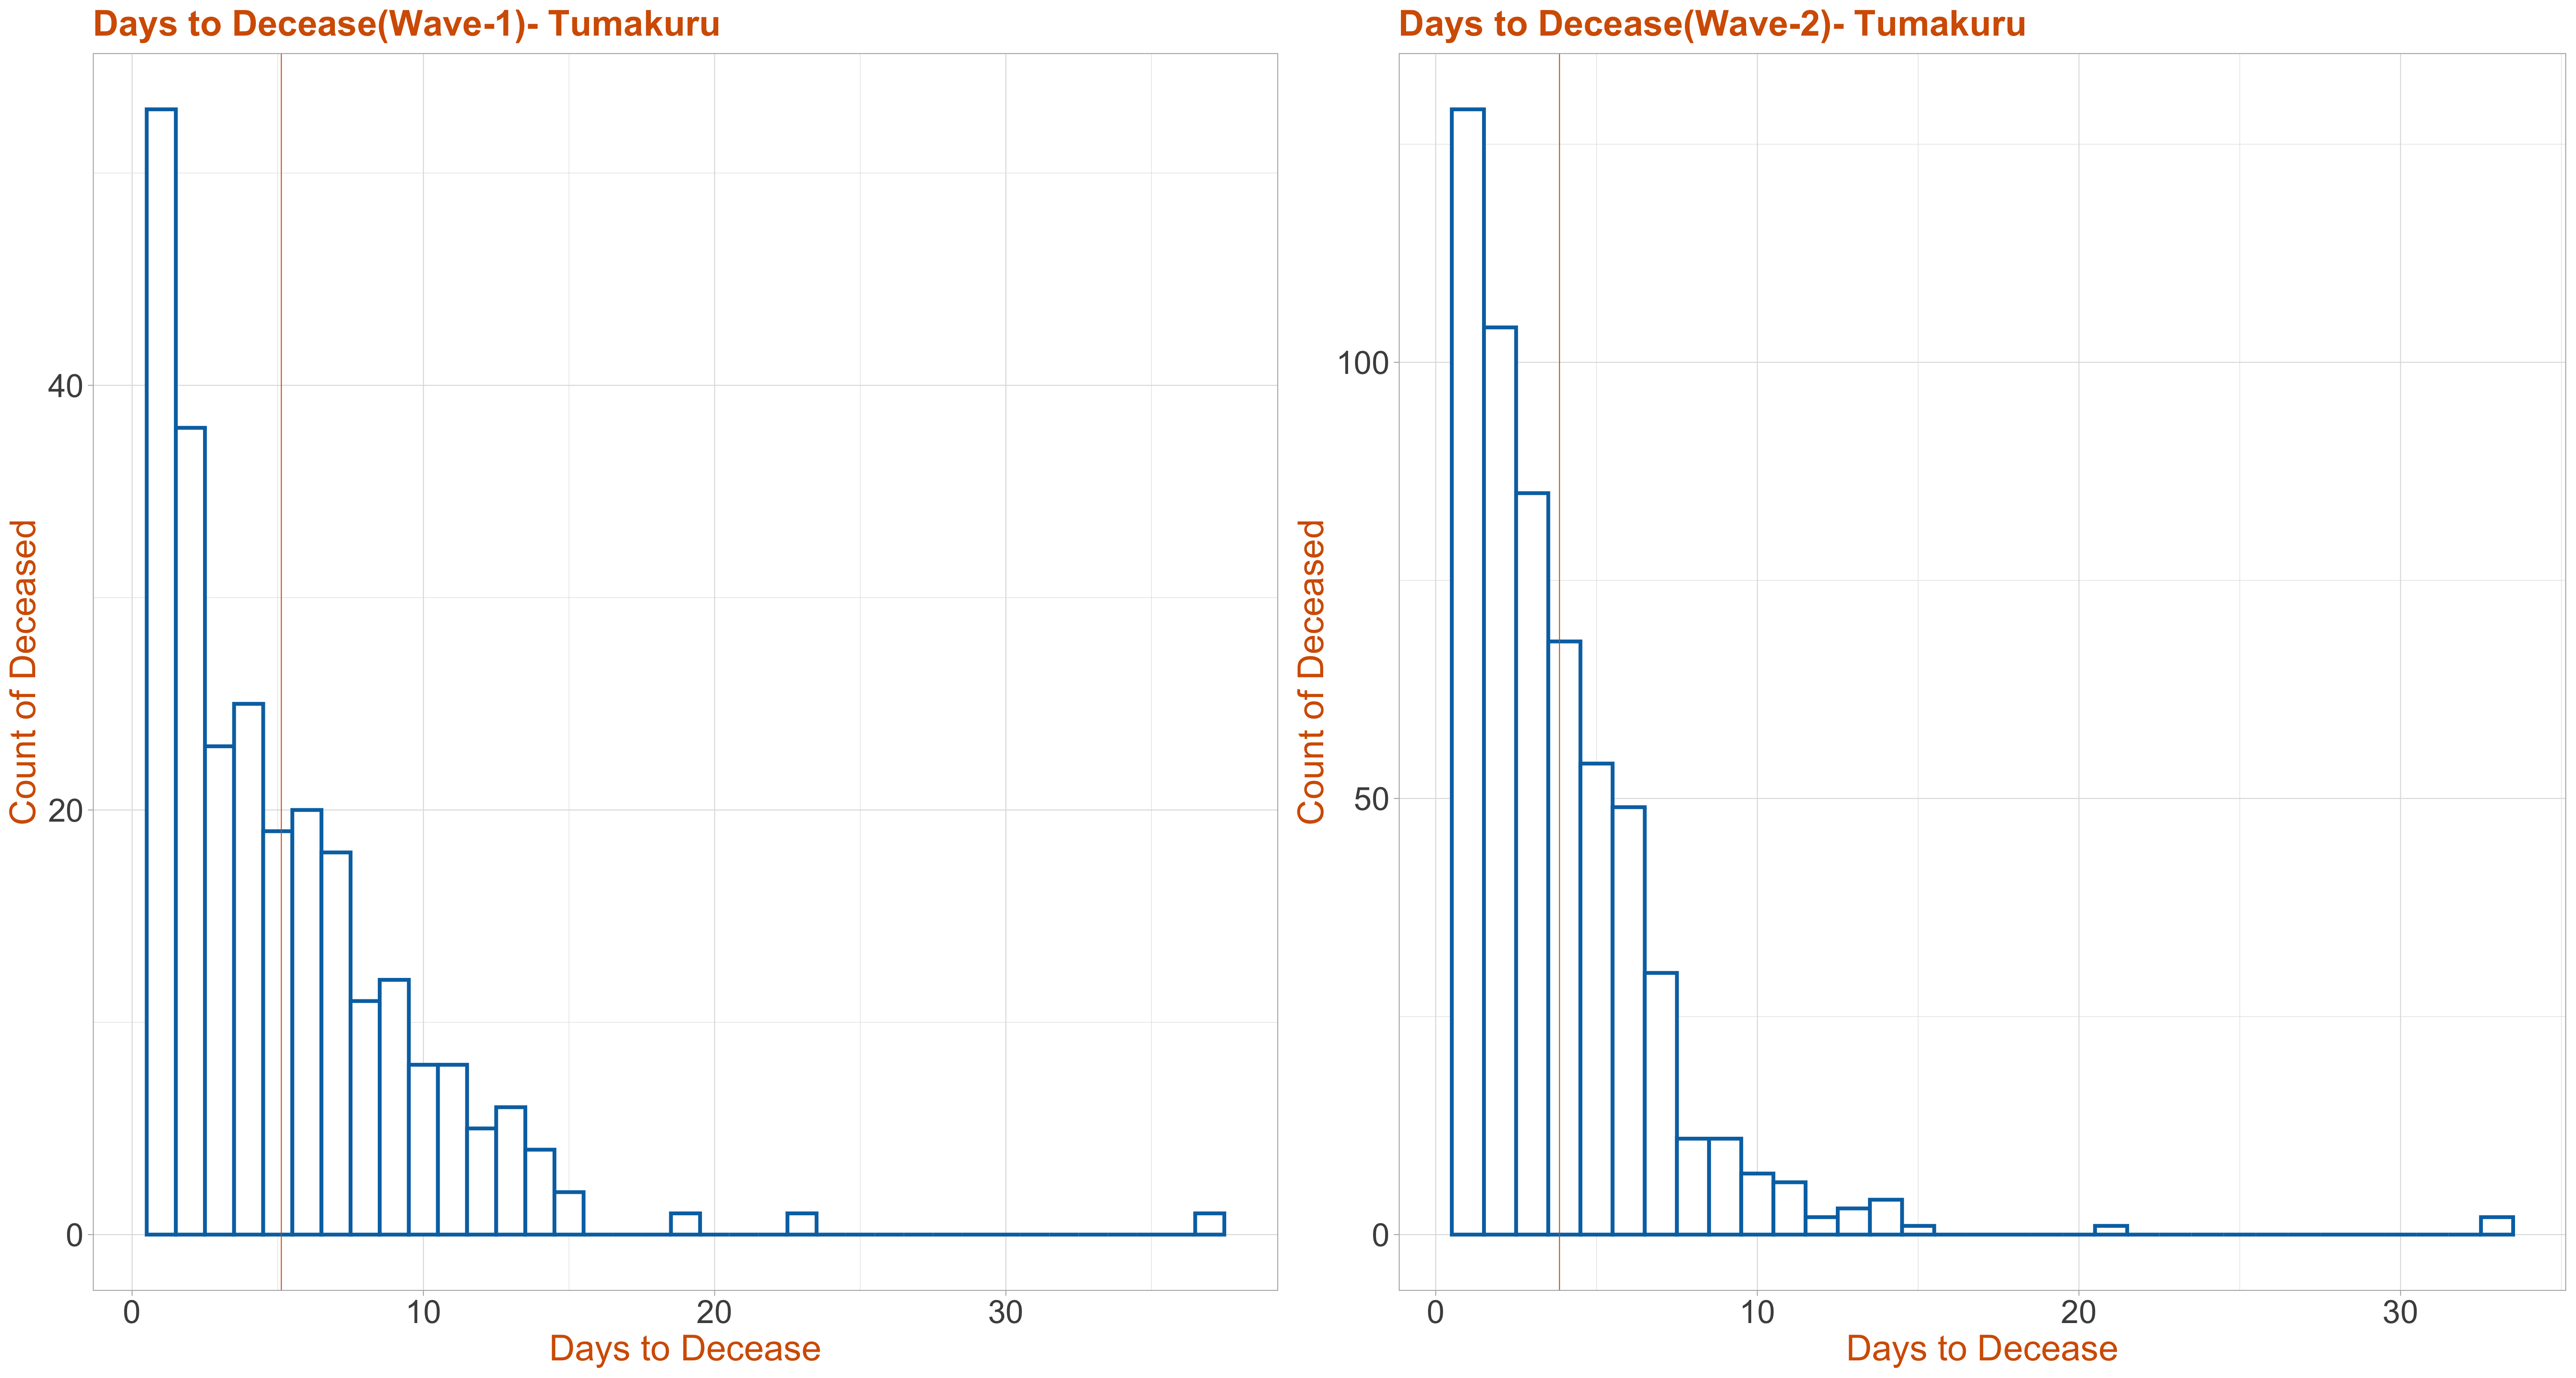
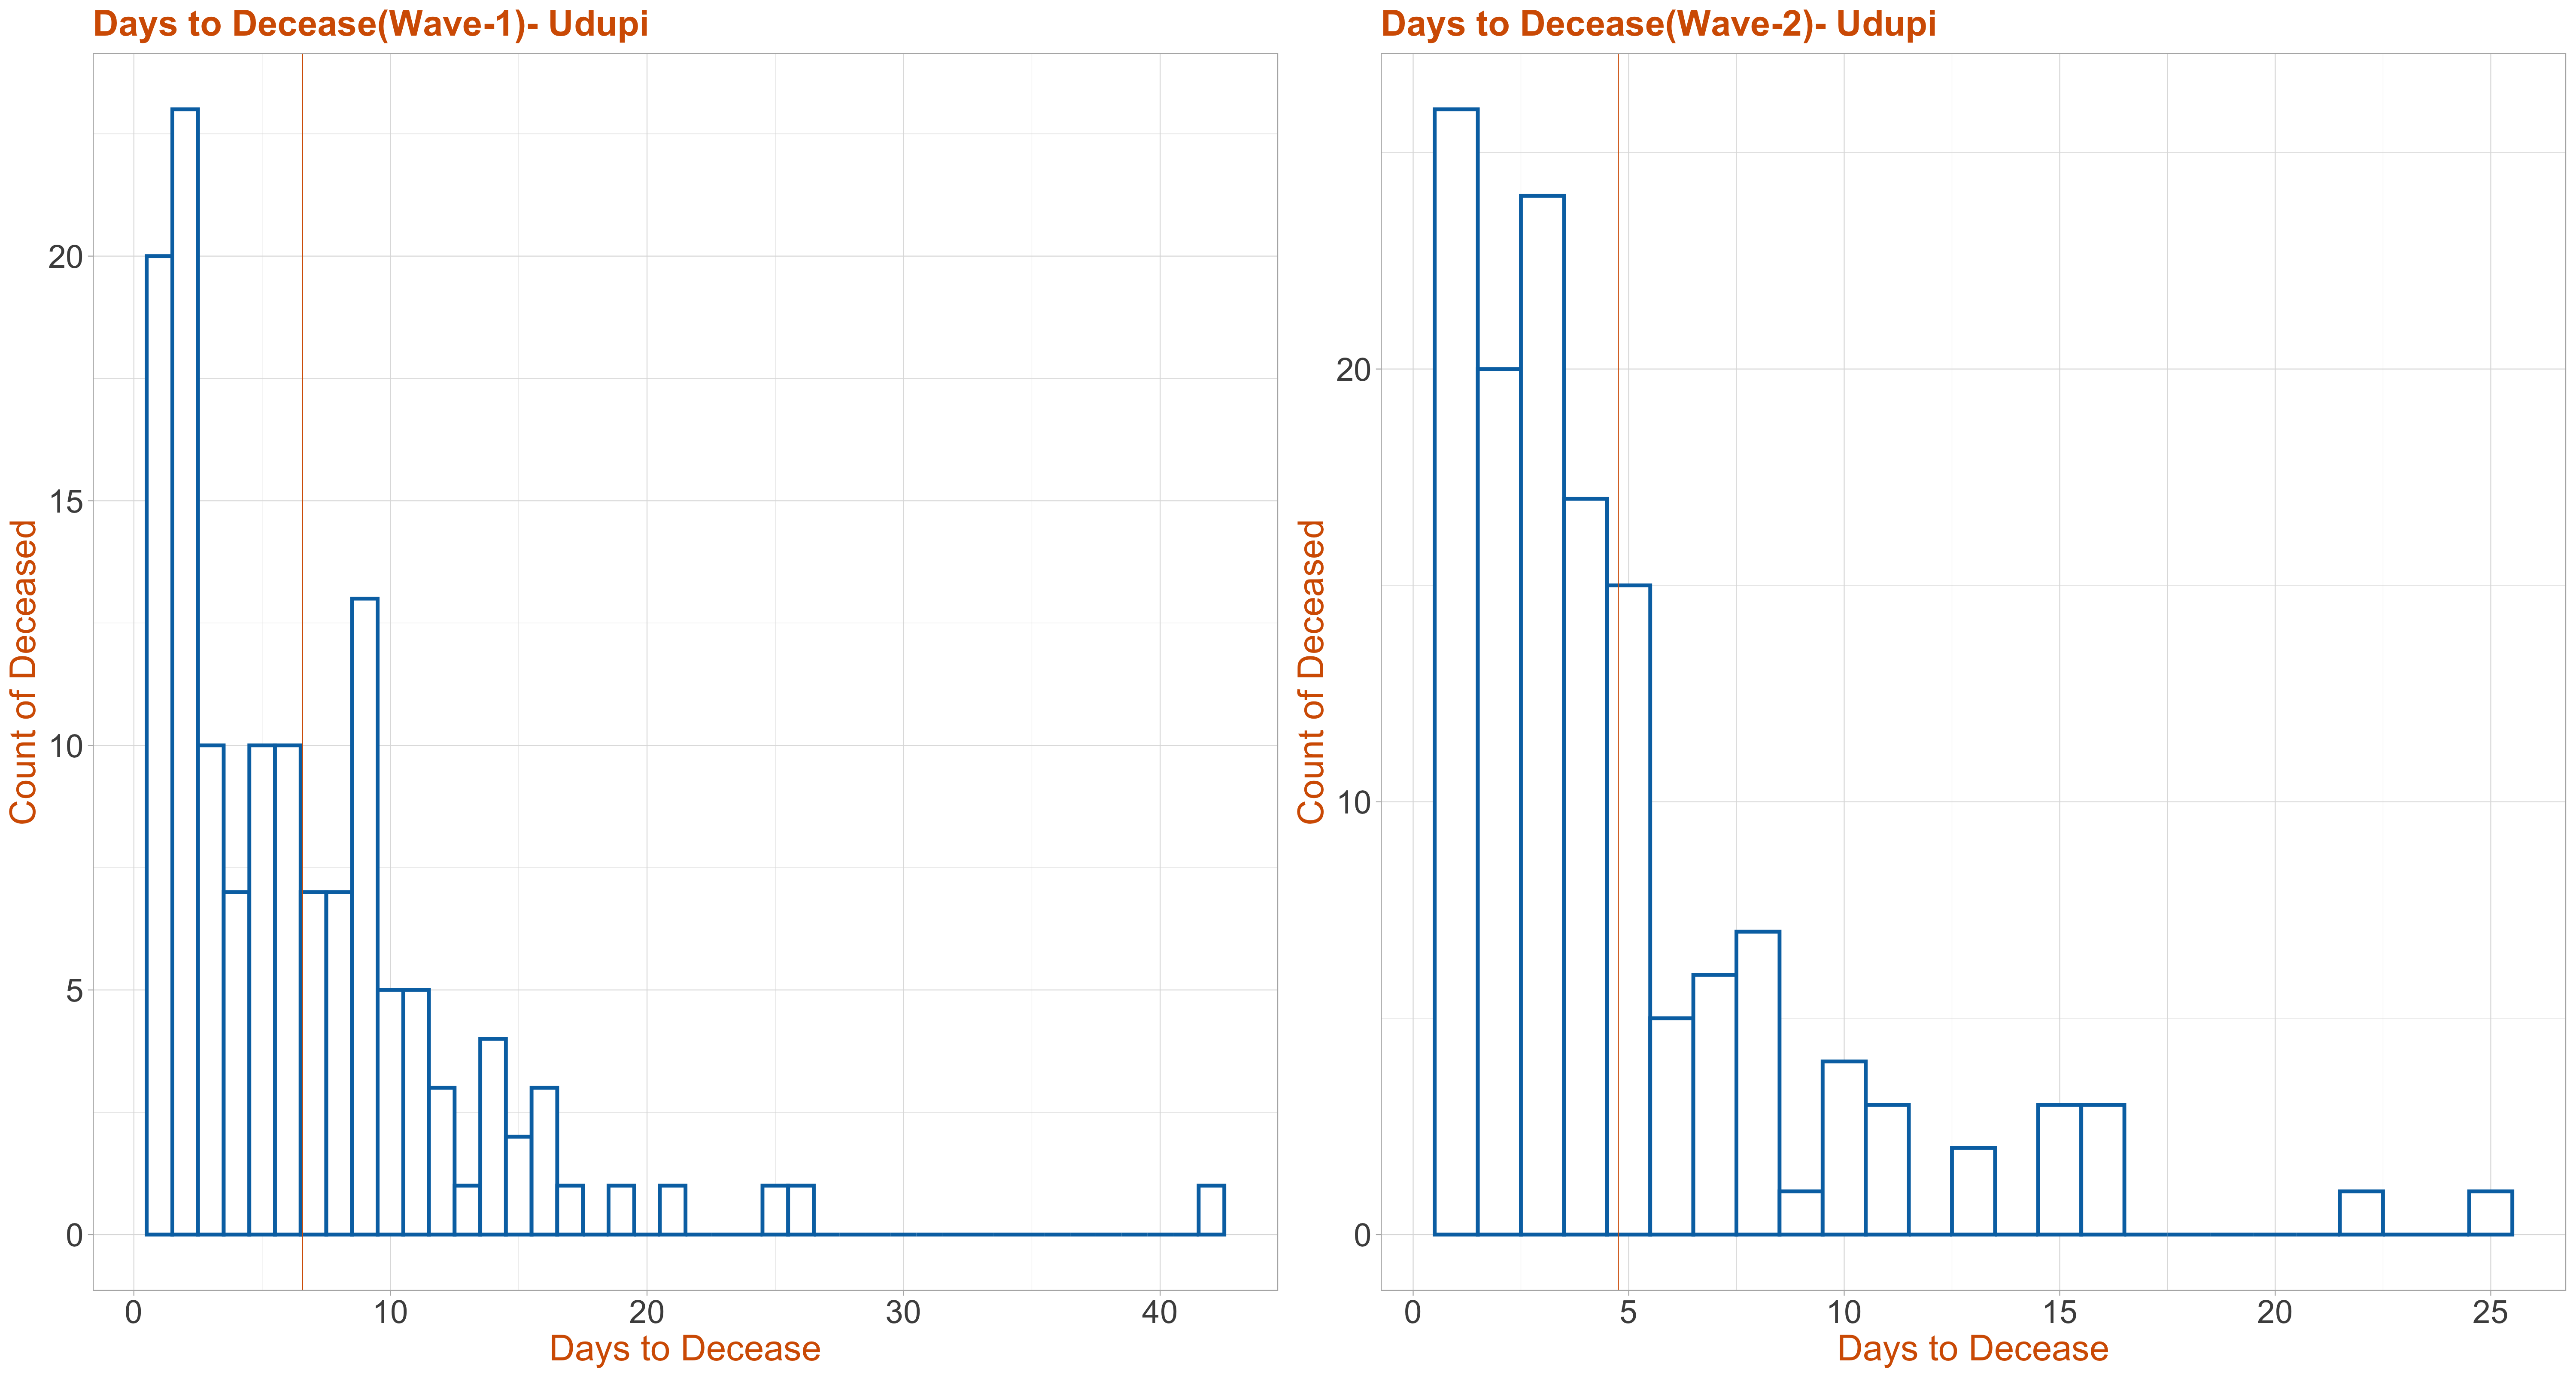
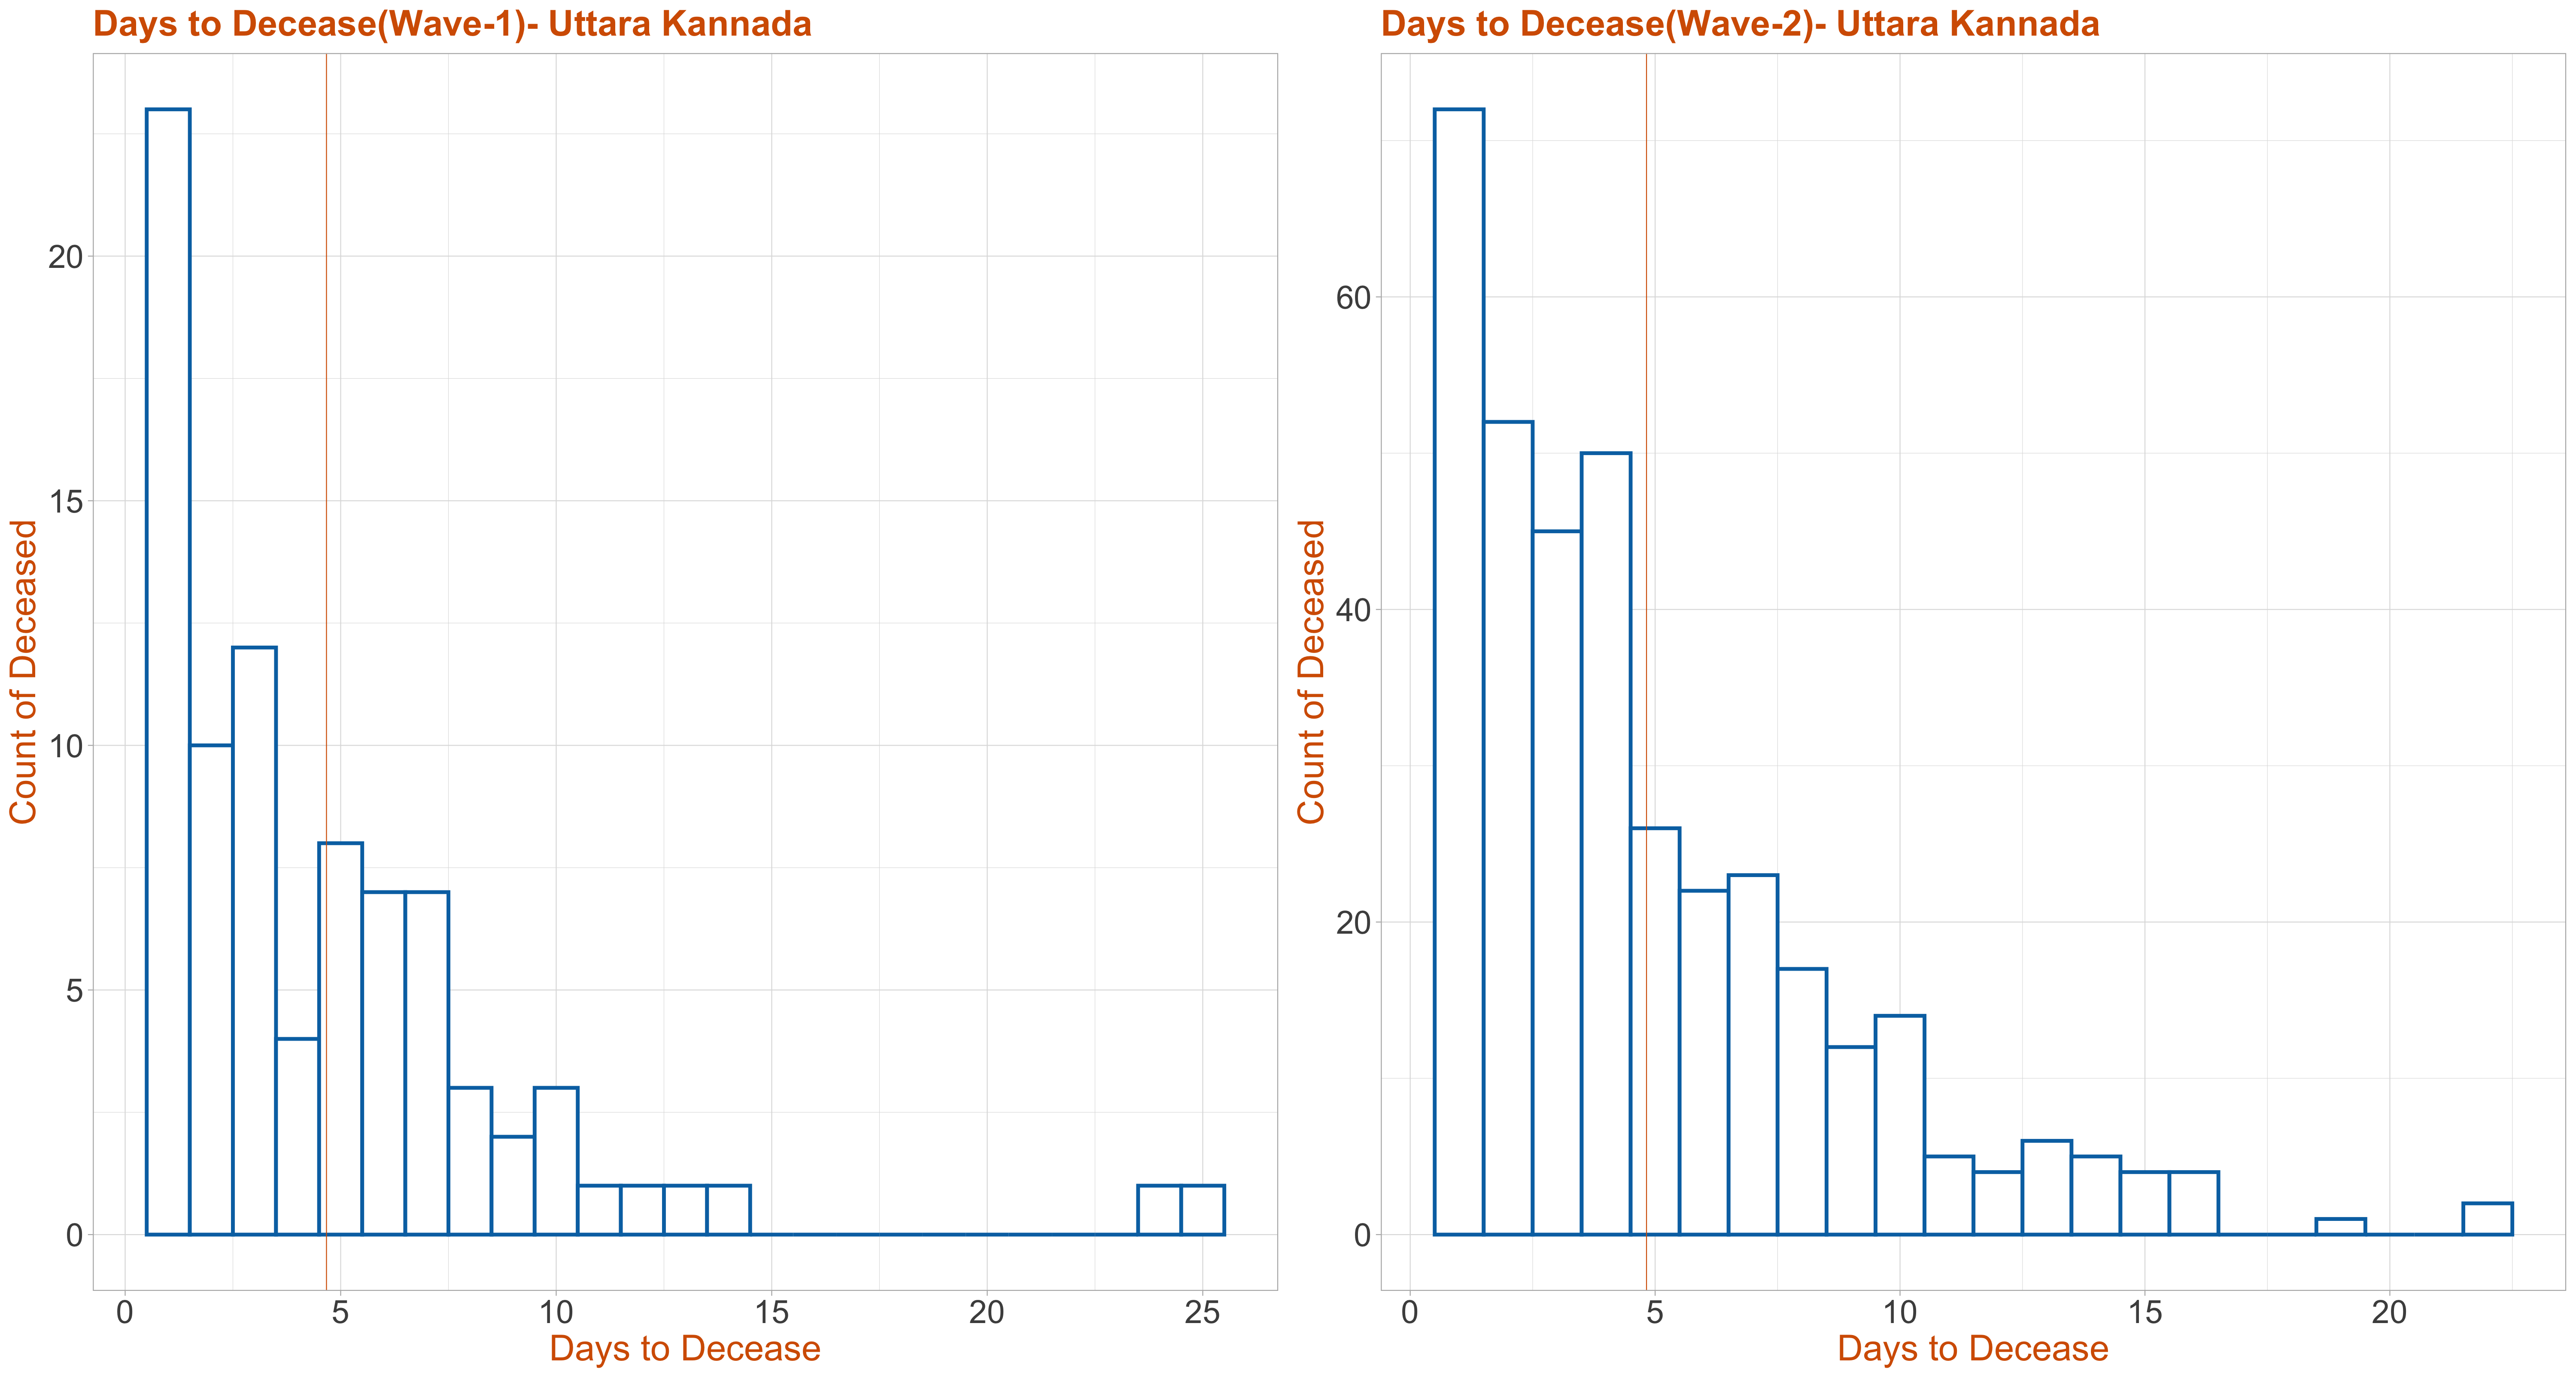
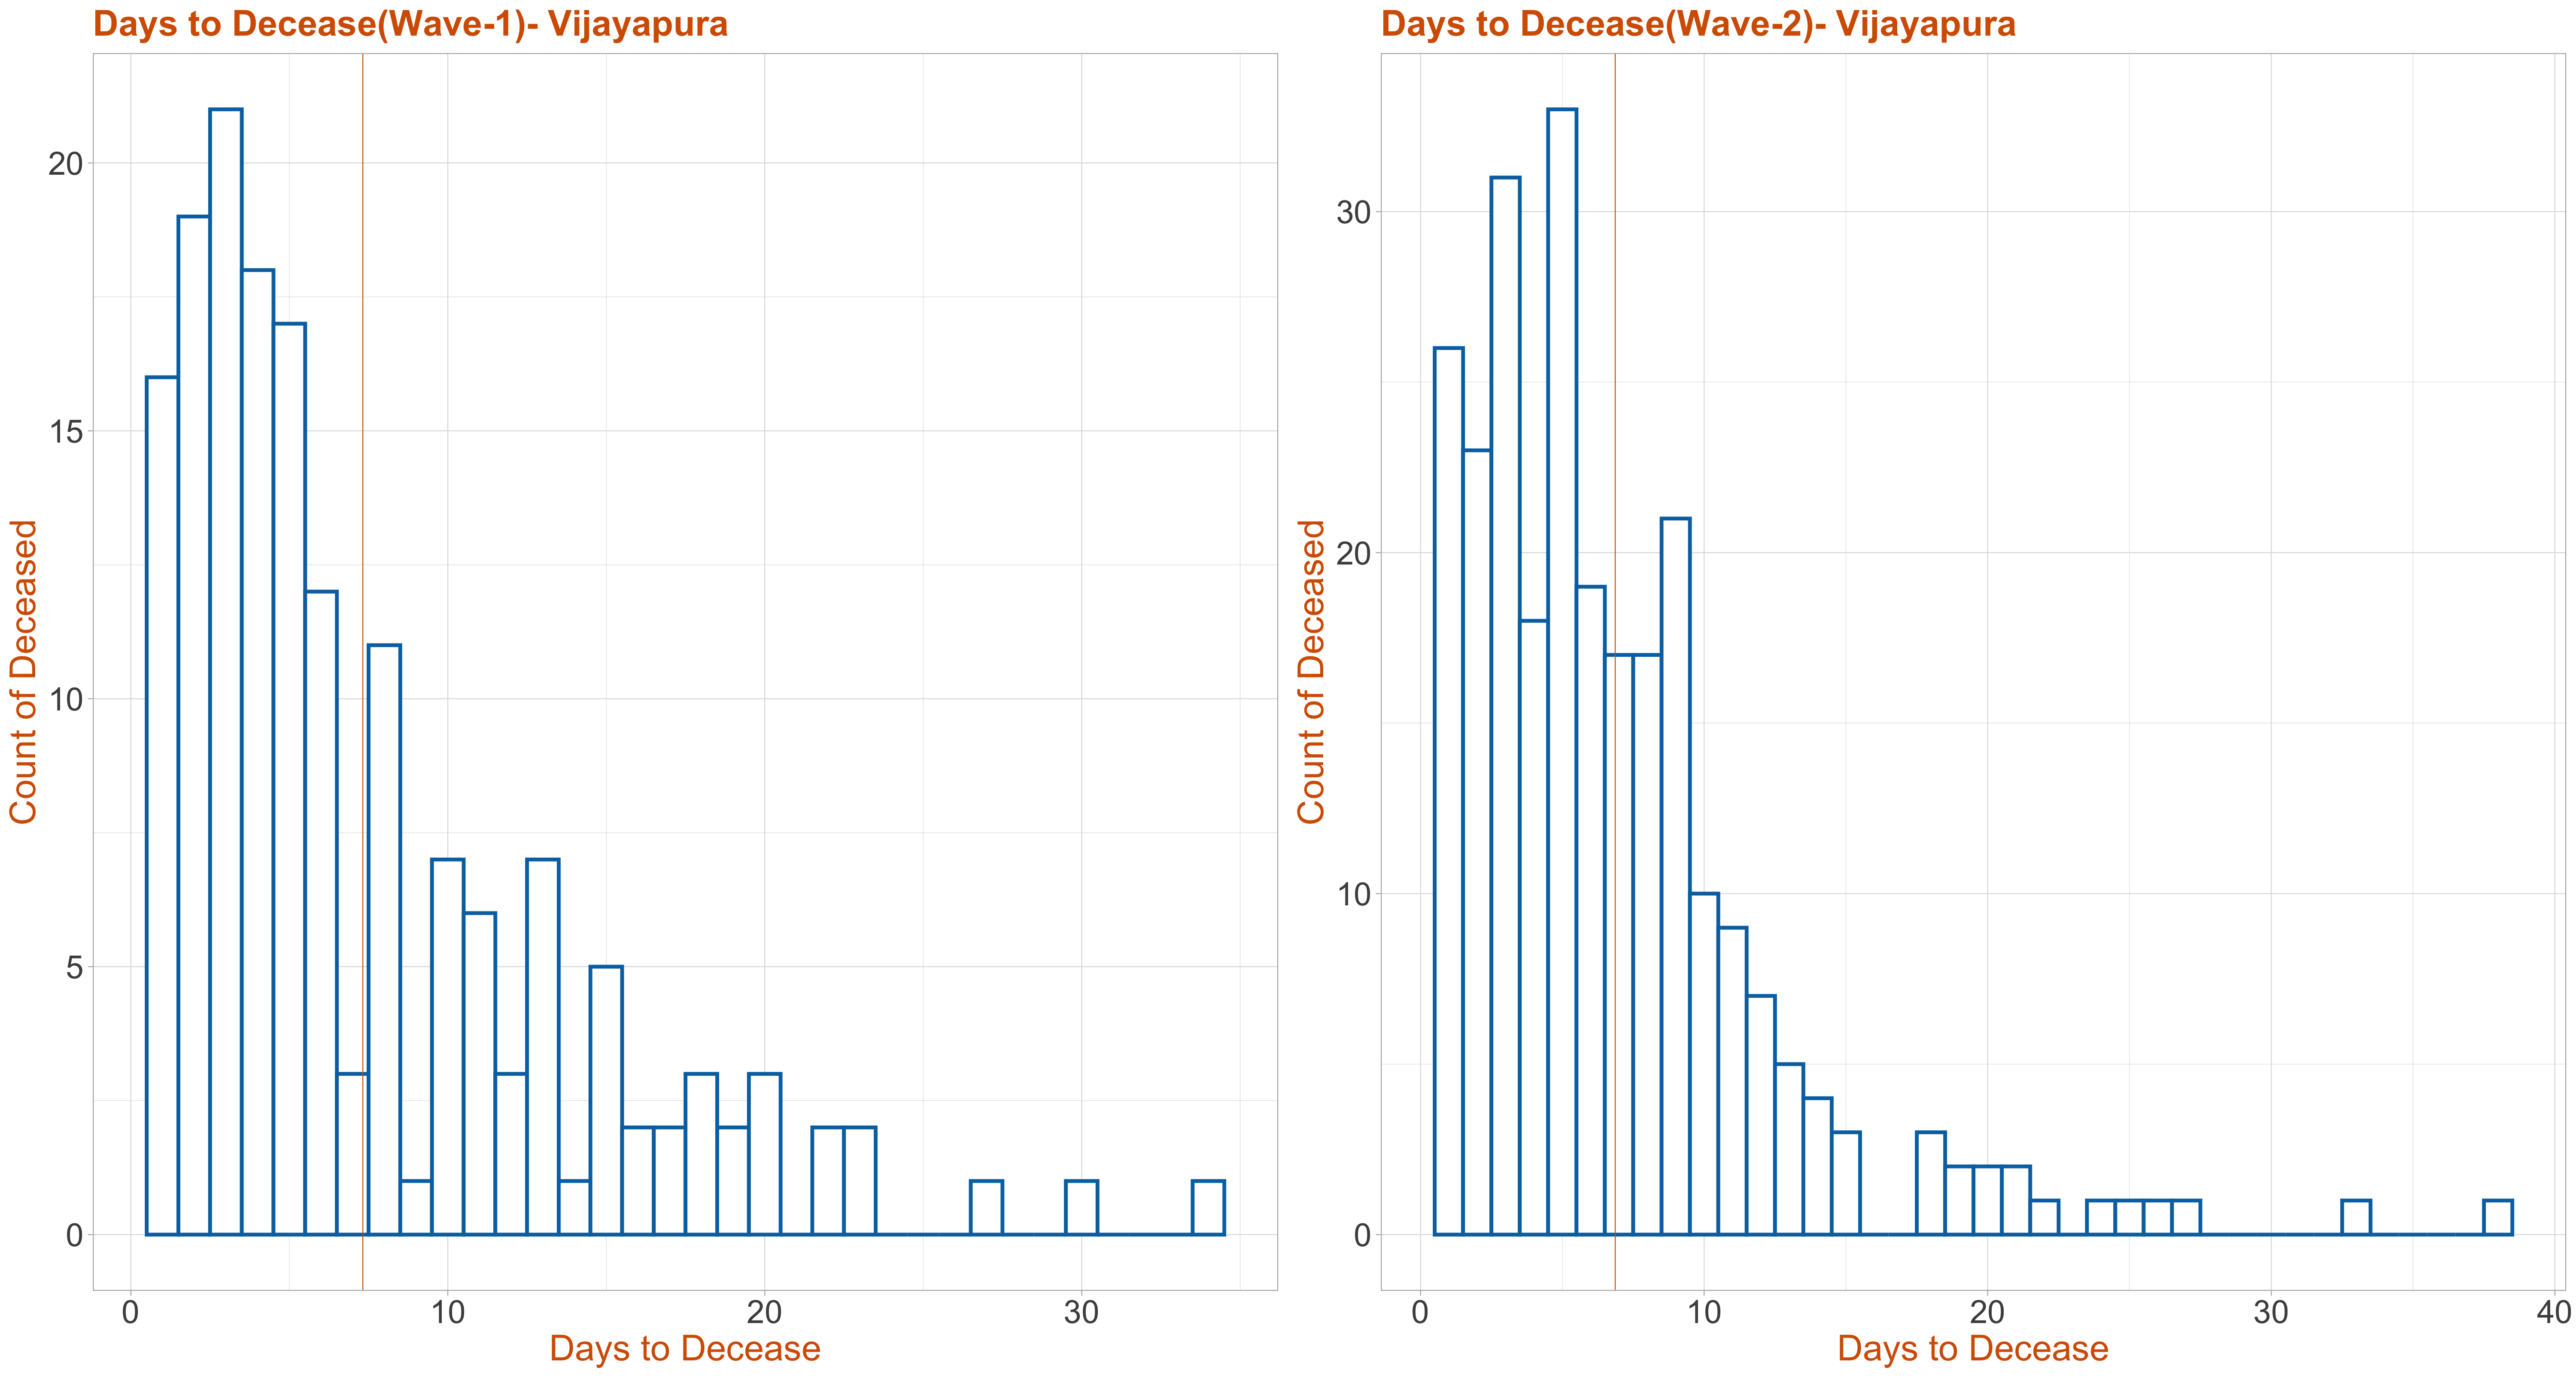
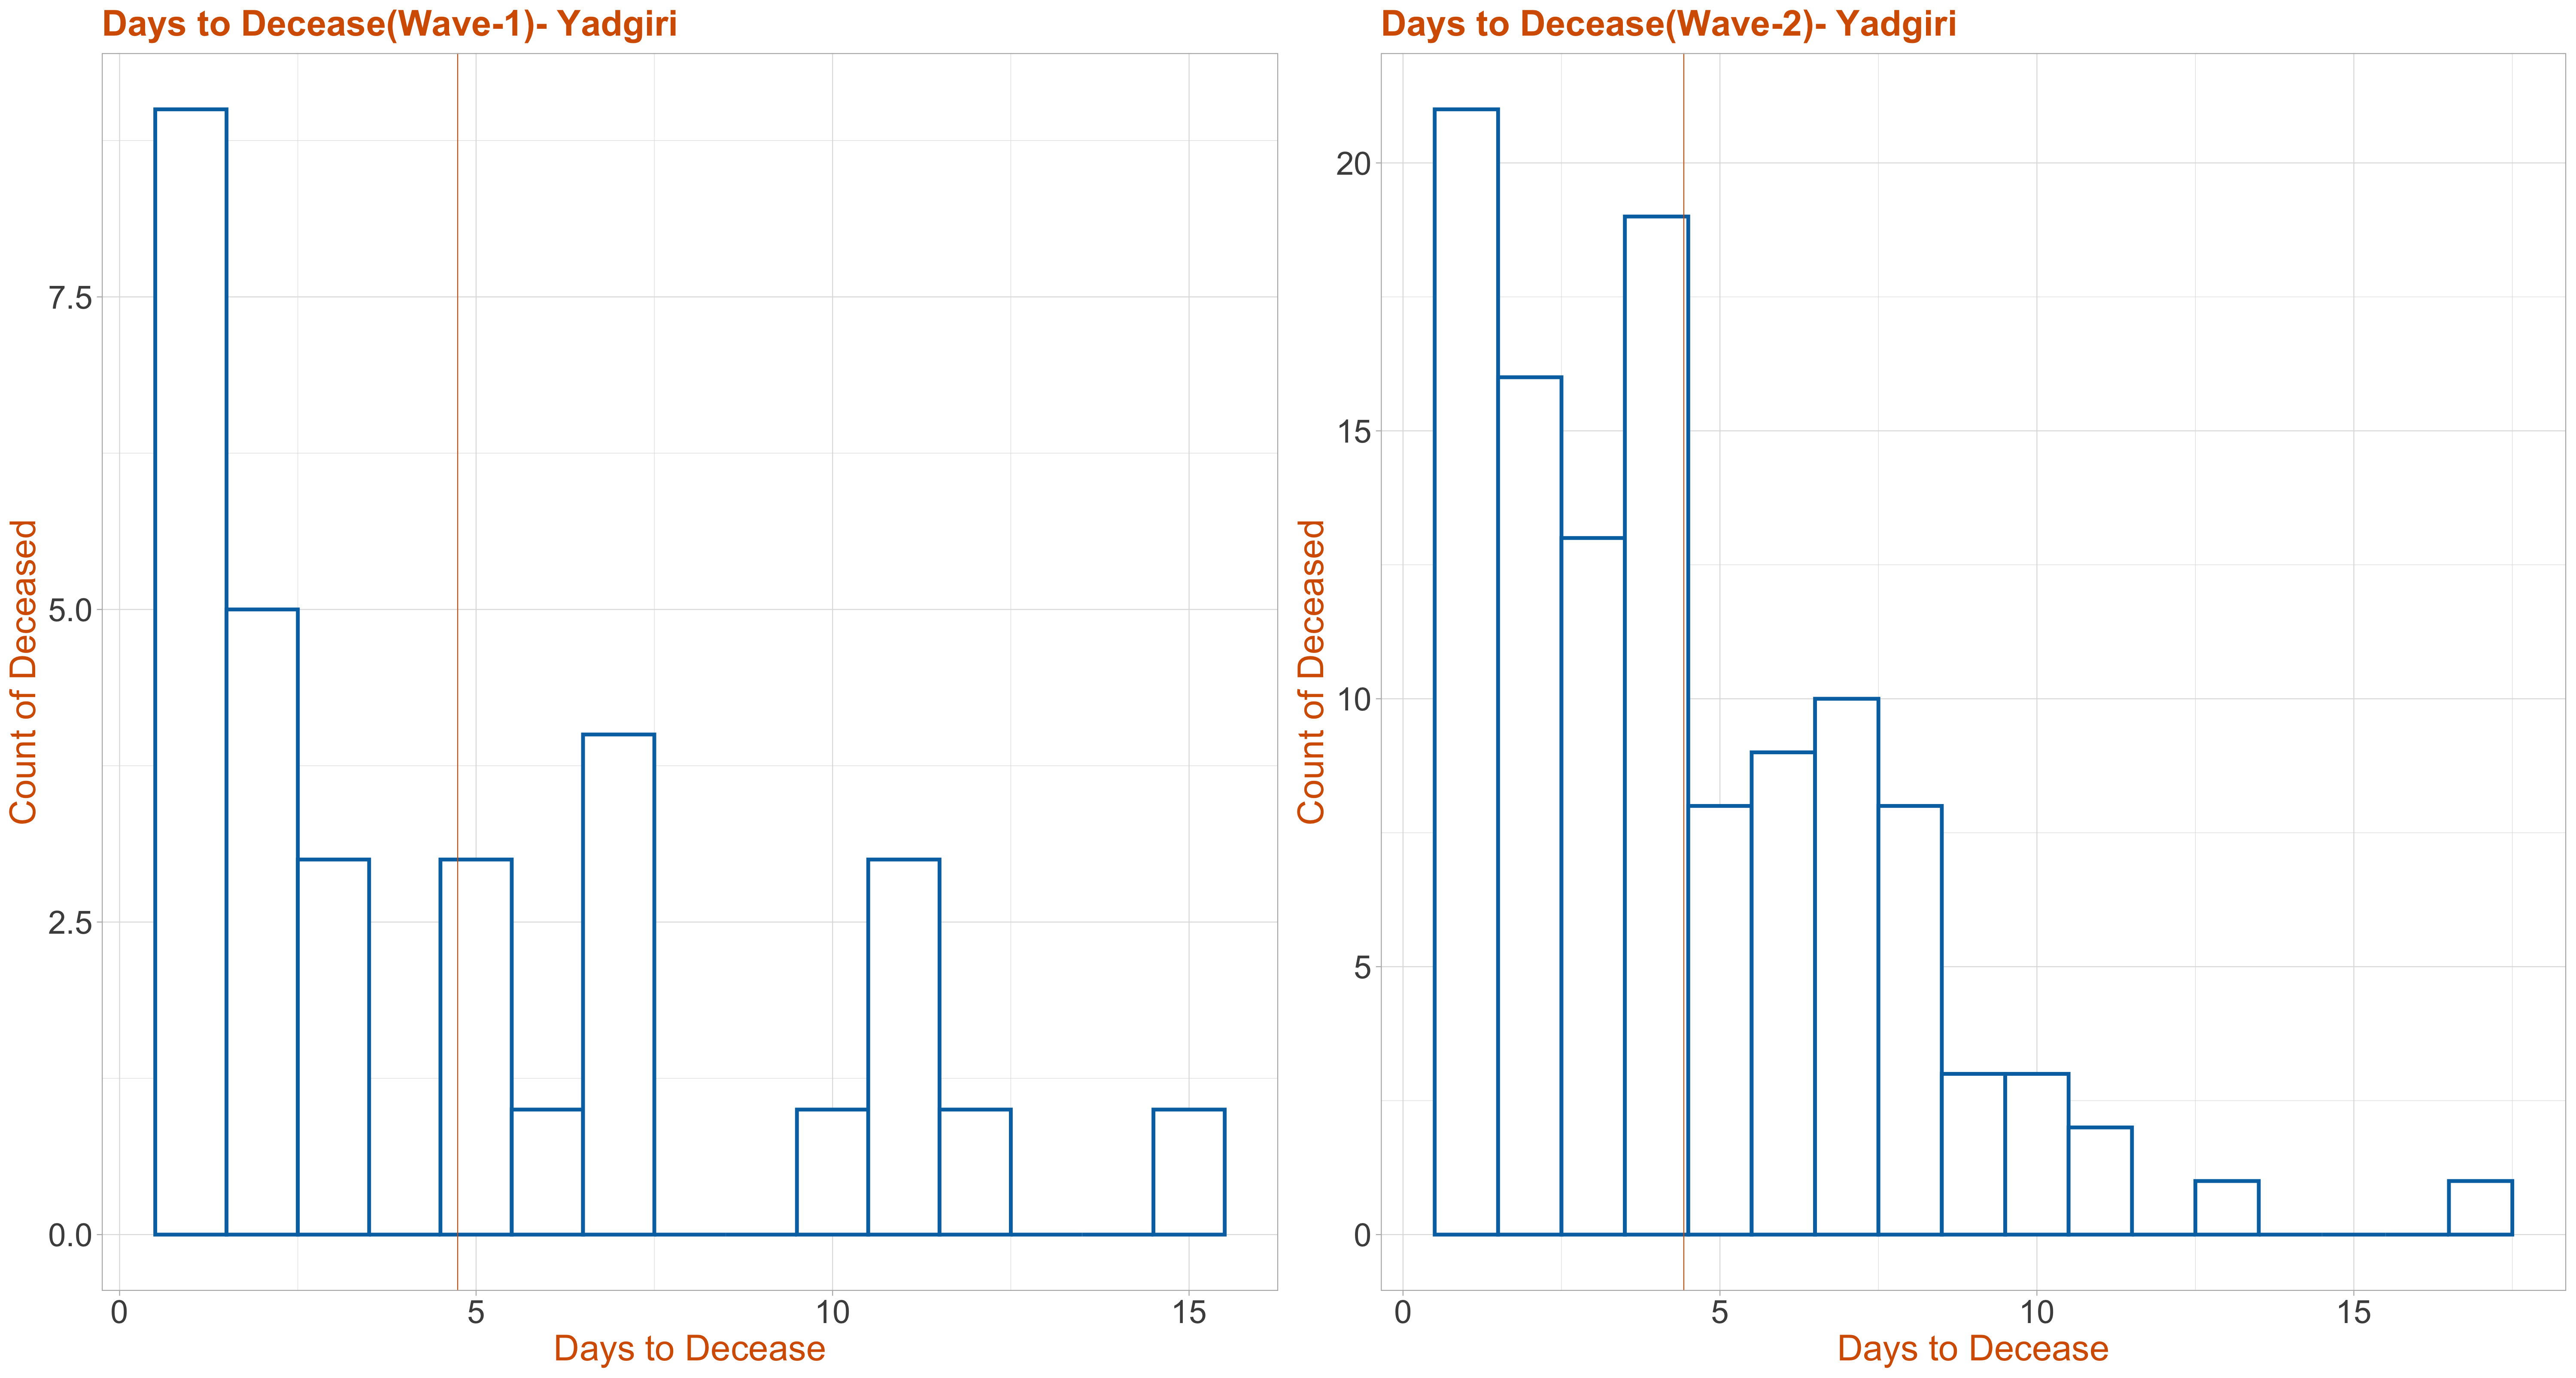
Days to Decease
The Media Bulletin reports each deceased patient as either admitted to hospital, or brought dead or died at residences. For each hospitalized patient we computed the difference between admission date and deceased date to arrive at days to decease.
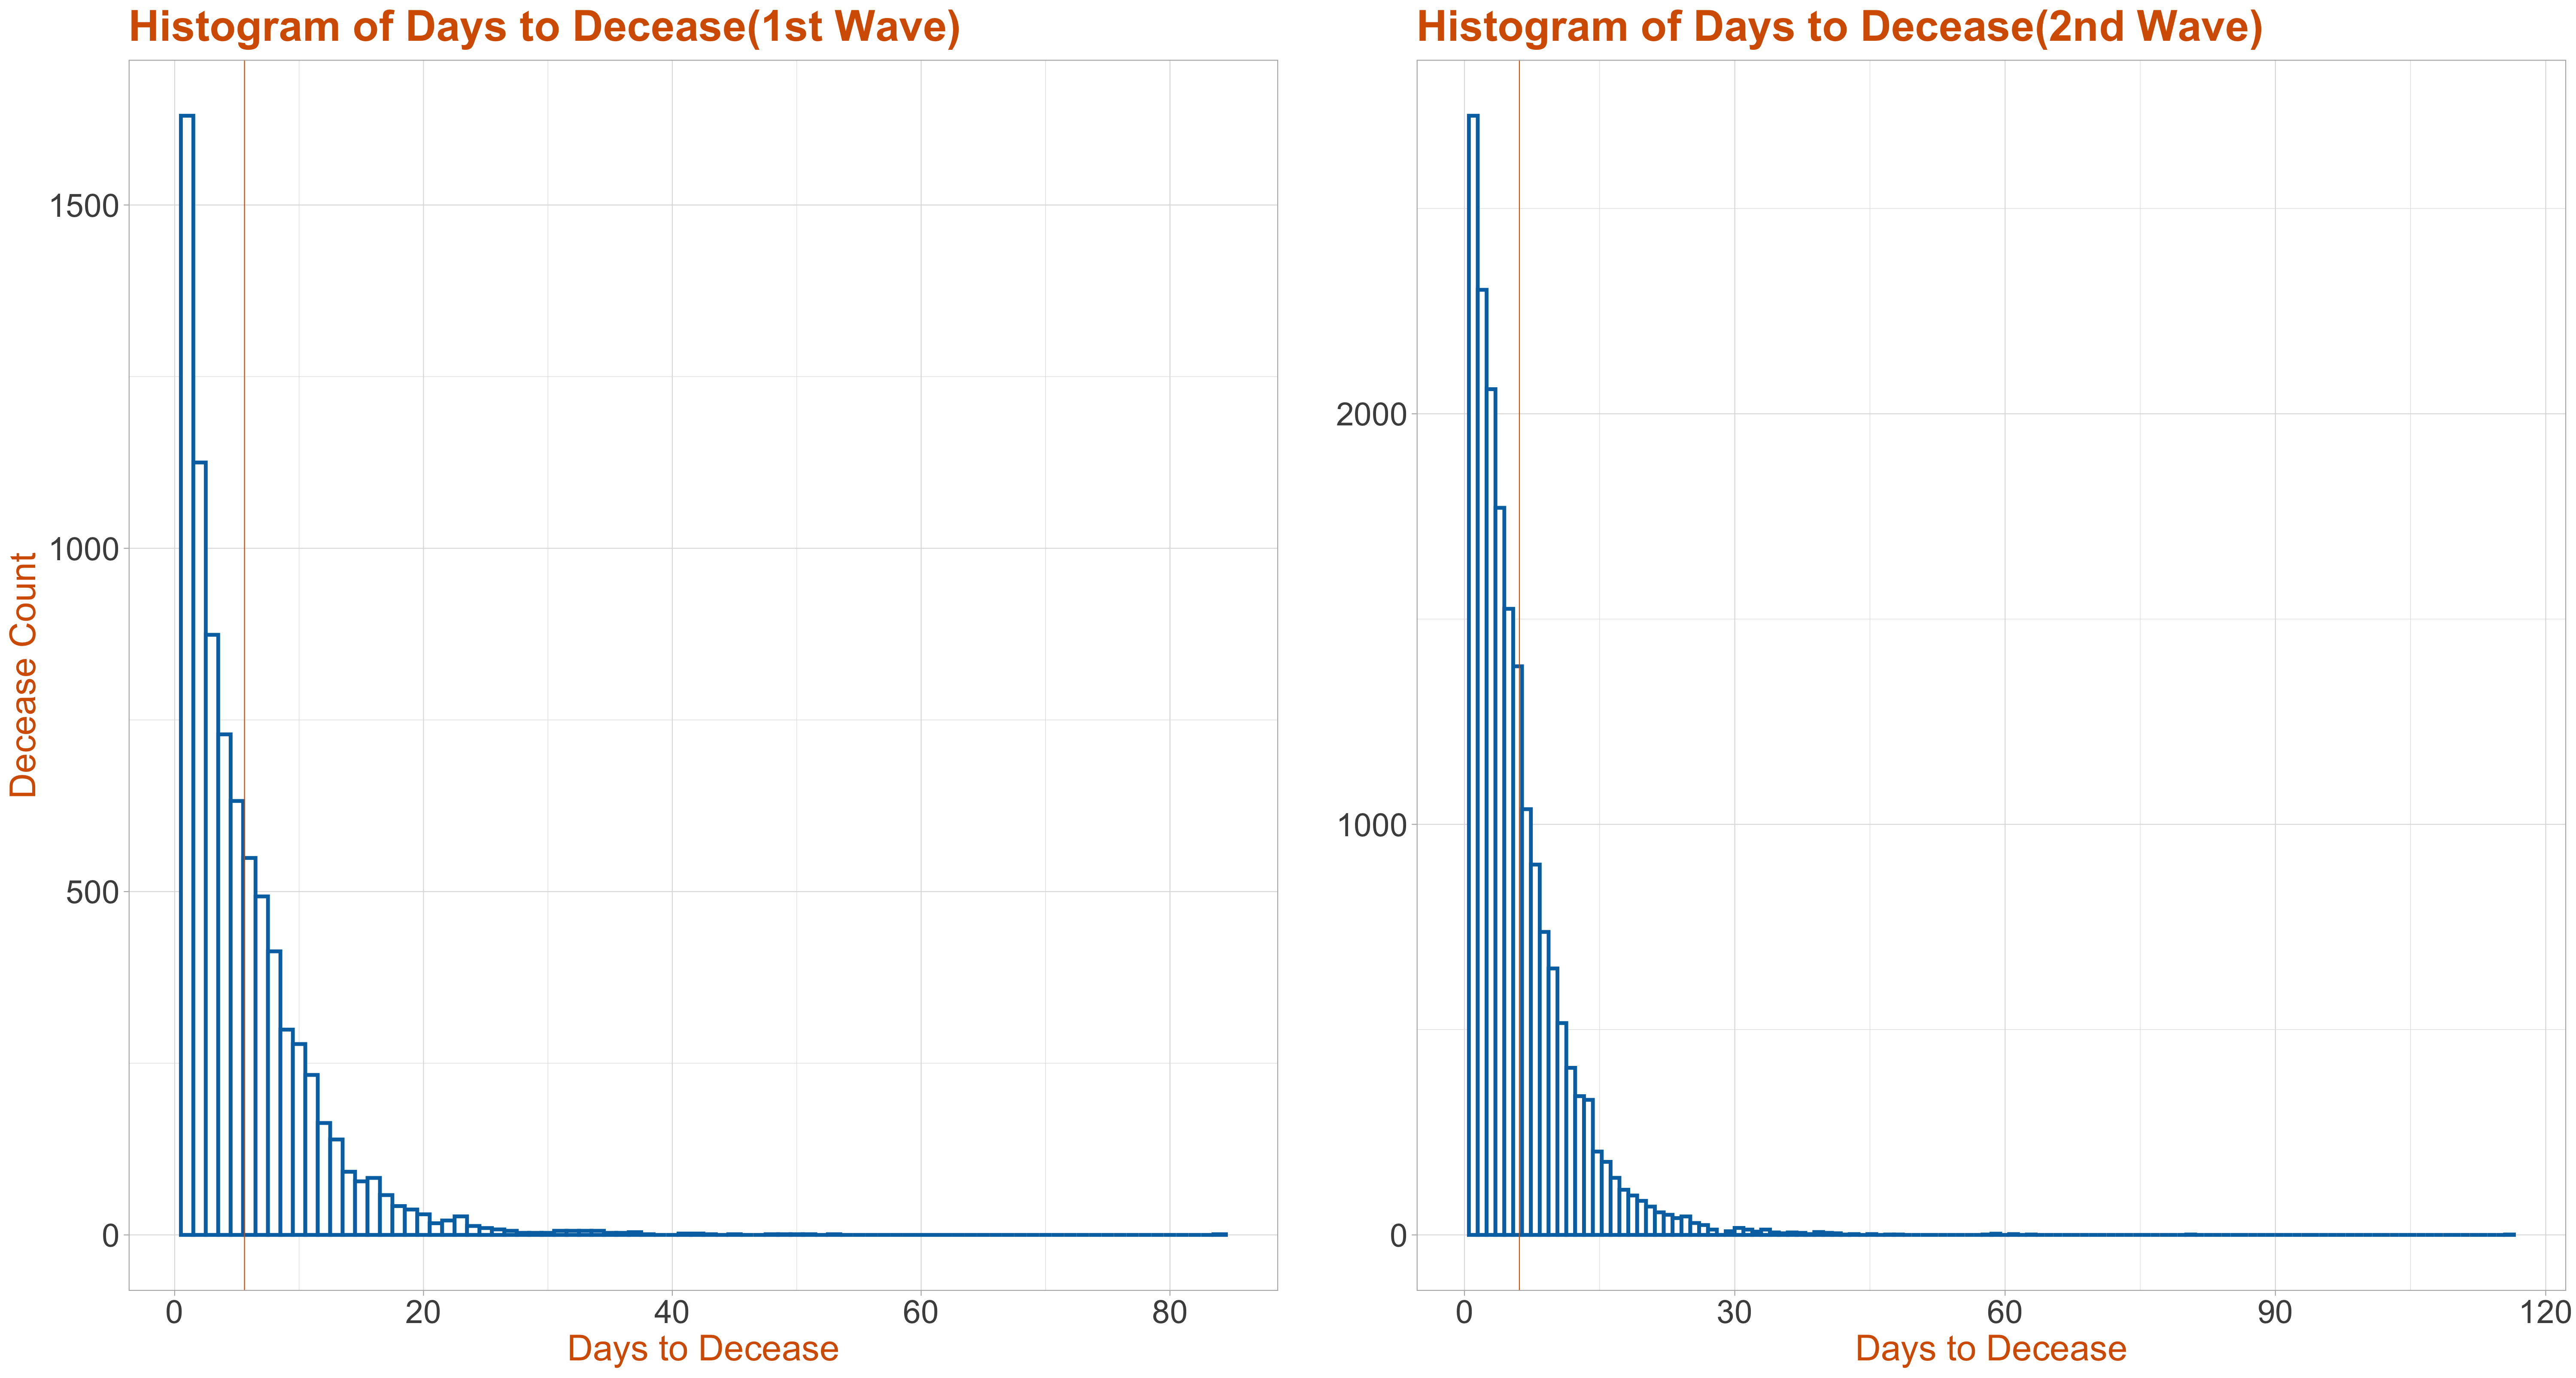
We have partitioned the pandemic timeline into three waves.
- Wave 1 - till the end of October 2020
- Middle wave - from November 2020 till the end of January 2021
- Wave 2 - from February 2021 till present
In the above graph we have plotted histogram of the days to decease for patients in Karnataka State for Wave 1 and Wave 2. In the graphs below we have done the same district wise.