1.1 Definition of graphs and some motivating examples
Some notation : , the usual set product, denote unordered pairs of distinct elements in .
Definition 1.1.
(Graph). A (simple) graph consists of a finite vertex set and an edge set
Remark 1.2.
We shall occasionally consider graphs on countably many vertices. But we shall assume such graphs are locally-finite i.e., vertices occur only in finitely many edge-pairs.
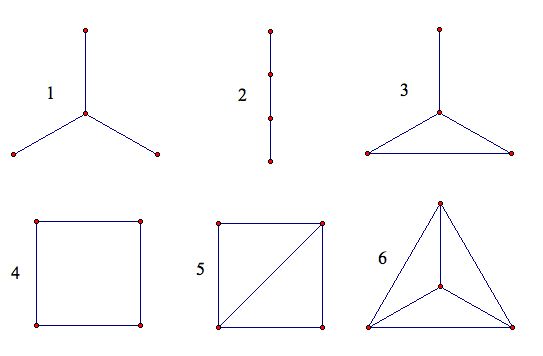
For a vertex set , we represent edges as We also write to denote that . A very common pictorial representation of graphs is as follows : Vertices are represented as points on plane and edges are lines / curves between the two vertices. See Figure 8.111 1 All of the figures in these notes are not mine and taken from the internet. As an exercise, explicitly define the graphs based on these representations.
See these two talks by Hugo Touchette
(http://www.physics.sun.ac.za/~htouchette/archive/talks/networks-short1.pdf ) and
(http://www.physics.sun.ac.za/~htouchette/archive/talks/complexnetworks1.pdf ) for many examples and applications of graphs in real-life problems. We shall briefly touch upon these in our examples as well.
The following two variants shall be hinted upon in our motivation and some examples but we shall not discuss the same for most of the course.
Remark 1.3 (Two variants).
Directed graphs: These are graphs with directed edges or equivalently the edge-pairs are ordered
Multi-graphs: These are graphs with multiple edges between vertices including self-loops.
1.1.1 Popular examples of graphs
Let us see some popular examples of graphs that illustrate the use of graphs in different contexts.
Example 1.4.
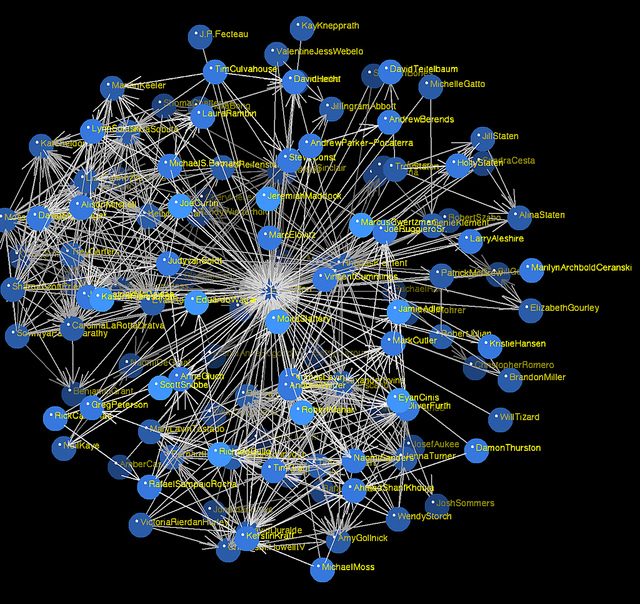
(Facebook graph) is the set of Facebook users and an edge is places between two vertices if they are friends of each other. See Figure 1.2. This is one example of so-called ’social graphs’
Example 1.5.
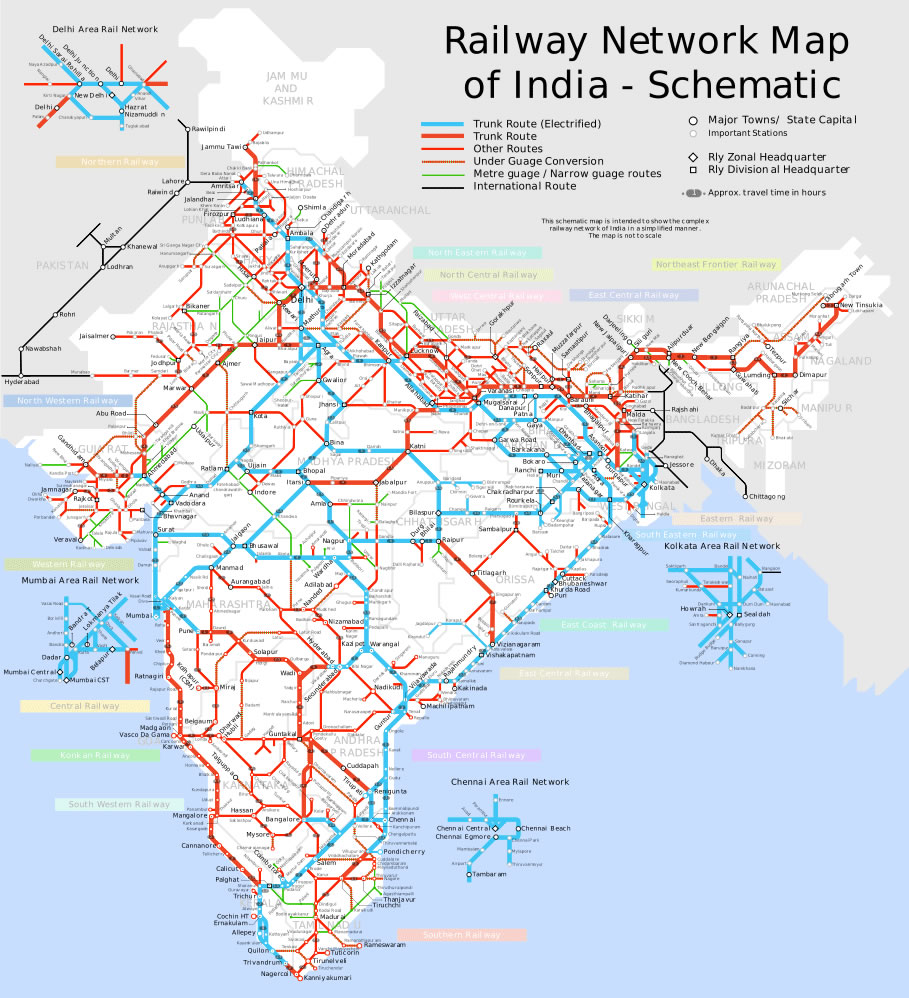
(Road networks) is the set of cities and an edge represents roads/trains/air-routes between the cities. See Figure 1.3
Example 1.6.
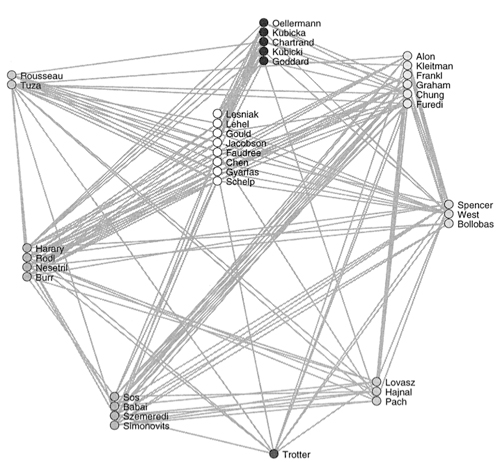
Collaboration graph is the set of all mathematicians who have published (say listed on mathscinet) and an edge represents that two mathematicians have collaborated on a paper together.
Example 1.7.
(Complexity of Shakespeare’s plays) represents the characters in a shakespeare play and an edge between two characters means that both appeared in a scene together. See Figures 1.5 and 1.6 for the graph of Othello and Macbeth.
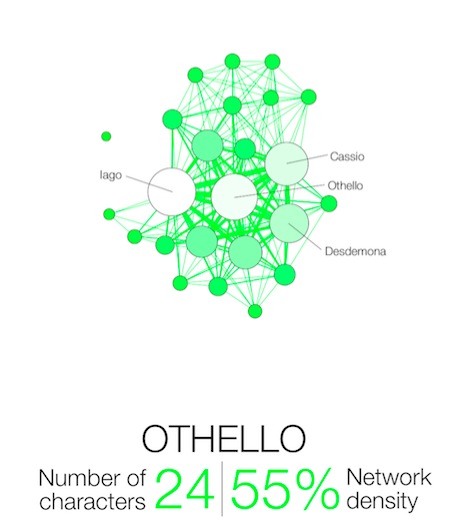
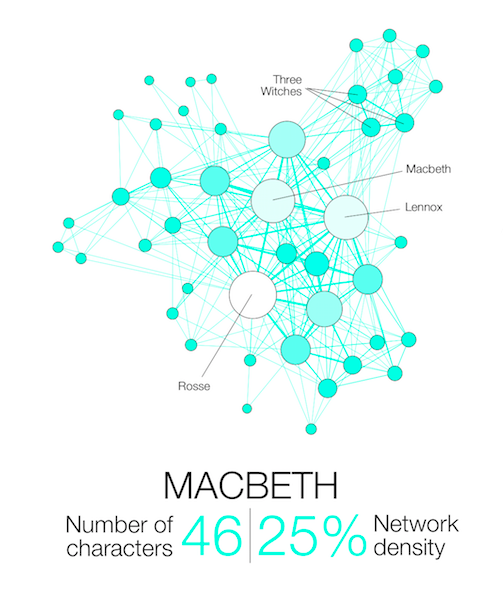
See http://www.martingrandjean.ch/network-visualization-shakespeare/ for more details. Network density is the ratio where denotes the cardinality of a set.
More examples of networks abound in biology
(https://en.wikipedia.org/wiki/Biological_network), chemical reaction networks
(https://en.wikipedia.org/wiki/Chemical_reaction_network_theory) et al. We shall later give a more historical perspective with some more examples.
Definition 1.8.
(Weighted graphs) A graph with a weight function .
Often the weights are non-negative.
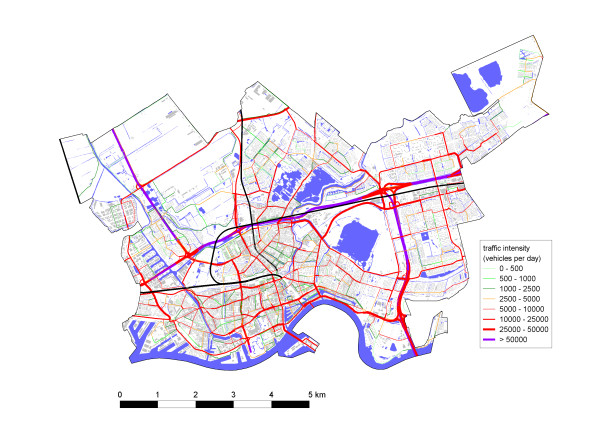
Example 1.9.
(Traffic Networks) is the road network with the weight denoting average traffic in a day. See Figure 1.7
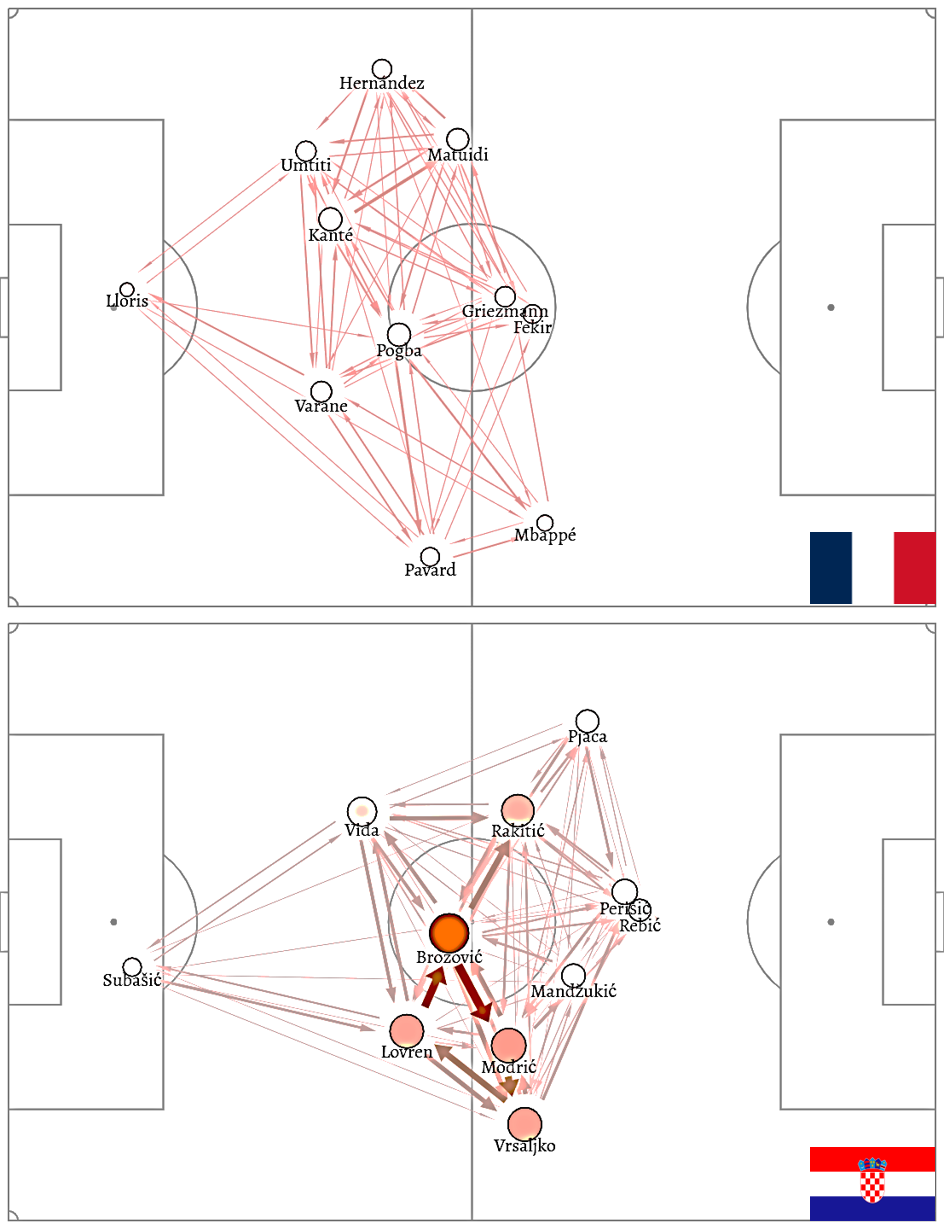
Example 1.10.
(Football graph) This is an example of weighted directed graph. Let the vertex set be the players in a team and directed edge from to represents that player has passed to player . Associated with such a directed edge , a weight that denotes the number of passes from player to player . Now see the football graph from the France vs Croatia final in 2018 WC in Figure 1.8. More such graphs are available https://grafos-da-bola.netlify.app/ Each vertex is also weighed with its degree and colored accordingly. As one can observe that although Croatia has more number of passes but France’s pass are well distributed.
As another example, see the football graph from the Spain vs Holland final in 2010 WC in Figure 1.9
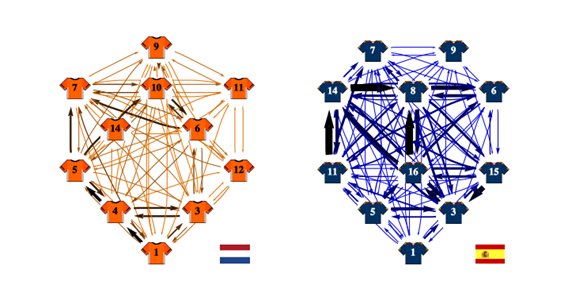
Spain’s passing game is very evident in the graph
This illustrates best the appealing visualization offered by graphs and also gives a good way to analyse such effects in sports and other domains.